

Today, NHS England published its Combined Performance Summary, which provides data on key performance measures for December of last year and January of this year. SitRep data for the first week of February was also released, giving a more up-to-date analysis of how the NHS is coping this winter. Here we show some of these statistics and how they compare with previous years.
In March 2019, the Clinically-Led Review of NHS Access Standards Interim Report was released, proposing some significant changes to many of the targets reported on here. A six-month Progress Report from the NHS Medical Director was also published in October 2019.
For urgent and emergency care, field testing of the proposed new standards began in 14 hospital trusts on 22 May 2019. The first stage of testing focused on measuring the “mean time in A&E”, when compared to the existing four-hour target. The field test sites have not been submitting four-hour performance data since May, so the national time series omits these sites’ A&E performance. The time series data presented here excludes the field testing sites and so is comparable across months and years.
For elective care, field testing of the proposed new standards began in 12 hospital trusts in early August. These trusts are testing the use of an average (mean) wait measure for people on the waiting list as a potential alternative to the current 18-week threshold target. Performance of the field test sites will continue to be included in the national time series, so the data is fully comparable over time.
For interactive charts showing the quality of health and social care over time, please refer to our 200+ indicators.
A&E
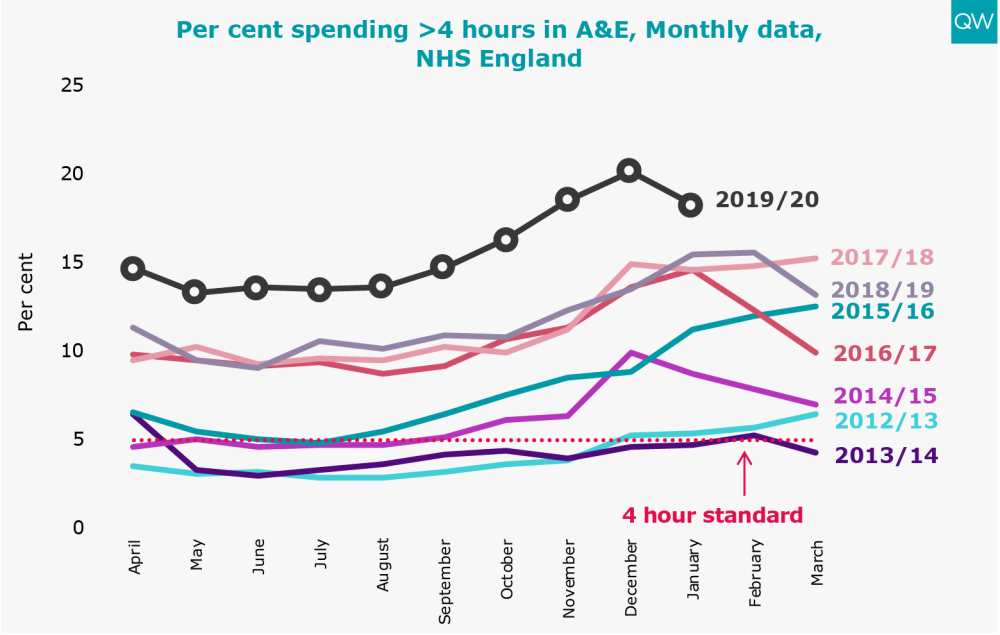
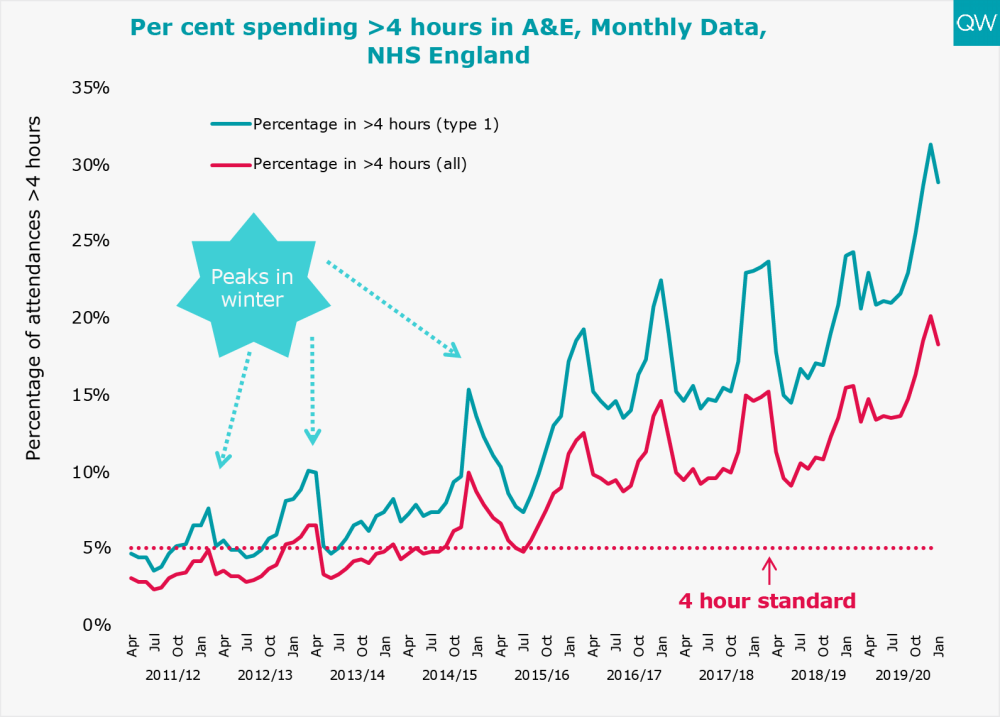
- In January 2020, 18.3% of people attending A&E spent more than four hours from arrival to admission, transfer or discharge – the worst performance for any January since records began.
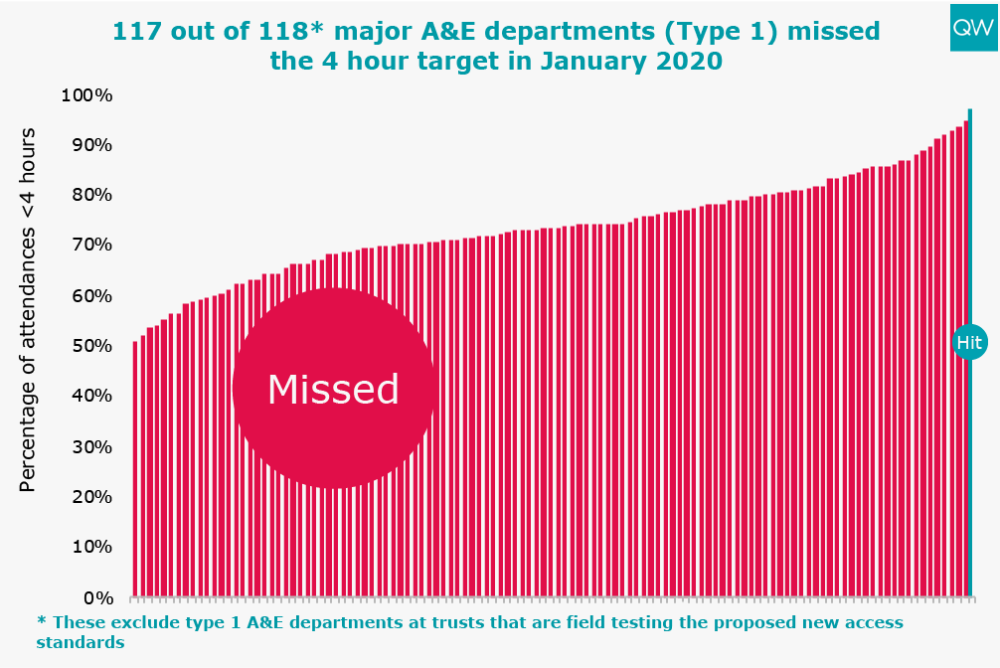
- Only one out of 118 major A&E departments (type 1) that submitted performance data met the four-hour A&E waiting time target in January 2020.
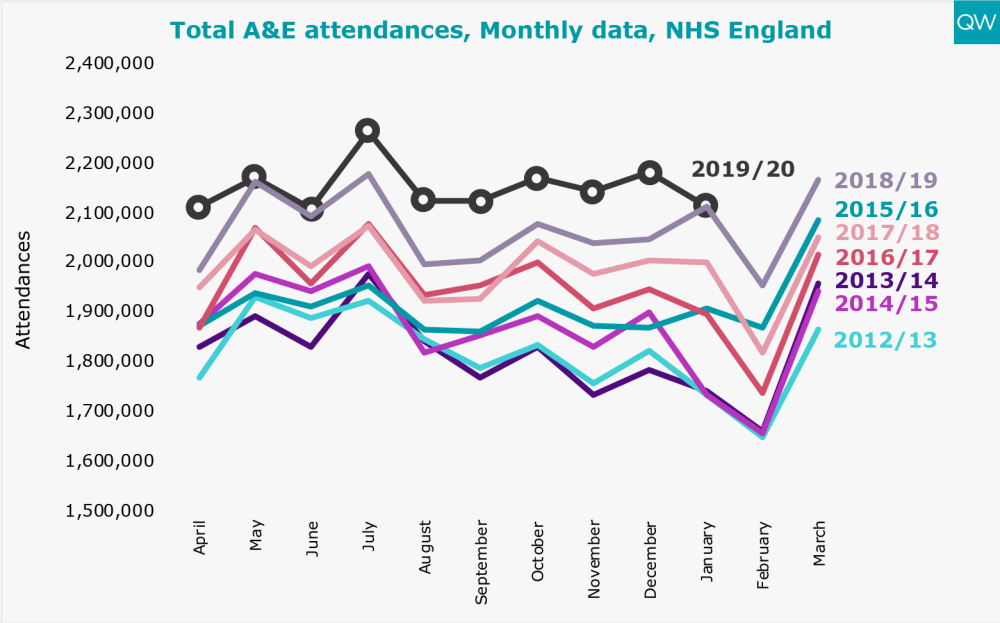
- The total number of A&E attendances exceeded 2.1 million in January 2020, which is about the same as it was in January last year. There was an average of 68,214 A&E attendances per day.
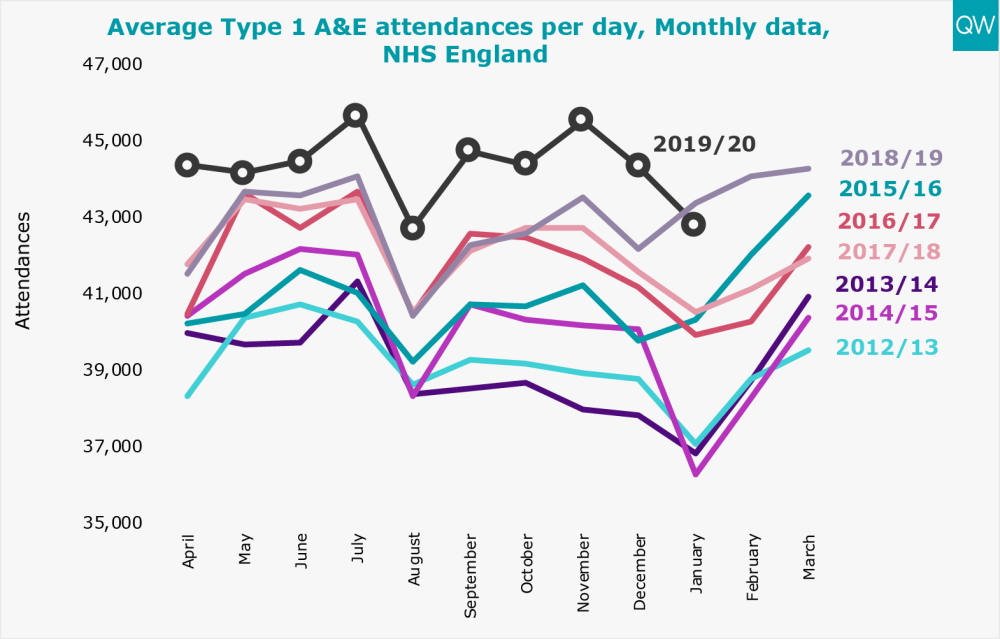
- There were over 1.32 million type 1 A&E attendances in January 2020. This equates to an average of 42,814 type 1 A&E attendances per day – a decrease of 1% compared to January 2019.
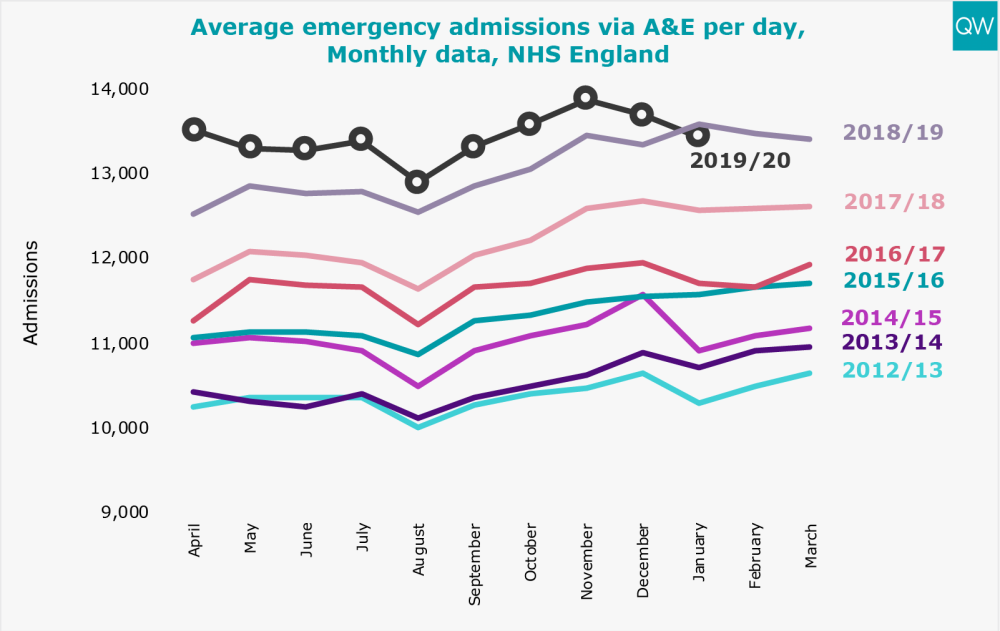
- Emergency admissions via A&E have been increasing year-on-year, but decreased in January 2020 to 416,541. There were on average 13,437 emergency admissions via A&E per day, which is 1% lower than January 2019.
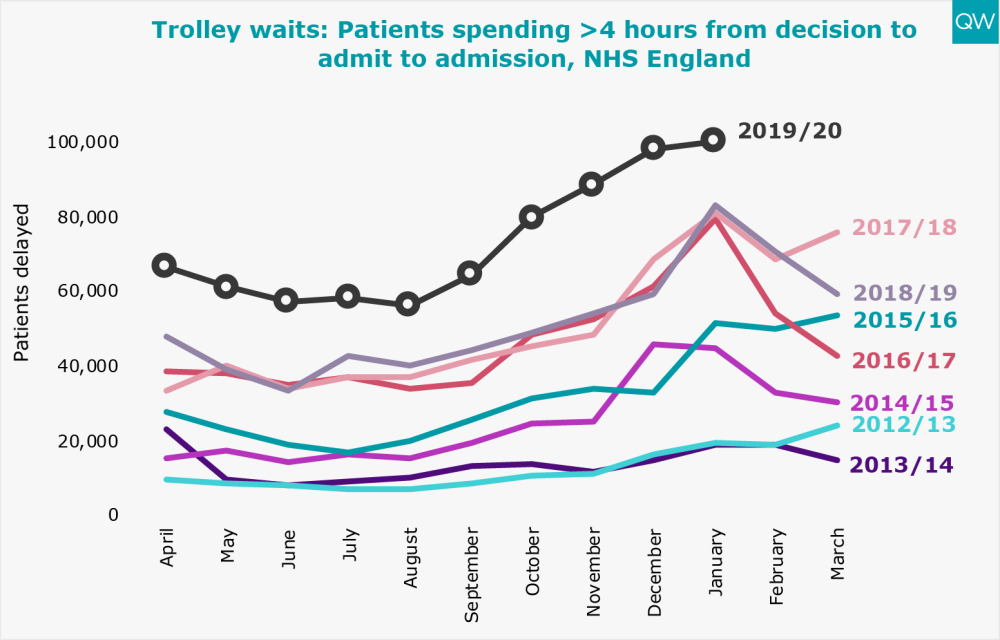
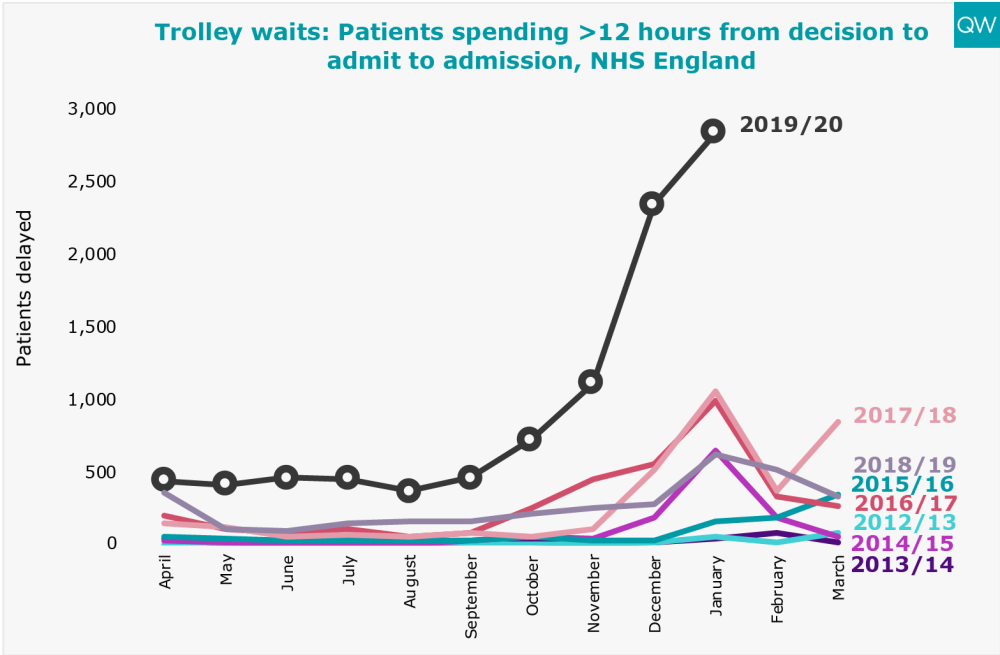
- 100,578 patients spent more than four hours waiting on a trolley from a decision to admit to admission in January 2020; this is the highest since records began. 2,846 patients had a trolley wait of over 12 hours, which is more than four times higher than in January 2019.
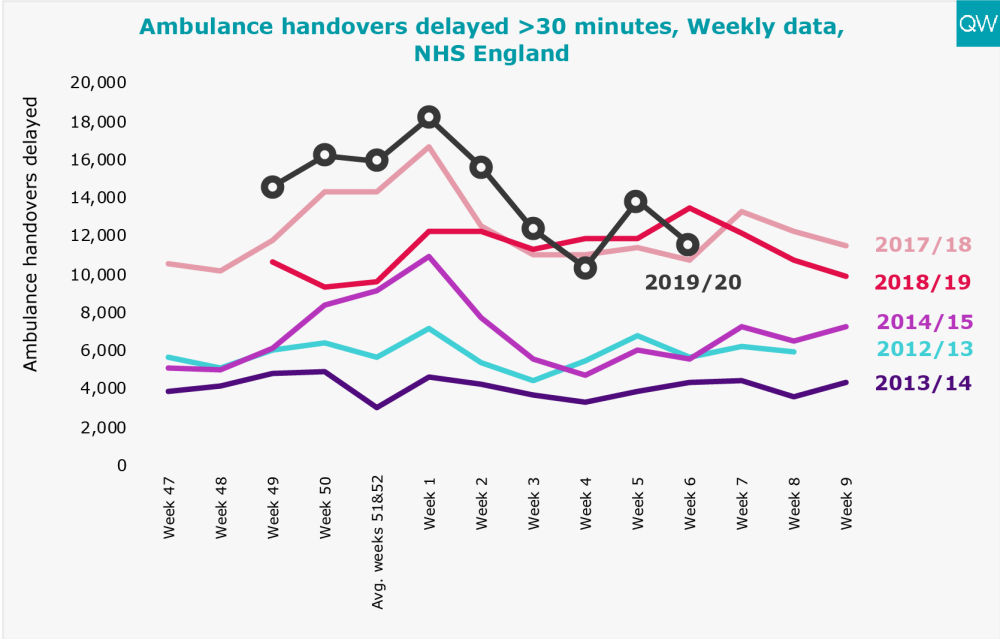
Ambulance handover delays
- In Week 6 of 2020 (commencing 3 February 2020), 93,938 people arrived by ambulance and 11,605 of them experienced a handover delay of over 30 minutes (12%). This is almost 2,000 fewer delayed ambulances in Week 6 of 2020 compared to Week 6 of 2019.
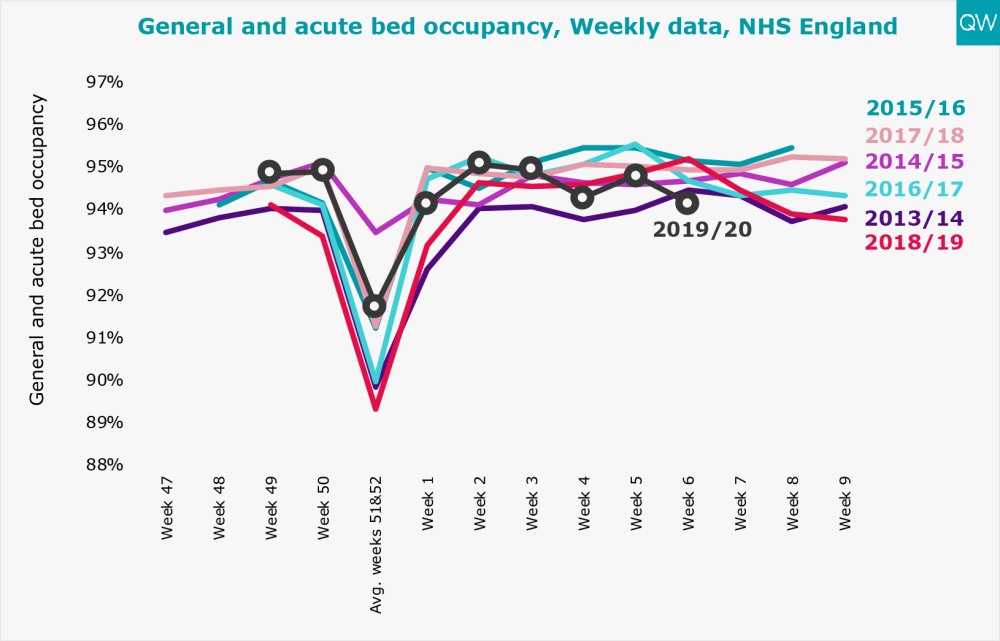
Bed occupancy
- General and acute bed occupancy was 94.2% in Week 6 of 2020. This is slightly lower than Week 6 of any year since records began.
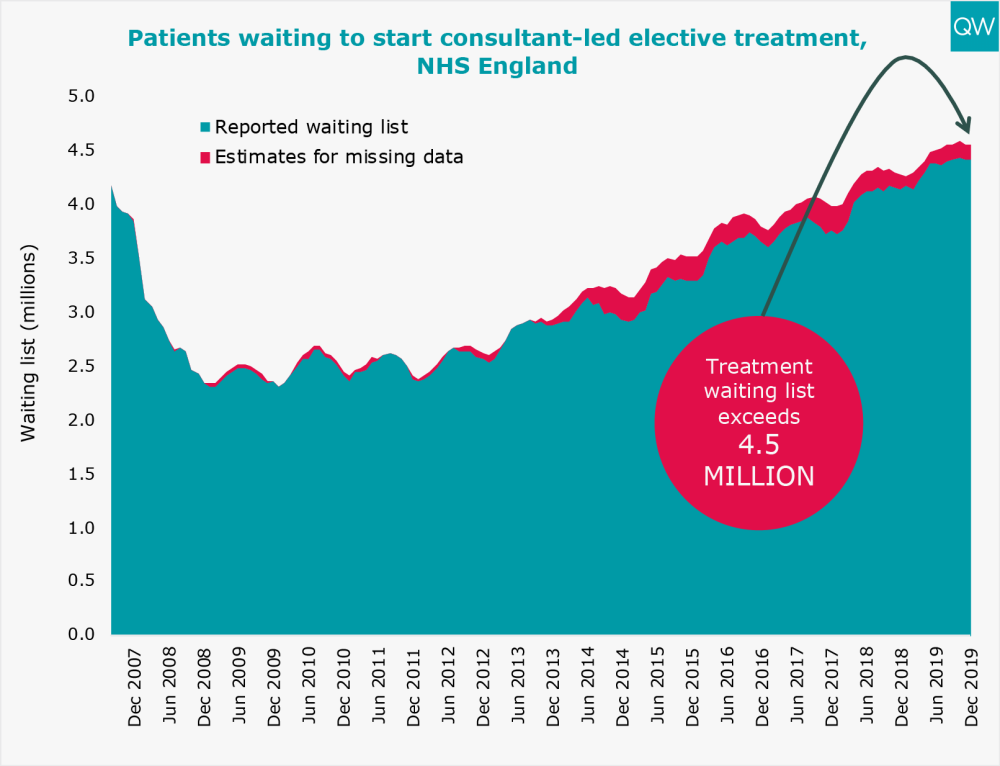
Treatment and diagnostic test waiting times
- The total number of people waiting to start consultant-led elective treatment remained above 4.5 million in December 2019 (reported waiting list plus the estimate of missing data).
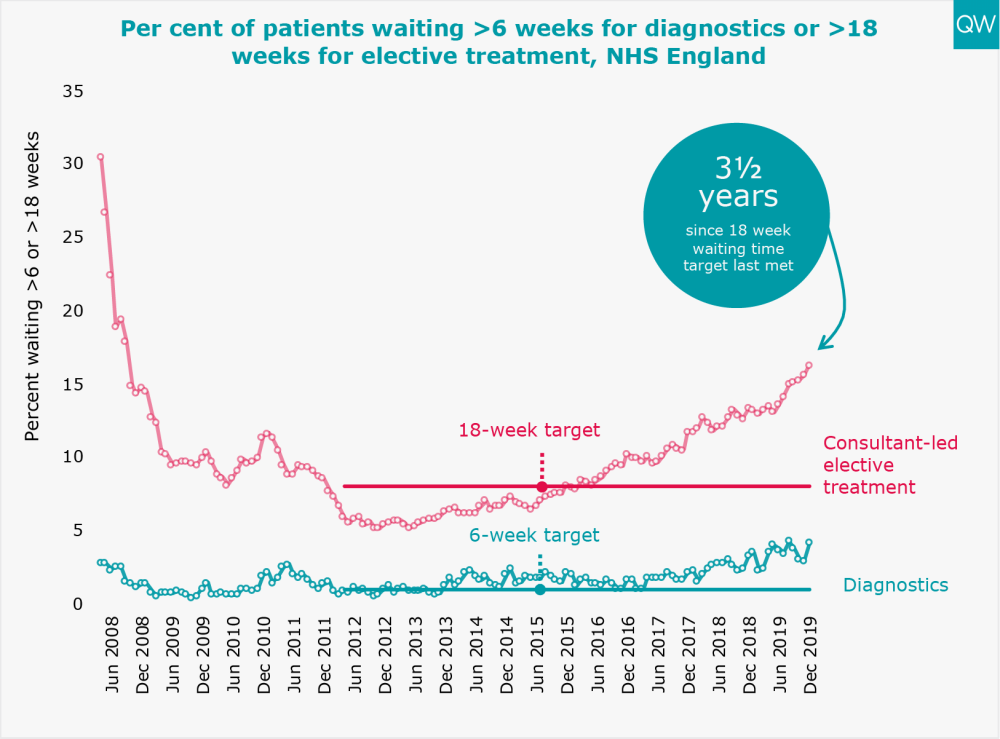
- The proportion of people waiting over 18 weeks to start elective treatment reached 16.3% in December 2019 – the highest level since September 2008.
- In December 2019, 4.2% of patients had been waiting over six weeks for a diagnostic test. The diagnostic waiting time target has not been met for six years.
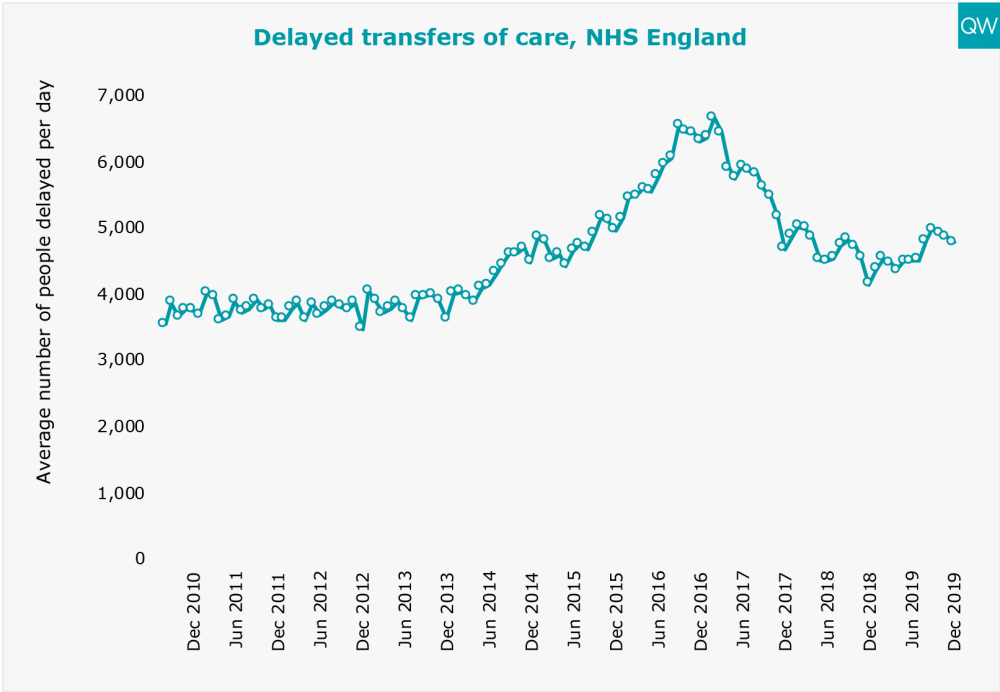
Delayed transfers of care
- There was an average of 4,777 people delayed per day in December 2019. This is 24% lower than it was in December 2016, but 31% higher than it was in December 2013.
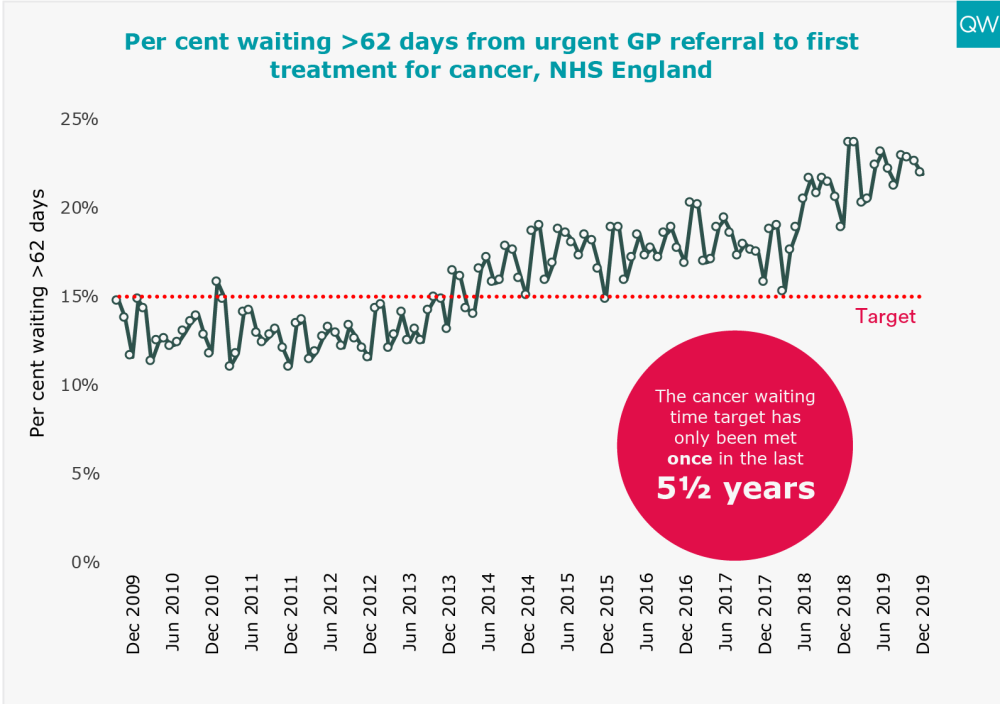
Cancer waiting times
- In December 2019, over one in five patients (22%) waited longer than two months to start their first treatment for cancer following an urgent GP referral.
- The 62-day cancer target has not been met for four years.
© Nuffield Trust & The Health Foundation