
After the second national lockdown in England, our Q&A examines the number of Covid-19 cases and how the pattern has changed since the first wave earlier in the year. We also explain key sources of data on the numbers of coronavirus cases, how best to interpret them, and where the gaps are in our understanding of trends in the numbers of cases.
This Q&A includes data published up to 4 December.
How many people have Covid-19?
There are two main sources of regularly updated data on cases: the Office for National Statistics (ONS) survey, which started reporting in May, and the daily reporting of people tested.
The ONS survey estimates that in the week from 22 to 28 November, one in 105 people in England had Covid-19 – an estimated 521,300 people, a welcome reduction from 633,000 the previous week.
Over the same week, an estimated one in 170 people in Wales had Covid-19, while in Northern Ireland it was one in 190, and one in 130 people in Scotland.
These estimates are derived from testing a sample of people. The rates for the sample are used to calculate an estimate for the population as a whole. The benefit of this approach is that the estimate is not biased towards people possibly more likely to have the virus because they are being tested for a specific reason, such as people who have symptoms or who live in areas with high rates. The downsides are that the figures are a best estimate within a range.
For the week commencing 22 November, the estimated number of people with Covid-19 in England could have been as high as 552,600 or as low as 490,600. The data is also not available at neighbourhood level, although estimates are now published at below regional level, for groups of local authority areas.
The ONS estimate of new cases per day in England is shown below, compared to the number of cases reported through the Test and Trace programme. The daily number of cases from Test and Trace partly reflect how many people are tested. In March, very few people were tested and, even though testing capacity increased during the summer, in early October only about two-fifths of the estimated number of people with Covid-19 had undertaken a test. Test and Trace also shows a rapid drop in cases in the second half of November, although this has now levelled off.
What about the positivity rate?
This is the proportion of tests that come back positive. This will reflect both the actual infection rate, and the testing strategy – for example, whether this is focused on people more likely to be infected such as those who are unwell, or who live in areas where rates are higher.
In early April, positivity rates were high: up to a quarter of people who were tested were positive, as only people who had symptoms and needed hospital care were having a test. Over the summer, when infection rates were much lower, and the testing capacity was much greater, the positivity rate for the UK fell to less than 0.5%. The rate increased to over 8% by the end of October, even though the number of people being tested also increased. This indicates that the true infection rate rose – it’s not just that we are testing more people and therefore finding more cases. The positivity rate fell as a result of measures taken to control the virus, but was still 5% at the end of November.
How do the numbers of cases in the second wave compare with the first wave?
This is difficult to answer definitively, because at the start of the pandemic the only source of data was people receiving treatment. During the first wave, we know that fewer cases were being identified compared to the situation now, because testing in the first wave was largely limited to patients with severe symptoms in hospital.
A number of models have been developed that use data on deaths, hospital admissions and activity in the population, such as travel data, to estimate the number of cases in the early stages of the pandemic. The chart below compares data from these models with actual cases and the ONS survey. The estimates of peak number of cases per day in the UK during the first wave range from 99,000 to 178,000 between the models. This is three to six times more than the estimate for the peak of the second wave.
Are cases rising as quickly?
Prior to the first lockdown, it was estimated that the reproduction rate (R-rate) – the number of people infected by each person with Covid-19 – was 2.6-2.8, and that the number of cases was doubling every three days. The R-rate was at or above 1 from early September until late November, with cases doubling approximately every two weeks over much of this time. As of 4 December, the R-rate was estimated to be between 0.8 and 1 across England as a whole. The R is still estimated to be at or above 1 in London, the East of England and the South East.
When were infections and cases at their lowest?
The ONS population survey indicates that infections were at their lowest point between 22 and 26 June, while the lowest number of cases was reported in early July. This difference could reflect the gap in time between people getting infected and experiencing symptoms and being tested. Cases remained low during July and August, but began to increase in early September.
Why did cases fall last time, how fast and when?
It is difficult to be sure when exactly cases started to fall, because of limited testing in the early stages of the pandemic.
Although the number of cases reported was highest on 7 April, hospital admissions peaked slightly earlier on 1 April. This suggests that the number of cases may have peaked at the end of March, given there are typically five days from the onset of symptoms to a patient needing to be admitted to hospital.
On this basis, and taking account of the time for an infected person to pass on an infection to someone else, it is possible that cases had begun to fall before the full lockdown on 23 March. Some measures were introduced on 16 March, including advice to work from home, school closures, and guidance for bars and restaurants to close. The timing of the likely reduction in cases indicates that these measures had some impact, and in addition that some people had pre-empted official advice and started to change their behaviour even earlier as concern about the virus spread.
The peak in cases varied across the country, as did the speed of decline. In particular, cases in London peaked earlier and reduced more quickly than in other UK regions. Travel data indicates that changes in behaviour began earlier in London than in other cities, with the use of public transport dropping even further below normal levels once lockdown started.
What are the patterns in terms of age group and geography?
Differences in the rate of spread of cases across the country are also a feature of the second wave. Whereas in the first wave, London was the first region to be impacted, followed by the West Midlands, rates in the second wave have been higher in the north and midlands.
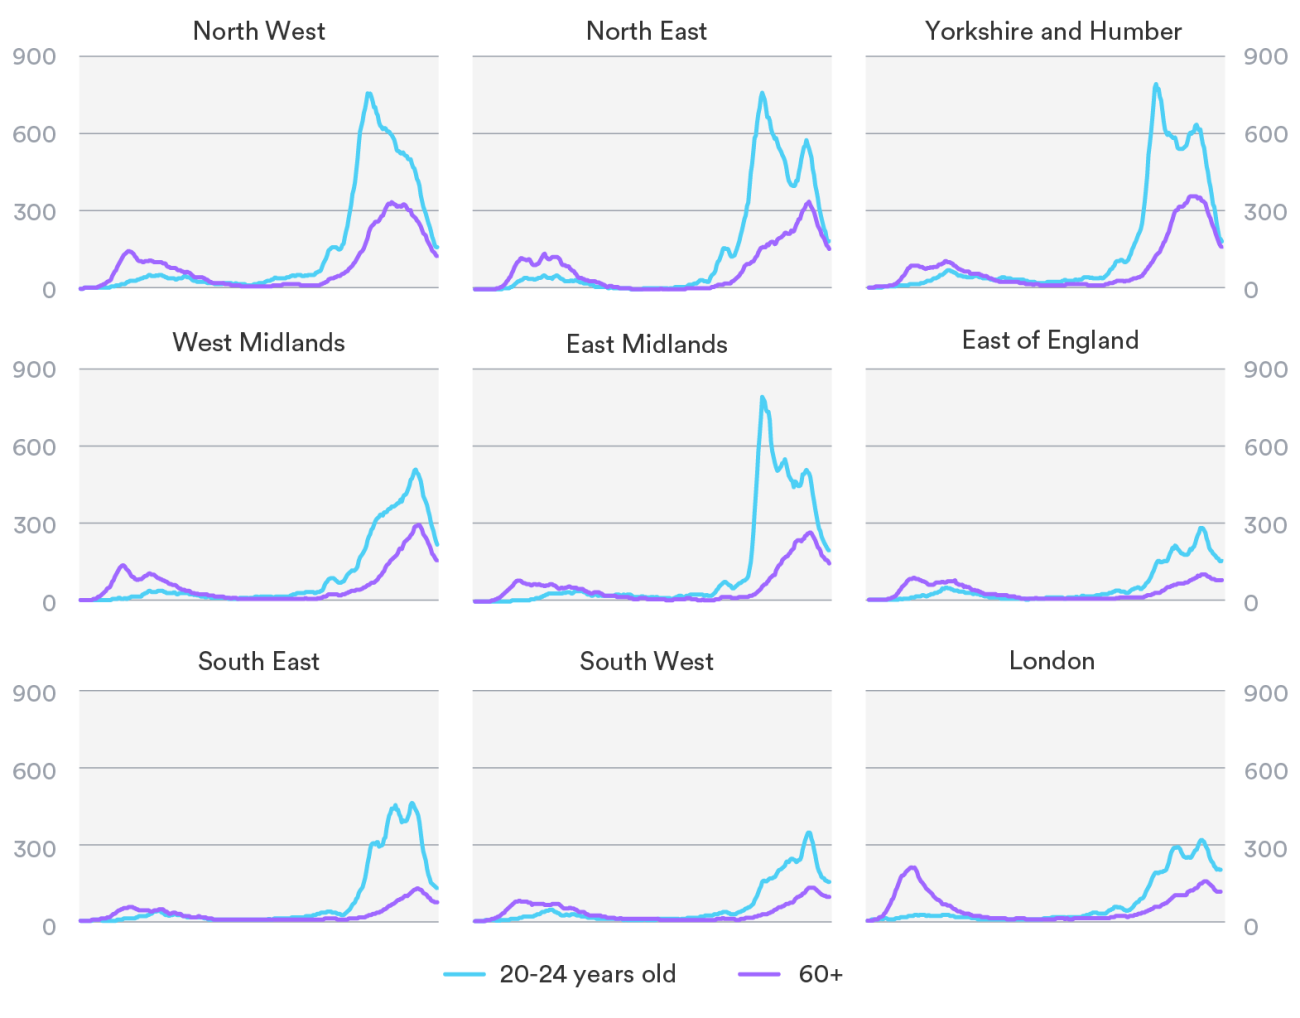
Since the summer, infections have been consistently higher in younger people, with the highest rates found in secondary school children and young adults aged 20-24. During the first wave, a higher proportion of confirmed cases were in older people, because these groups were most likely to be tested. However, results from a large population survey for which people were tested for antibodies indicate that rates were also higher in younger age groups during the first wave.
A rise among younger age groups precedes more cases in older groups, but rates and the number of cases vary regionally. Rates declined in younger age groups from the first half of October in the worst hit regions, but only peaked in people aged 60 and over in the second half of November.
What is the impact on health services this time?
The differences in cases by age are important when considering how the number of cases overall relates to the numbers of people who need health services – either at home, in care homes, or in hospital.
Older people are more likely to become very unwell and die, and so the impact on health services will increase as more older people contract the virus. This means that even as cases reduce overall (because the peak for young adults has passed), demand for health care for Covid-19 patients will grow if older people are making up a higher proportion of cases.
The effect of this can be clearly seen in contacts for the coronavirus in different settings. For example, the numbers of A&E attendances for Covid-19 and the numbers of hospital admissions continued to grow in the North West even when cases declined, because older people make up a higher proportion of people with Covid-19.
How do the numbers of cases relate to national and local lockdowns?
It is difficult to directly compare the number of cases at the time of lockdown, because of the uncertainties about numbers in the first wave. However, the growth rate before lockdown and the peak in the second wave has been lower than in the first wave.
At the same time, the rate of decline during the second lockdown has been lower, and appears to have slowed down as the lockdown has ended. Compliance with lockdown and measures such as mask-wearing and social distancing have remained high, and tests are more widespread. But schools and universities have remained open, and a greater level of outdoor social mixing was possible during the second lockdown. Covid-19 rates were nearly 20 times higher at the end of the second lockdown than at the end of the first.
The longer it takes for Covid-19 cases to fall as a result of lockdown, the greater the number of people who will be infected in the meantime. The R-rate was between 0.7 and 0.9 at the end of the first lockdown on 4 July, but was only just below 1 when the second lockdown ended. At this rate, an estimated 1.7 million will be infected between November and the end of February. Even if rates do continue to fall, this is happening slowly, and from a high starting point.
Following the end of the second national lockdown, a revised tier system has been introduced, because the previous system in England did not have enough impact on rates of growth. In the new system, areas are placed in tiers based on five measures, including rate and growth in cases, and health system capacity. As of 2 December, only 1% of the England population are in the least restricted tier.
Is the NHS full, and will it get overwhelmed?
In the first wave, health services drastically reorganised and curtailed non-Covid-19 services. General practice moved to a phone-first approach, and the 111 out-of-hours services was scaled up to be a first point of contact for coronavirus symptoms. At the same time, hospitals cancelled routine treatments, to free up intensive care capacity for Covid-19 patients, and so staff could be redeployed.
These changes enabled the NHS to support Covid-19 patients, but came at a cost to people already waiting for treatment and for people with pre-existing long-term conditions, and also put additional pressure on social care services.
The NHS sought to resume routine services over the summer, but some hospitals are now cancelling routine operations again, as beds fill up with coronavirus patients. Despite massive advances in treatment for Covid-19 and the rate of increase in cases being slower this time, the impact on patient care for other health issues is likely to be widespread over the winter, as services balance capacity and demand. While the NHS has opened two of the Nightingale units that were set up in April (but largely unused), this does not address the chronic shortages of staff across NHS and social care.
Additionally, the virus is putting pressure on health and social care services across the board. For example, a third more people are dying at home than prior to the pandemic, and more care for Covid-19 is taking place outside of hospitals. Although the impact of Covid is most visible in hospital services, most care takes place elsewhere.
Concluding remarks
Analysis of data from the first wave, alongside the development of new data collections, research programmes and extended testing, are making a big difference to what we know about the second wave.
Weekly survey estimates of numbers of cases are now available, but there is a time-lag in the results, so if rates of cases are growing, survey results will be below the true position.
The second lockdown has been effective in reducing cases, but rates of infection are still high, and reducing more slowly than in the first wave. Even if rates continue to go down under the new tier system, it will take months to reduce the number of cases to the levels seen in July and August. In the meantime, a proportion of cases will result in people becoming seriously ill, being admitted to hospital, and in some cases dying.
The impact on health and care services is critically impacted by not just the total number of cases, but also which age groups are affected. If cases are occurring in older populations, whether in care homes or at home, we can expect this to result in greater demands on services, and ultimately higher mortality rates.
*This Q&A was originally published on 4 November, and has now been updated further to reflect the latest data from up to 4 December.
Suggested citation
Scobie S (2020) “How many cases of Covid-19 are there? A Q&A”, Nuffield Trust comment.