

The new NHS long-term plan is intrinsically linked to the £20 billion funding commitment which gave rise to it. One of the primary questions it must answer is how that money will be used to support its goals and objectives. The design of these financial flows should, at a minimum, avoid creating unnecessary barriers and, ideally, should provide the right incentives and balance of resources to achieve the outcomes of the plan.
The NHS has a long history of experimenting with ways to allocate its funding to support policy goals. Initiatives to distribute funding at a large scale include using needs-based formulae to decide the size of budget that local areas get, and the Payment by Results system for NHS trusts, discussed below, which aims to increase activity and reduce waiting times. More specific financial policies have been designed to incentivise particular improvements or provide funding pots for new reforms, resulting in services like general practice being funded by complex combinations of different funding streams. This essay will look at the successes and failures of these initiatives and what these say about the options now facing the NHS.
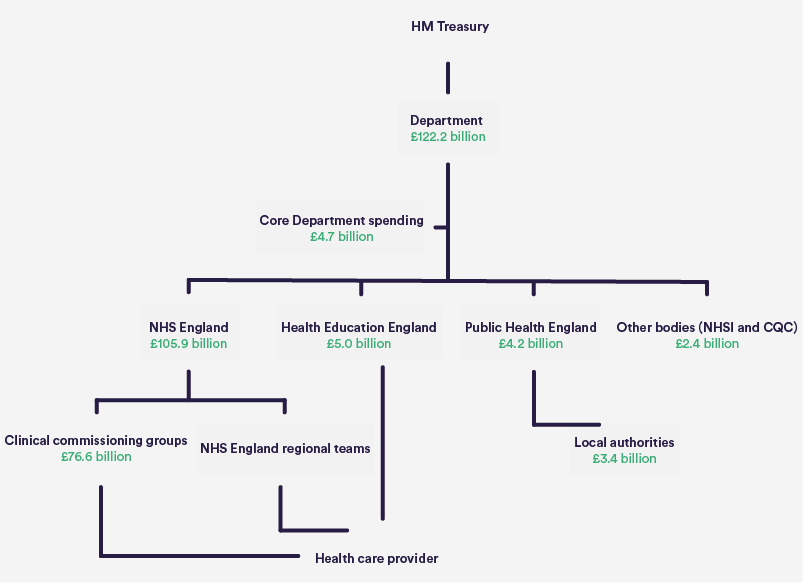
The starting point is the way money is passed from the taxpayer to front-line services today, shown in the chart below. The Secretary of State for Health and Social Care decides how much of the Department’s* total budget (£122.2 billion in 2016/17) should be allocated to the NHS (and under what conditions) and how much to public health. NHS England in turn decides how its budget (£105.9 billion in 2016/17) should be allocated between primary care, general hospital and community services, and specialised services that it directly commissions. The Department and NHS England also decide to further delegate control over spending to commissioners, to those who run services, or to groups of patients themselves through rolling out personal health budgets.
[*Hereafter in this essay, by ‘the Department’ we mean the Department of Health and Social Care and its previous incarnations, the Department of Health and the Department of Health and Social Security.]
Allocate spending in a way that supports your goals, rather than undermining them
Through their roles deciding how funding is distributed, the Department and the NHS can influence the balance of funding between different parts of the system – for example between GPs, hospitals and public health. They can also rebalance funding between different geographical areas.
These are potentially powerful ways to drive and enable changes. However, history suggests funding decisions have been out of kilter with key long-standing policy ambitions.
In the 2006 white paper Our health, our care, our say, Prime Minister Tony Blair and Health Secretary Patricia Hewitt made shifting care out of hospital a particular priority, saying that “increasingly, our primary, community and social care services will need to take the lead” (Department of Health, 2006). However, in the years around and after the white paper the movement of funding was in exactly the opposite direction.
Before the 2013 reforms a local commissioner in each area (primary care trust) would receive a single aggregated allocation and decide, in theory, how to apportion it – although in reality national bodies still took important decisions about the rates at which hospitals and GPs were paid. In the nine years up to 2012/13, the proportion spent on core hospital services increased (from 46% to 48%) and the proportion spent on community and primary care services combined fell (from 36% to 34%).
The commitment to focus increasingly on prevention has also not been reflected in the use of resources. In 2010, the Department committed to protect funding for the public health services whose core role it is to prevent ill health. Allocations to local authorities for public health were increased by a total of over 10% in the two years to 2014/15. However, the Department then cut budgets in-year by £200 million (6.2%) in 2015/16 (Calkin, 2015). In early 2016 the government then announced its intention to further reduce this budget by an average of 3.9% every year in real terms until 2020. The public health allocations remain a small proportion of the overall money allocated through funding formulae.
Remember that money matters for tackling inequalities
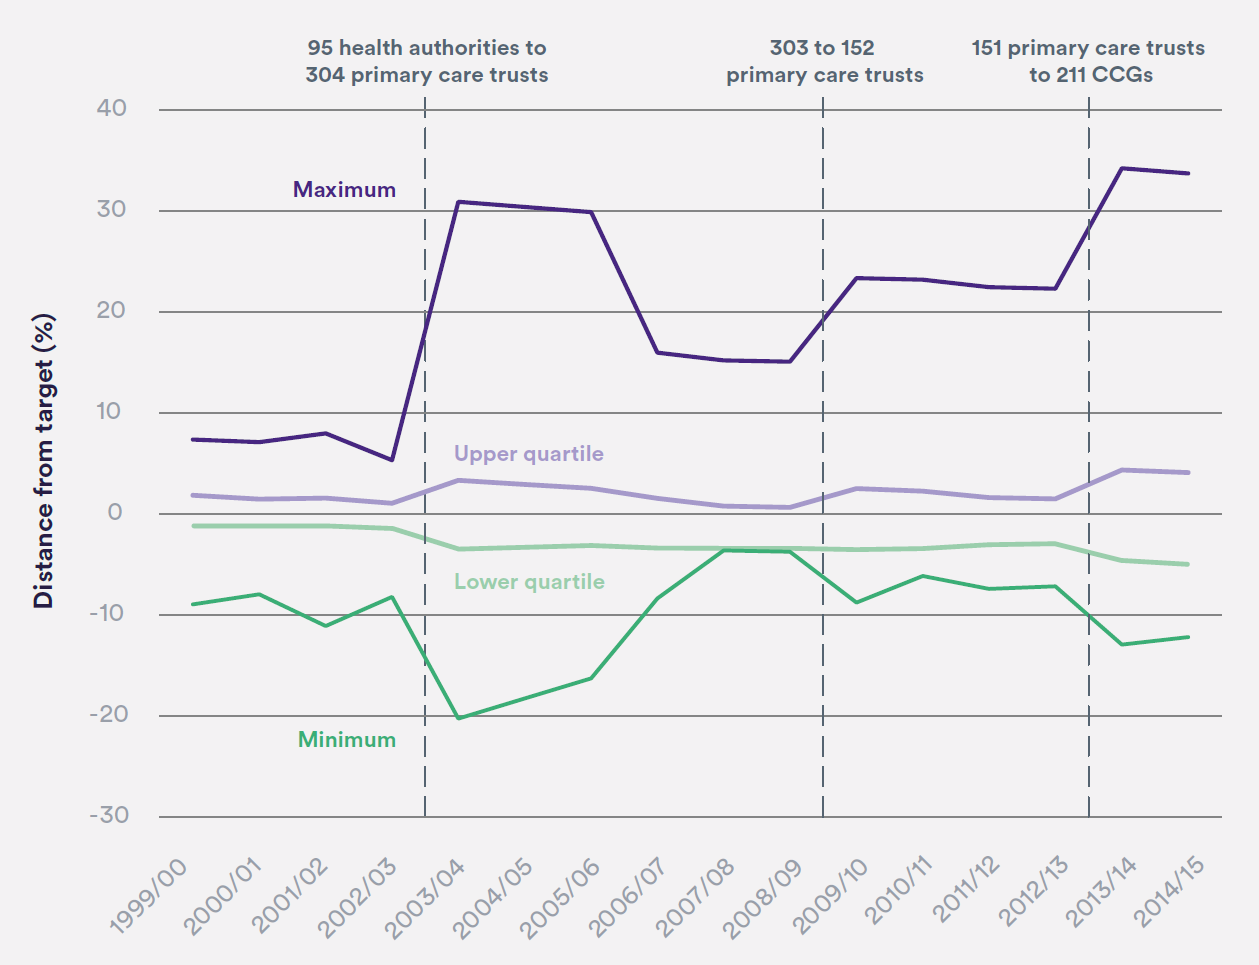
Another long-standing ambition in the NHS, reiterated in many white papers and strategies, is to address inequalities. The powers the Department and NHS England have to allocate funds to different areas provide an apparently powerful lever. Over time, since the late 1970s, the needs-based allocation formulae have developed into some of the most sophisticated ways of distributing public money anywhere in the world.
However, the actual amount local commissioners receive is determined by a compromise between what the formula says and what they received last year, with local areas moving only gradually towards their ‘fair share’. This is done with the intention of avoiding destabilising local services, but the so-called ‘pace of change’ decisions are not based on evidence about, for example, what changes in funding a commissioner can tolerate without being financially destabilised or, in the case of large increases, spending inefficiently.
Over a decade ago the Department made a commitment to ensure that no primary care trust should be more than 3.5% below their target fair share by 2007/08 (Figure 2) (Department of Health, 2005). However, although a like-for-like comparison is impossible due to reorganisation, the level of variation today appears to be higher, with some clinical commissioning groups 5% below their target shares as of 2018/19 (NHS England, 2018a). Data on distances from fair shares for public health allocations are hard to find but, in 2014/15, they ranged from -43% to +530% between local authorities (National Audit Office, 2014).
Research suggests this makes a real impact. A 2006 study found that commissioners who receive higher levels of funding relative to their calculated ‘fair share’ tend to have shorter inpatient and total A&E waits (Jacobs and others, 2006).
Progress in moving money around to increase fairness has also been slow when we look at financial flows more specifically targeted to reduce inequality. For almost two decades health funding formulae have included specific adjustments to move money towards areas with lower life expectancies, with the aim of reducing health inequalities (National Audit Office, 2014). However, looking back, the priority placed on inequalities has changed. The Department allocated 15% of its funding to primary care trusts based on health inequalities in 2009/10 and 2010/11, but today only 10% of funding for core hospital and community services is allocated by NHS England in this way.
Research published in 2014 suggested that such adjustments for inequalities are effective. It found the policy of increasing the proportion of funding allocated to deprived areas was associated with a reduction in absolute health inequalities from causes amenable to health care. Specifically, in the decade to 2011, NHS resources increased by £244 more per person in real terms in the most deprived areas compared with the most affluent. Over this period, the difference in mortality amenable to health care between deprived and affluent areas was shown to have nearly halved from, for example, 95 deaths in males per 100,000 population in 2001 to 54 deaths per 100,000 in 2011. These allocations explained 85% of the total reduction of absolute inequality in mortality amenable to health care. Conversely, there was no statistically significant association between absolute increases in NHS resources and improvements in mortality amenable to health care in more affluent areas (Barr and others, 2014).
Across different areas of care, and in different areas of the country, the history of using large-scale financial flows to deliver change has all too often been one of not actually implementing and maintaining the changes that should be possible. Planners this time should look closely at how to back up their words with financial action.
Financial incentives may have an effect, but not always the one you want
The NHS has also experimented with more specific uses of funding to encourage people to meet strategic goals, by giving out money to reward particular behaviour. Do initiatives like this provide a more direct way to use spending to make plans a reality?
Two of the largest incentive schemes are Payment by Results (PbR) in secondary care and the Quality and Outcomes Framework (QOF) in general practice. These have been in place for well over a decade and account for around one-third of the total budget of the NHS (Appleby and others, 2012).
PbR was introduced in 2003. By paying hospitals based on a set rate for each different procedure, it aimed to incentivise them to do more work more efficiently, and to encourage them to compete on quality, rather than price. An evaluation suggested that it led to reductions in lengths of stay in hospital, and an increase in the proportion of day cases. The authors felt that these changes suggested greater efficiency.
However, the authors also sought to explore the effect on quality of care, which the document introducing PbR set out as a long-term goal of the system (Department of Health, 2002). Using proxy measures based on mortality and readmission rates, they found little measurable change attributable to the policy (Farrar and others, 2009). The evidence on these effects is limited, with that evaluation being the only one identified in a recent systematic review. But that review also concluded more generally that there is mixed evidence on the effect of paying financial incentives to hospitals for providing higher-quality care (Mandavia and others, 2017).
The QOF was introduced in 2004 as part of a wider set of contract reforms for general practice. It gave out extra payments for GPs meeting a wide range of quality standards – for example, for reducing the proportion of teenagers with asthma who smoke, or keeping a register of obese patients.
GP practices were successful in undertaking the activity funded by the framework, which resulted in a spend on the scheme over the first two years of nearly £1.8 billion compared to an allocation of £1.4 billion – an overspend of around a third of a billion pounds.
A study looking at its immediate effect suggested improvements in performance on quality measures against some clinical indicators. But the QOF seemed to have had unintended consequences too, with GPs appearing to game the system to increase their income (Gravelle and others, 2007). The evidence on the effect on outcomes has been mixed, although a number of studies identified a pattern of rapid improvement followed by a plateau in achievement (NHS England, 2018b).
Special financial schemes have continued to be rolled out more recently. For the 2015 Spending Review, the Chancellor promised a £10 billion increase in funding over the course of the parliament with £3.8 billion available for 2016/17. Some of this – £2.1 billion in 2016/17 – was put into a special ‘Sustainability and Transformation Fund’.
The Fund is provided directly to trusts, with decisions on the funding largely taken by NHS Improvement, who oversee them. The original intention was for it to have a dual purpose of stabilising finances and transforming services – including work to integrate local services.
Yet the Fund has largely been used to reduce providers’ deficits, by giving out funding only if they keep overspending to a minimum. Undoubtedly, trusts appear to have responded to this incentive. But the design of the system may have further increased the gap between the financially stable and the financially struggling. Over a fifth of the Fund was withheld from 114 trusts for not accepting or meeting their financial or performance targets. A significant proportion of the Fund was allocated to trusts already in surplus (Gainsbury, 2017).
The prioritisation of achieving financial balance was also apparently at the expense of longer-term sustainability. The cost of maintenance work left undone despite creating high or significant risks almost doubled in the four years to 2016/17 (to £2.7 billion).
Meanwhile, the amount of the Fund taken up by controlling deficits meant little was left for transformation. Only £1 in £7 was committed to this transformation agenda in 2016/17, despite this being one of the dual purposes of the Fund. The National Audit Office warned that trusts became more reliant on one-off savings over this period. Despite improving access being an objective of the Fund, performance against key standards fell in 2016/17 (National Audit Office, 2018).
Across all these ambitious schemes, one clear lesson is that the NHS will often respond to financial incentives. But it often does not respond as much as policymakers hoped, or in the direction they intended. As they consider responses to the recently published consultation on amendments to the national tariff, NHS Improvement and NHS England may reflect that aligning incentives to policy goals rarely goes entirely to plan, and the track record of using them to achieve multiple goals at once is poor. In particular, history suggests a degree of pessimism about using financial levers to achieve complicated, longer-term aims like increases in the standard of care.
Suggested citation
Palmer W and Appleby J (2018) "Lesson 4: Make sure the funding follows the plan", Nuffield Trust comment. https://www.nuffieldtrust.org.uk/news-item/lesson-4-make-sure-the-funding-follows-the-plan
Doomed to repeat? Lessons from the history of NHS reform
Comment series