Waiting lists in England topped over six million in December. Despite changes over the years in the way that waiting lists are recorded, this is the largest number since 1948. But how and why has the way that we count who is waiting changed?
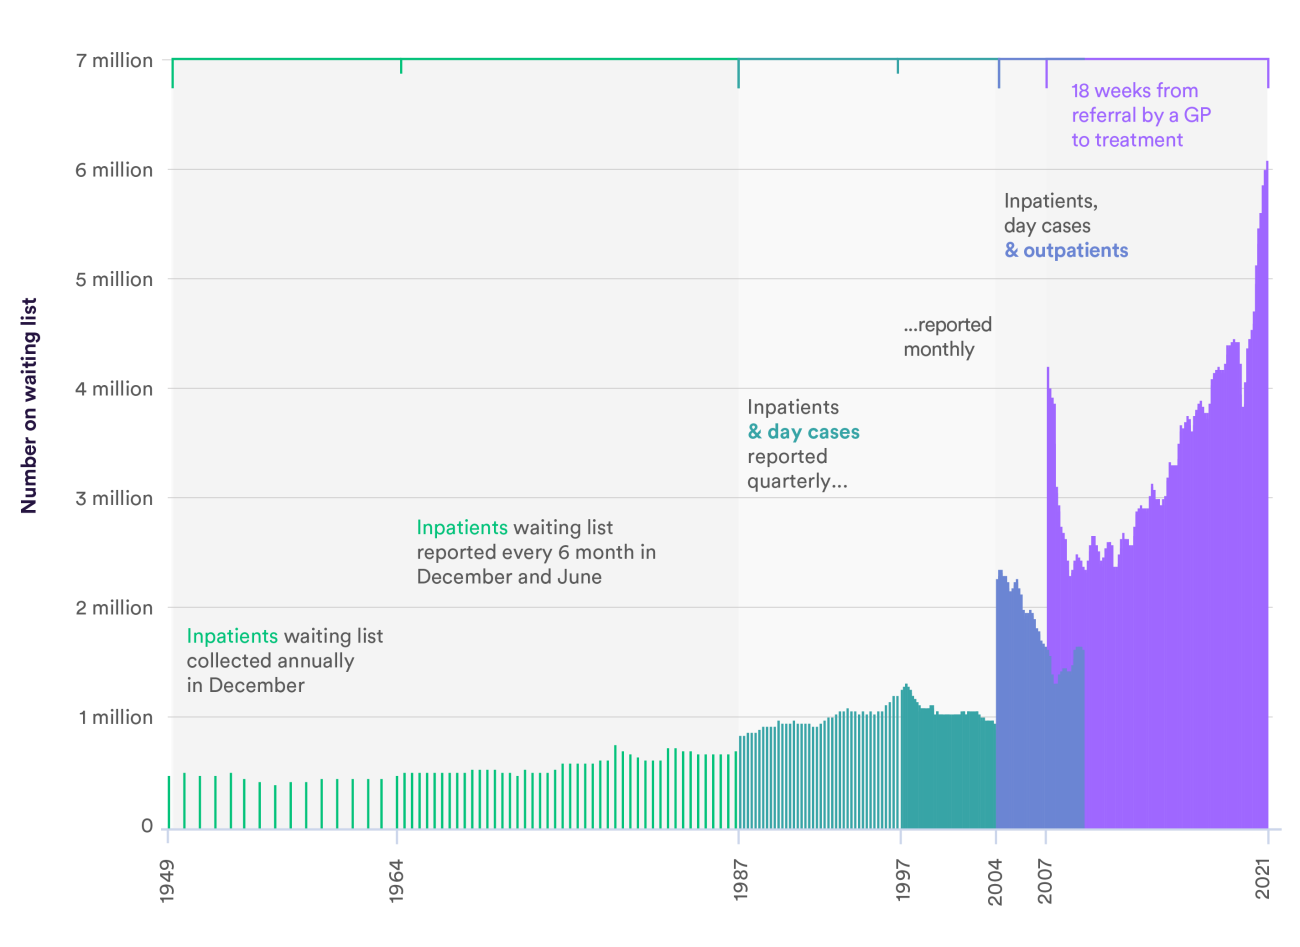
When the NHS opened its doors for business in 1948, it inherited a waiting list of around 460,000 ‘ordinary’ patients (inpatients) from hospitals that joined the service. Data was recorded annually in December, and for the next 16 years that was all we knew about the NHS waiting list nationally. Then for the next two decades, up to 1987, waiting lists for inpatients were reported every six months.
From 1987 to 1997, and as new interventions enabled more people to be treated without an overnight stay in hospital, people waiting for day case treatment were added to the list. But this clearly only captured part of patients’ waiting experiences, and in 2004 people waiting for an outpatient appointment were also included. This was also part of the evolution of the then Labour government’s plans at the time to make significant reductions not just in the numbers waiting list, but also in how long people had to wait.
As success in reducing long waits in the early part of this century continued, the Labour government raised the stakes by announcing a new, more comprehensive target in 2005 that no more than 10% of patients should wait longer than 18 weeks from referral by a GP to treatment in hospital. This meant another change in waiting list data in 2007 to better capture what would now become a more overarching measure of the complete waiting list/time experience.
Within two years – by 2009 – the total waiting list had nearly halved to 2.3 million, and the 18-week target continued to be met up until 2017. But from around 2012 the waiting list started to rise, nearly doubling to 4.34 million by February 2020.
In the last two years, the huge disruption to health care as a result of Covid-19 has left the NHS with a much bigger waiting list, along with an unknown number of people who have still to come forward for treatment missed during the pandemic. The NHS has set an ambitious target for recovery. History suggests this will take years, rather than months, to address.