
NHS hospitals and other services ended the financial year 2016/17 with an underlying deficit of £3.7 billion. That is to say: they had £3.7 billion less reliable cash coming in than they had going out.
How did that happen?
The answer is surprisingly simple: hospitals are paid for each patient they treat, and the price they receive is set by a national tariff listing thousands of common procedures or types of care. But the prices on this list have been cut in real terms every year since 2009/10, and most years in cash terms too.
This means that a hospital will be given just £937 in cash this year to treat a patient they would have received £1,000 in cash to care for in 2009/10 – the green line on our graph. Factor in eight years of inflation, and that £937 is more like £760 (the blue line).
How much is a hospital paid to treat a patient they were paid £1,000 to care for in 2009-10?
Chart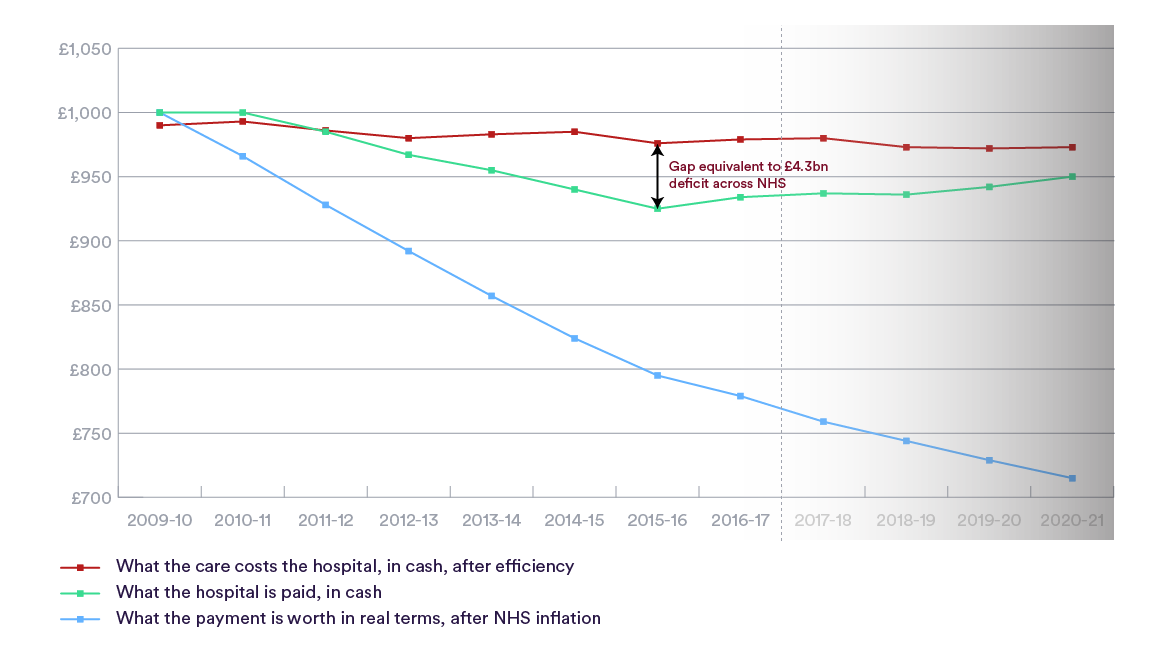
Why did this happen?
The cuts in the amount that NHS organisations are paid per patient were made in the hope that they would respond by cutting their own costs through efficiencies. They did. But hospital cost cutting could not keep up with the scale and the speed of the cuts to their payments.
Between 2010 and 2016, tariff prices were cut by 4 per cent in real terms, year after year. NHS organisations tried to keep up, but only managed to cut their own costs by around 2.6 per cent a year.
The red line on our chart takes into account these efficiency savings and shows how much, in cash terms, it actually costs a hospital to care for that same patient they would have earnt £1,000 to treat in 2009/10. Keen eyes will notice this line starts slightly below £1,000, as hospitals in 2009/10 were on average making a small surplus (or profit) on each patient they treated, meaning they had cash left over to invest in new services or make quality improvements.
Across the decade, this “actual cost” line is more or less flat, with a slight downward slope – showing that efficiencies made by hospitals and other NHS services enabled them to absorb the impact of inflation on drug prices, clinical supplies, fuel and staff pay each year and then slightly reduce their cash costs too.
Without those efficiencies, a patient costing £990 to treat in 2009/10 would cost a hospital £1,220 today. Instead it will cost them in the region of £980 (a saving of around £21 billion when scaled up across the NHS).
If the NHS has made such huge efficiency savings, how come it is in such trouble?
The problem for NHS organisations, however, is shown by that green line – tracking what they were paid, in cash terms, to care for the patient they would have received £1,000 for in 2009/10.
The lowest point on that green line is 2015/16: the year NHS organisations had an underlying overspend of £4.3 billion. The Government responded to that crisis by increasing tariff prices in cash terms for the first time since 2009/10 – but not by enough to cover inflation, which is why the blue line at the bottom, showing the real terms value of those payments, continued to slope down year after year, albeit more gently.
The cash increase to tariff prices (1 per cent in 2016/17 and 0.3 per cent in 2017/18) will help NHS organisations very slowly narrow the gap between their costs (the red line) and their payments (in green), but only if they can continue to make year-on-year efficiency savings to first absorb the impact of inflation and then cut their costs in cash terms some more.
The shaded part of our chart uses official forecasts for NHS inflation and tariff prices until 2020/21 to predict what will happen to that costs-versus-payment gap. It shows the gap narrowing from over 5.5 per cent in 2015/16 to around 2.4 per cent in 2020/21 – the equivalent to a deficit of £2 billion that year. However, even that is dependent on inflation being held down to the levels forecast several years ago, and there have been recent signs this may not be the case.
*For more information on the NHS provider deficit, see our recent briefing The bottom line: Understanding the NHS deficit and why it won’t go away.
Suggested citation
Gainsbury, S. (2017) "When the price isn't right: how cuts in hospital payments added up to the NHS deficit" Nuffield Trust comment www.nuffieldtrust.org.uk/news-item/when-the-price-isn-t-right-how-cuts-in-hospital-payments-added-up-to-the-nhs-deficit