
The Accountable Care Organisations (ACOs) being developed across the United States are influential precursors of current policy initiatives in England, including the New Models of Care Programmes driven by NHS England. ACOs are designed to bring together providers of mental, physical, hospital and community services to provide joined-up care for a population. The hope is that this will create the capacity and incentives to focus on keeping people well in less expensive non-hospital settings. But like most new models, the impact of ACOs on quality or cost savings is still unclear. In a guest blog, Dr Ashish Jha, Director of Harvard Global Health, looks at new figures that offer important insights into whether the experiment is working.
Last week, the Centers for Medicare and Medicaid Services tweeted a statement touting over $1 billion in savings from Accountable Care Organizations (ACOs).
The link in the tweet is to a press release. The link in the press release citing more details takes you to another press release. There’s little in the way of analysis or data about how ACOs did in 2015. So I decided to do a quick examination of how ACOs are doing and share the results...
Some background on ACOs
Simply put, an ACO is a group of providers that is responsible for the costs of caring for a population while hitting some basic quality metrics. This model is meant to save money by better coordinating care. As I’ve written before, I’m a pretty big fan of the idea – I think it sets up the right incentives and if an organisation does a good job, they should be able to save money for Medicare and get some of those savings back themselves.
ACOs come in two main flavours: Pioneers and Medicare Shared Savings Programs (MSSP). Pioneers were a small group of relatively large organisations that embarked on the ACO pathway early (as the name implies). The Pioneer programme started with 32 organisations and only 12 remained in 2015. It remains a relatively small part of the ACO effort and, for the purposes of this discussion, I won’t focus on it further.
The other flavour is MSSP. As of 2016, this programme has more than 400 organisations participating and, as opposed to Pioneers, has been growing in leaps and bounds. It’s the dominant ACO programme – and it too comes in many sub-flavours, some of which I will touch on briefly below.
So last week, when CMS announced having saved more than $1 billion from MSSPs, it appeared to be a big deal. After struggling to find the underlying data, Aneesh Chopra (former Chief Technology Officer for the US government) tweeted the link to me.
You can download the Excel file and analyse the data on your own. I did some very simple stuff. It’s largely consistent with the CMS press release, but as you might imagine, the press release cherry-picked the findings – not a big surprise given that it’s CMS’s goal to paint the best possible picture of how ACOs are doing.
I downloaded the dataset from the CMS website and ran some pretty basic frequencies on data for the 392 ACOs for whom CMS reported results.
While there are dozens of interesting questions about the latest ACO results, here I examine five that I thought were worth answering now.
How much did the winners save – and how much did the losers lose?
Table 1
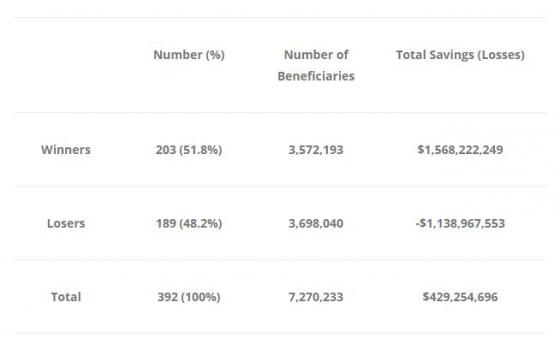
I define winners as those organisations that spent less than their benchmark. Losers were organisations that spent more than their benchmarks.
The take away message? About half the organisations lost money and about half made money. If you are a pessimist, you’d say, 'this is what we’d expect; by random chance alone, if the ACOs did nothing, you’d expect half to make money and half to lose money'. However, if you are an optimist, you might argue that 51.8 per cent is more than 48.2 per cent and it looks like the tilt is towards more organisations saving money and the winners saved more money than the losers lost.
Next, we go to benchmarks (or targets) versus actual performance. It is worth remembering that benchmarks were set based on historical spending patterns – though CMS will now include regional spending as part of their formula in the future.
Did the winners spend less than the losers, or did they just have higher benchmarks to compare themselves against?
Table 2
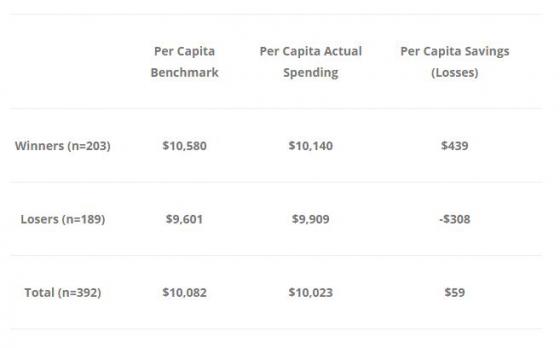
A few thoughts on Table 2. Firstly, the winners actually spent more money, per capita, than the losers. They also had much higher benchmarks – maybe because they had sicker patients – or maybe because they’ve historically been high spenders. Either way, it appears that the benchmark matters a lot when it comes to saving money or losing money.
Given that we have to give out bonus payments to those that saved money, how did CMS (and by extension, American taxpayers) do? Let's tackle the question from the perspective of the US taxpayer.
Did CMS come out ahead or behind? Well, that should be an easy question: the programme seemed to net savings. However, remember that CMS had to share some of those savings back with the provider organisations. And because almost every organisation is in a one-sided risk-sharing programme (i.e. they don’t share losses, just the gains), CMS pays out when organisations save money – but doesn’t get money back when organisations lose money. So to be fair, from the taxpayer perspective, we have to look at the cost of the programme including the checks CMS wrote to ACOs to figure out what happened. Here’s that table:
Table 3 (numbers are rounded)
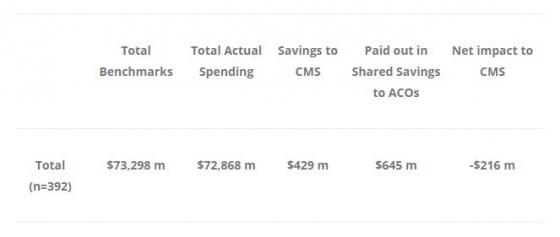
According to this calculation, CMS actually lost $216 million in 2015. This, of course, doesn’t take into account the cost of running the programme. Because most of the MSSP participants are in a one-sided track, CMS has to pay back some of the savings – but never shares in the losses it suffers when ACOs over-spend. This is a bad deal for CMS – and as long as programmes stay one-sided, barring dramatic improvements in how much ACOs save — CMS will continue to lose money.
Finally, we look at whether savings have varied by year of enrollment.
Are ACOs that have been in the programme longer doing better?
Table 4
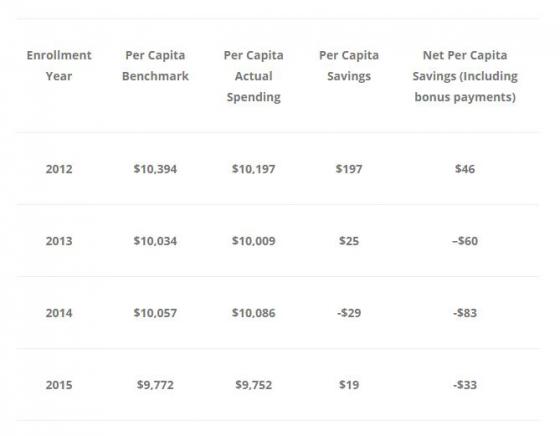
These results are straightforward: almost all the savings are coming from the 2012 cohort. A few things are worth pointing out. Firstly, the actual spending of the 2012 cohort is also the highest – they just had the highest benchmarks. The 2013-2015 cohorts look about the same. So if you are pessimistic about ACOs – you’d say that the 2012 cohort was a self-selected group of high-spending providers who got in early and because of their high benchmarks, are enjoying the savings. Their results are not generalisable. However, if you are optimistic about ACOs, you’d see these results differently – you might argue that it takes about three to four years to really retool healthcare services – which is why only the 2012 ACOs have done well. Perhaps if you give the later cohorts more time, we will see real gains.
Final thoughts
This is decidedly mixed news for the ACO programme. I’ve been hopeful that ACOs had the right set of incentives and enough flexibility to really begin to move the needle on costs. It is now four years into the programme and the results have not been a home run. For those of us who are fans of ACOs, there are three things that should sustain our hope.
Firstly, overall, the ACOs seem to be coming in under target, albeit just slightly (about 0.6 per cent below target in 2015) and generating savings (as long as you don’t count what CMS pays back to ACOs).
Secondly, the longer-standing ACOs are doing better and maybe that portends good things for the future – or maybe it’s just a self-selected group that with experience that isn’t generalisable.
Finally (and this is the most important issue of all), we have to continue to move towards getting all these organisations into a two-sided model where CMS can recoup some of the losses. Right now, we have a classic 'heads – ACO wins, tails – CMS loses' situation and it simply isn’t financially sustainable. Senior policymakers need to continue to push ACOs into a two-sided model, where they can share in savings but also have to pay back losses. Barring that, there is little reason to think that ACOs will bend the cost curve in a meaningful way.
A version of this blog first appeared on Professor Jha's blog 'An Ounce of Evidence'.
Please note that all views expressed in guest blogs on the Nuffield Trust website are the authors' own.
Suggested citation
Jha A (2016) ‘Accountable Care Organisations: The winners and losers’. Nuffield Trust comment, 7 September 2016. https://www.nuffieldtrust.org.uk/news-item/accountable-care-organisations-the-winners-and-losers