Today, NHS England published its Combined Performance Summary, which provides data on key performance measures for April and May of this year. Here we show some of these statistics and how they compare with previous years.
For interactive charts showing the quality of health and social care over time, please refer to our 300+ indicators.
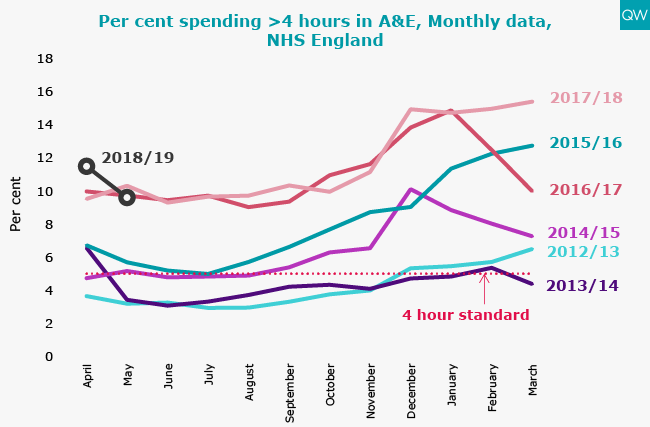
- In May 2018, 9.6% of people attending A&E spent more than 4 hours from arrival to admission, transfer or discharge. This is 0.7% lower than for the same month last year but over 2 ½ times higher than it was five years ago.
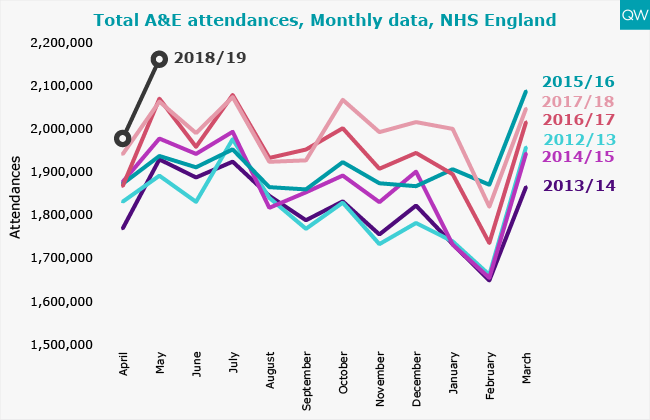
- Total A&E attendances reached a record 2.16 million in May 2018, and there were almost 100,000 more attendances than in May 2017.
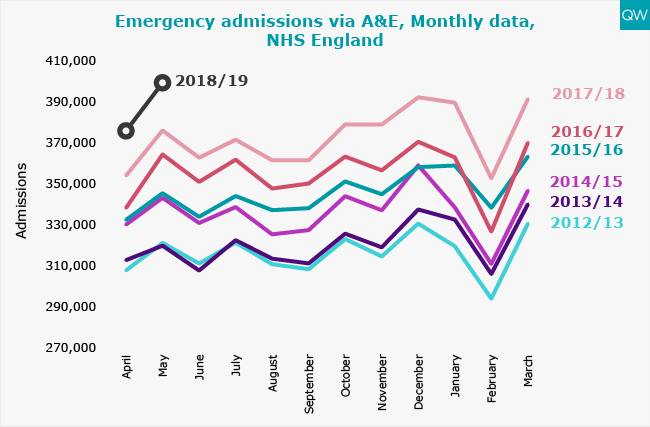
- Emergency admissions via A&E have been increasing year-on-year, almost reaching 400,000 in May 2018.
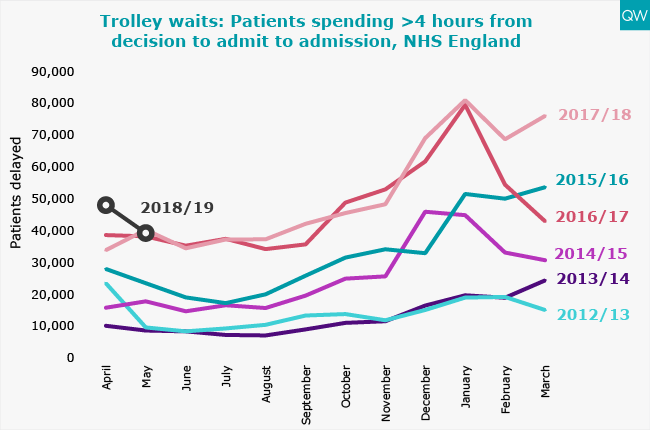
- 39,238 patients spent more than 4 hours waiting on a trolley from decisionto admit to admission in May 2018. This is 3% lower than the same month last year, but more than four times higher than it was five years ago.
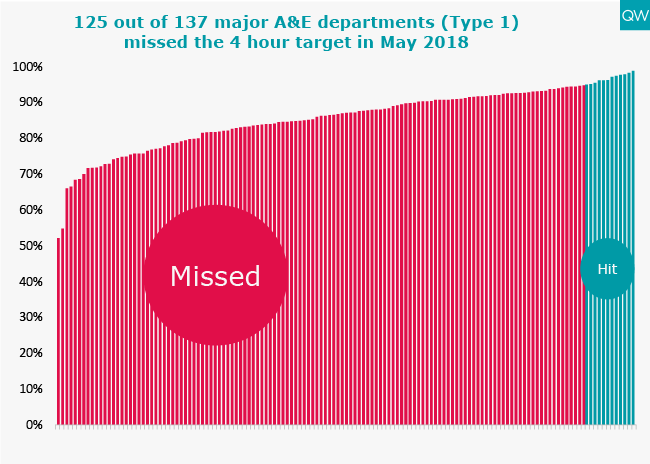
- Only 12 out of 137 major A&E departments (Type 1) met the four-hour A&E waiting time target in May 2018.
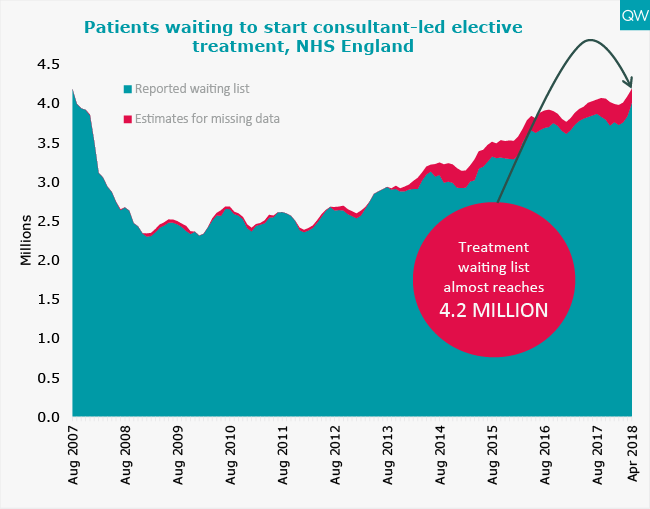
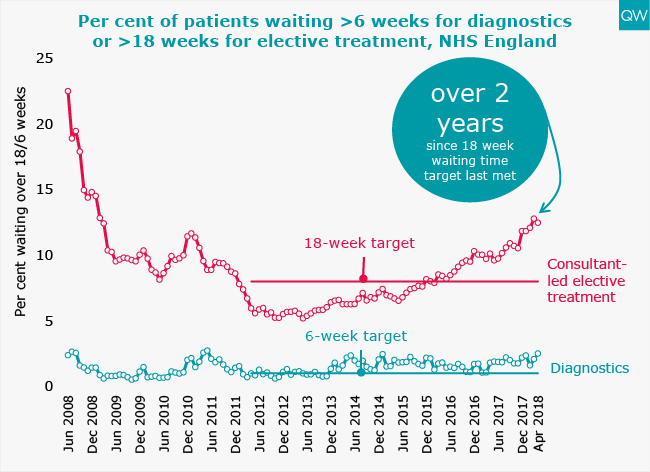
- The total number of people waiting to start consultant-led elective treatment almost reached 4.2 million in April 2018. This is the highest ever reported since referral-to-treatment data was first collected in August 2007.
- The proportion of people waiting over 18 weeks to start elective treatment reached 12.5% in April 2018. The 18-week referral-to-treatment target has not been met since February 2016.
- In April 2018, 2.5% of patients had been waiting over 6 weeks for a diagnostic test. This is the worst level of performance since May 2011.
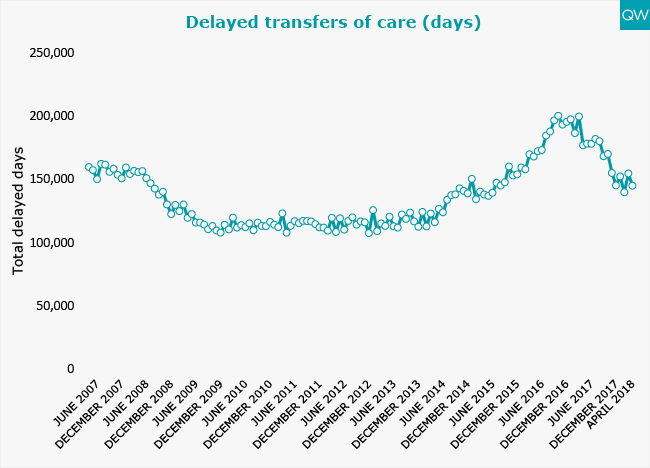
- The total number of delayed transfer of care days was 144,997 in April 2018, which is 18% lower than in April 2017.
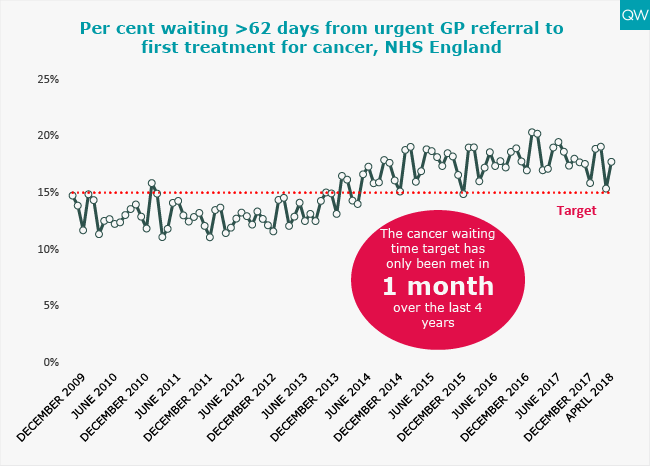
- Performance against the cancer waiting time target worsened, with 17.7% of patients waiting over 62 days from an urgent GP referral to their first treatment for cancer in April 2018. The 62-day cancer target has only been met in one month over the last four years.
NHS Waiting List
Elective and diagnostic waiting times
Delayed transfers of care