Today, NHS England published its Combined Performance Summary, which provides data on key performance measures for April and May of this year. Here we show some of these statistics and how they compare with previous years.
In March, the Clinically-Led Review of NHS Access Standards Interim Report was released, which proposed some significant changes to many of the targets reported on here.
For urgent and emergency care the review recommended the testing of four access standards to understand their impact on clinical care, patient experience and the management of services, when compared to the single access standard of four hours. Fourteen hospital trusts (covering 26 sites providing A&E services) agreed to test these standards, starting on the 22nd May. The monthly returns from field test trusts omits four-hour performance data for May and the national picture for A&E performance for May omits these sites’ performance. Data presented in our analysis of performance against the four hour access standard represents the national time series data published that excludes the field testing sites and so is comparable across months and years.
For interactive charts showing the quality of health and social care over time, please refer to our 200+ indicators.
A&E
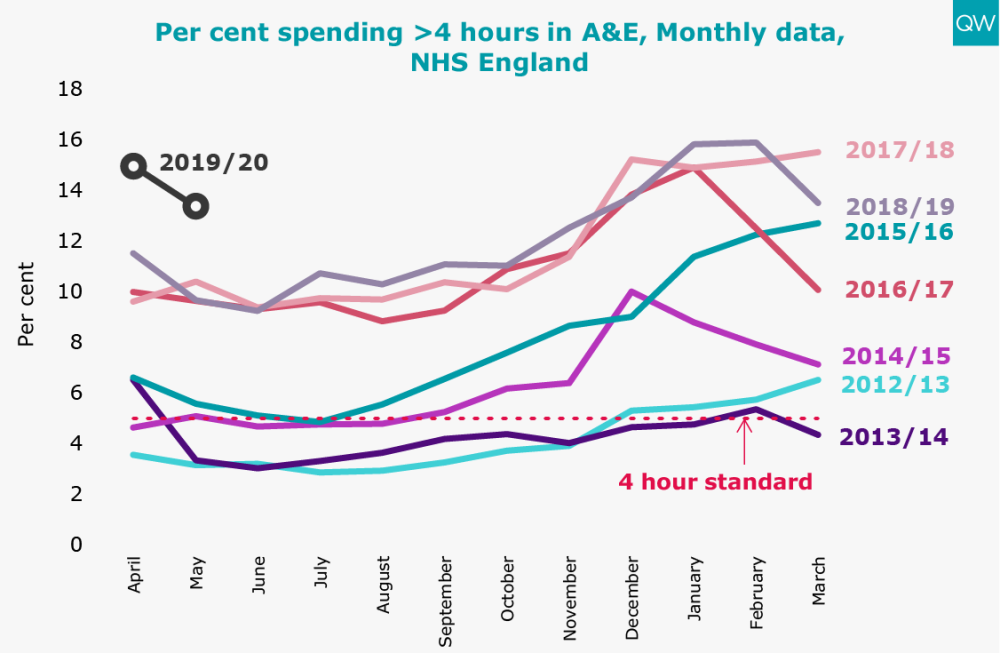
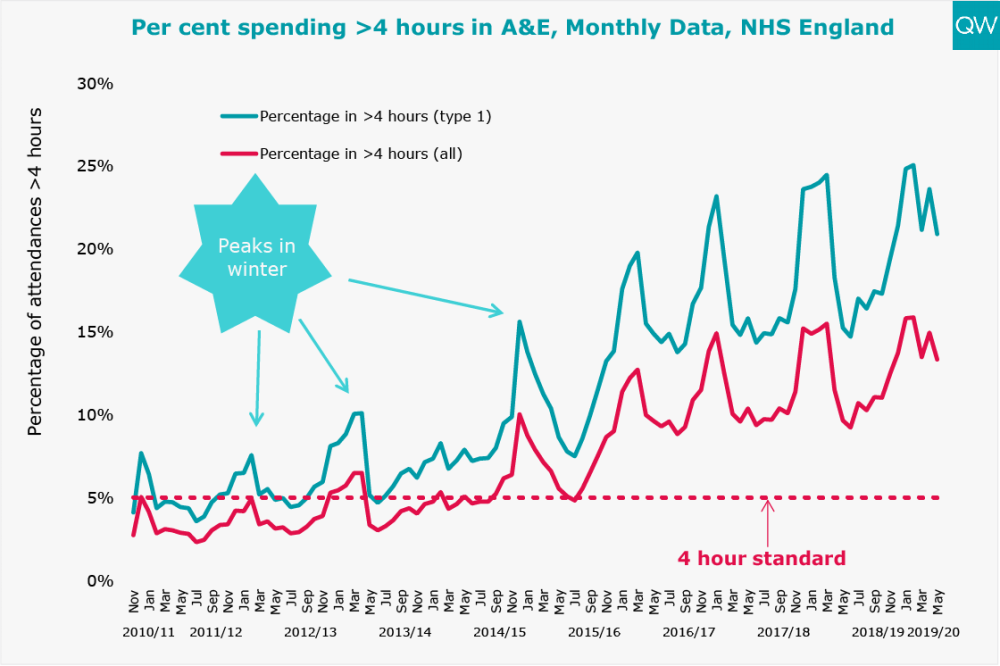
- In May 2019, 13.4% of people attending any A&E spent more than four hours from arrival to admission, transfer or discharge – the worst performance for any May on record. There was a 1.6 percentage point decrease on the previous month but it was 3.7 percentage points higher than in May the previous year.
- For major (Type 1) A&E more than one in five people (20.9%) waited more than four hours in May 2019, which despite being 2.7% percentage points lower than the previous month is 5.7 percentage points higher than in May the previous year.
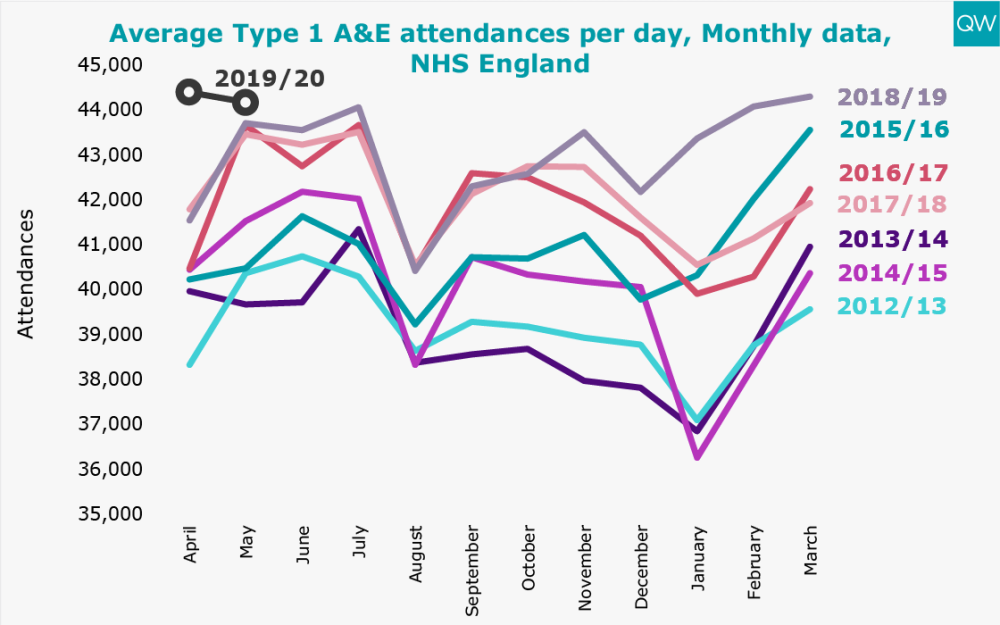
- The decline in Type 1 performance on the previous year coincides with a 1% increase in the average number of attendances per day in May 2019 compared to May last year. Nationally this equates to an increase of 471 more attendances per day on average. In May 2019, there was a total of 1.37 million Type 1 A&E attendances, equating to an average of 44,200 attendances per day.
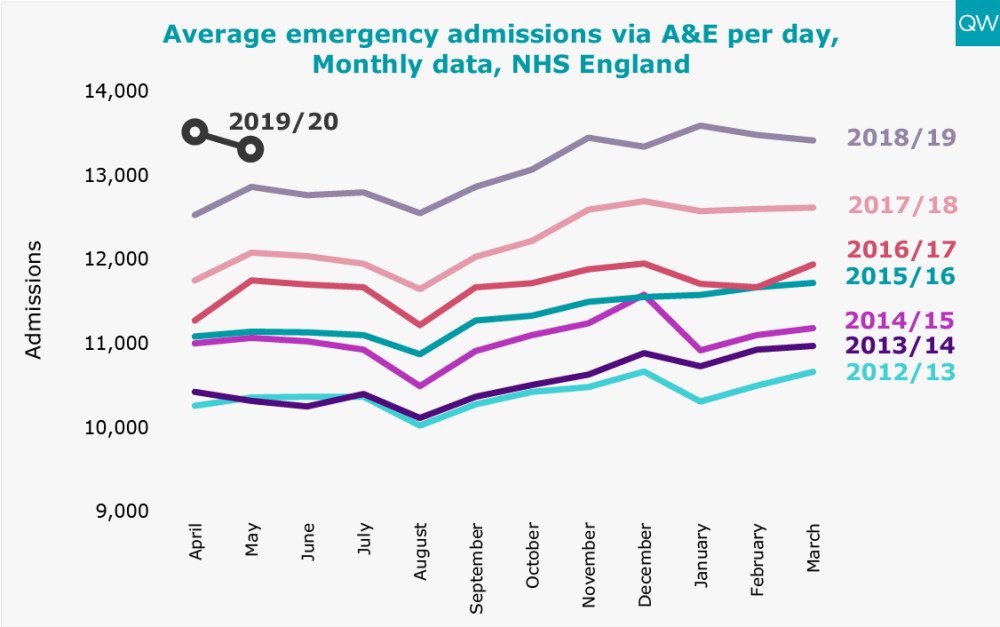
- Emergency admissions via A&E have been increasing year-on-year, reaching over 412,000 in May 2019. The average number of emergency admissions via A&E per day reached 13,310, which is 3.5% higher than the same month last year. This increase may be related to the rise in same-day emergency care, where patients are treated and discharged on the same day as admission.
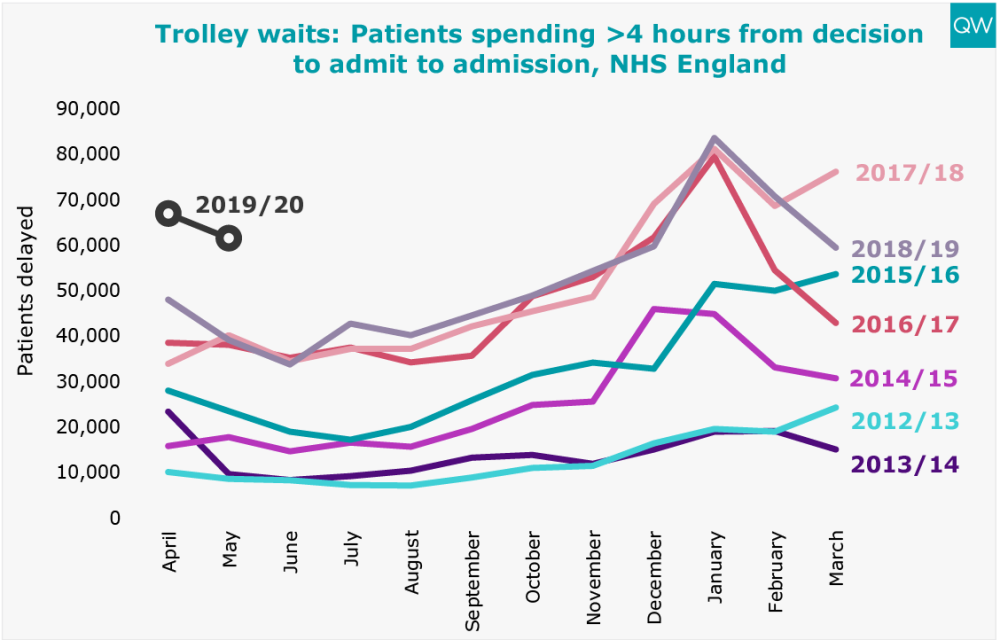
- 61,500 patients spent more than 4 hours waiting on a trolley from decision to admit to admission in May 2019. While this is an 8% decrease on the previous month it is more than a 56% increase compared to May of the previous year.
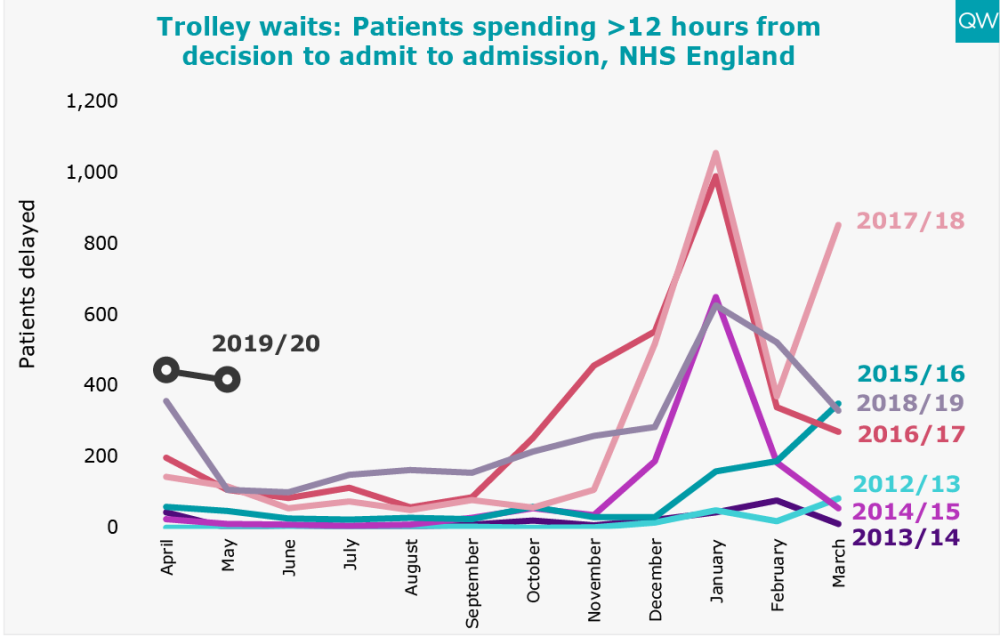
- In May 2019, 415 patients had a trolley wait of over 12 hours, which is nearly four times as many as the same month last year.
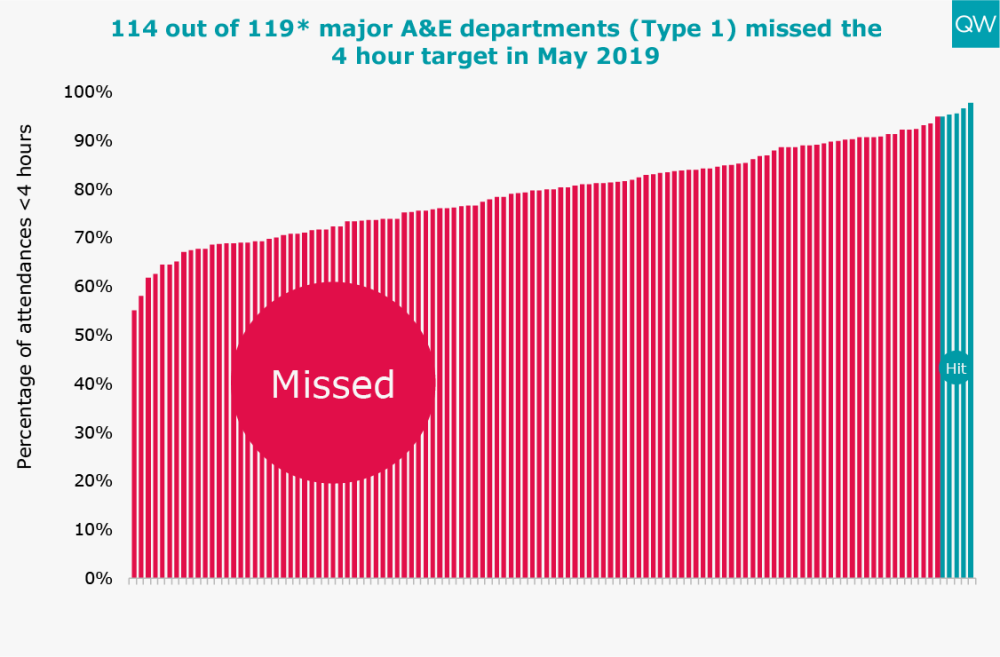
- Only five out of 119 major A&E departments submitting the four hour access standard data met the four-hour A&E waiting time target in April 2019.
Treatment and diagnostic test waiting times
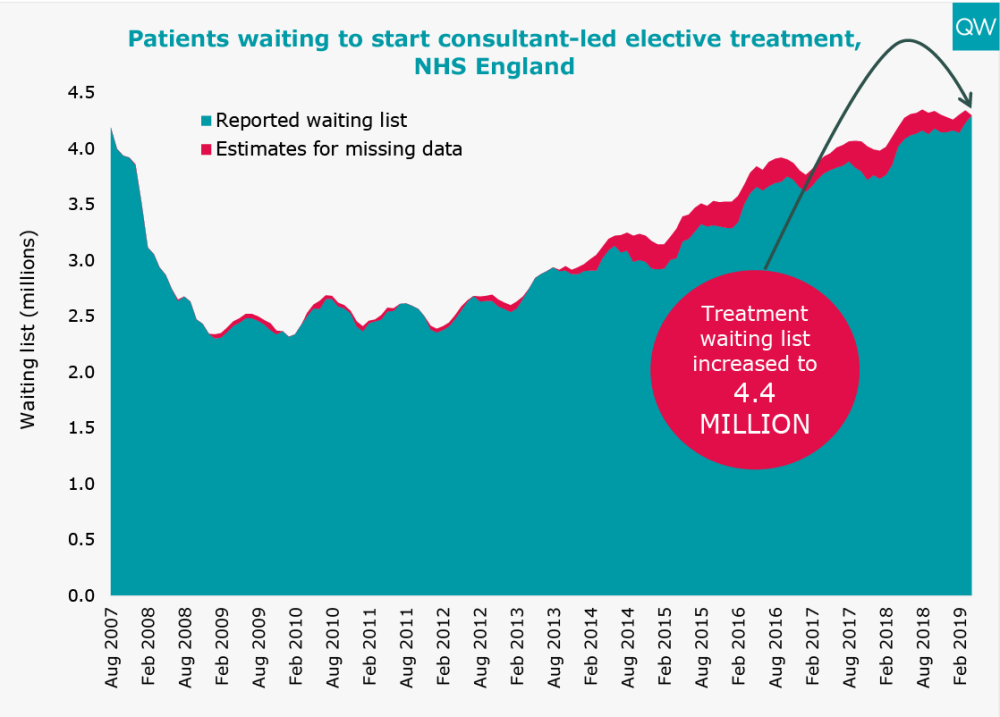
- The total number of people waiting to start consultant-led elective treatment increased to 4.4 million in April 2019.
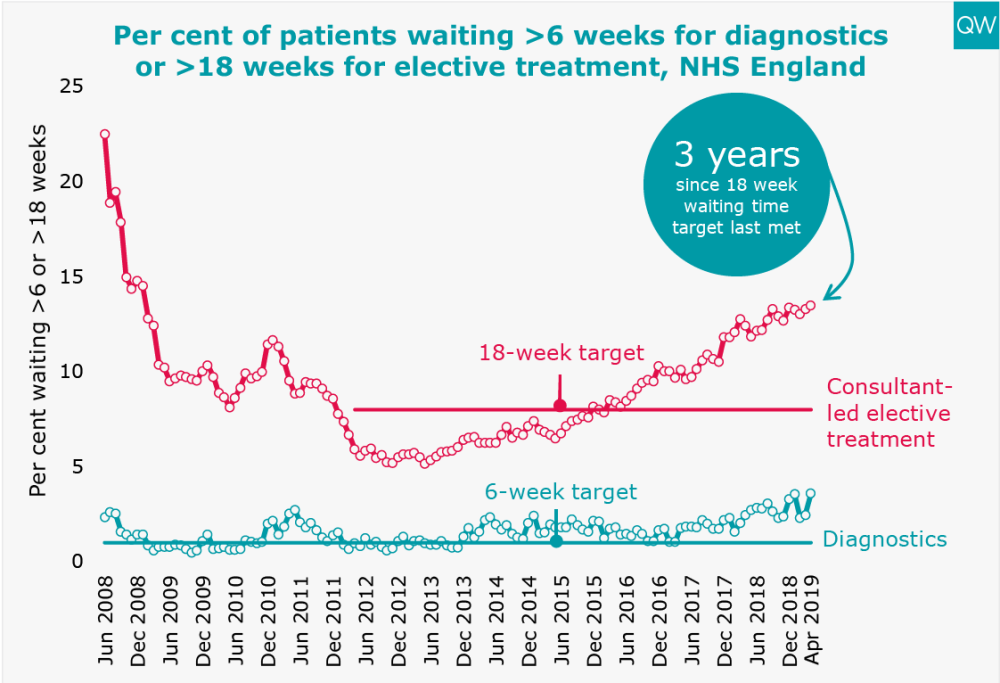
- The proportion of people waiting over 18 weeks to start elective treatment reached 13.5% in April 2019. It has been over three years since the referral-to-treatment target was last met.
- In April 2019, 3.6% of diagnostic tests took longer than 6 weeks before they were provided, which is the highest proportion since the six week diagnostic wait was initially introduced as a 'milestone' in March 2008. This comes as the level of diagnostic activity has nearly doubled in the same time period.
- This increase is also observed when comparing to the previous month and the same month in the previous year, where in both cases it is 1 percentage point higher
Delayed transfers of care
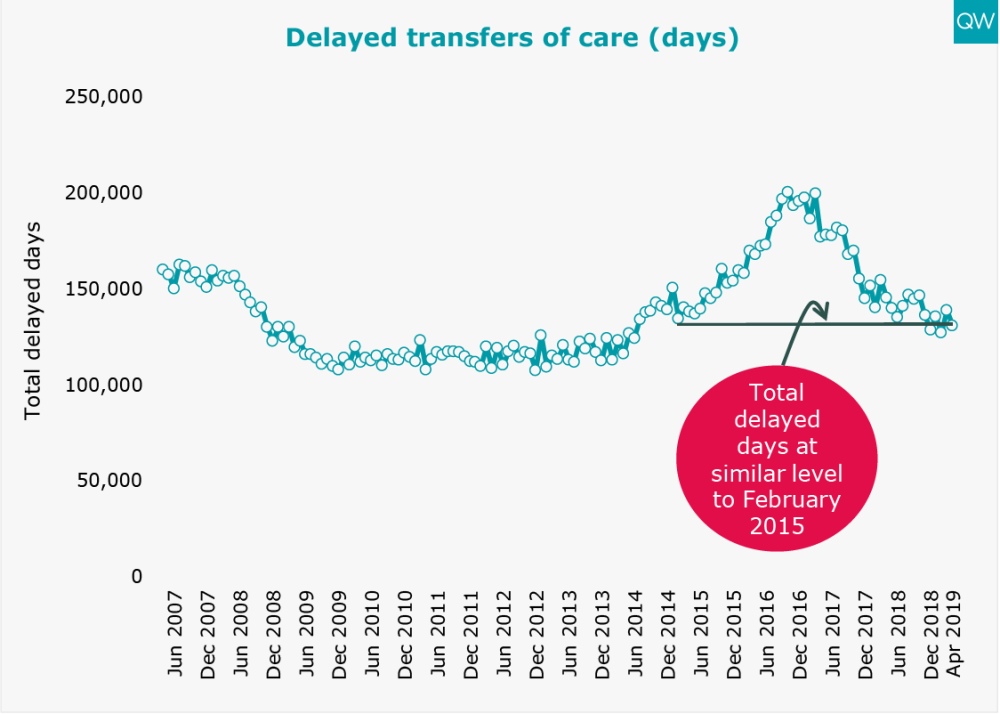
- The total number of delayed transfer of care days decreased by 6% to 130,842 in April 2019 compared to the previous month, which is almost the same as it was in February 2015.
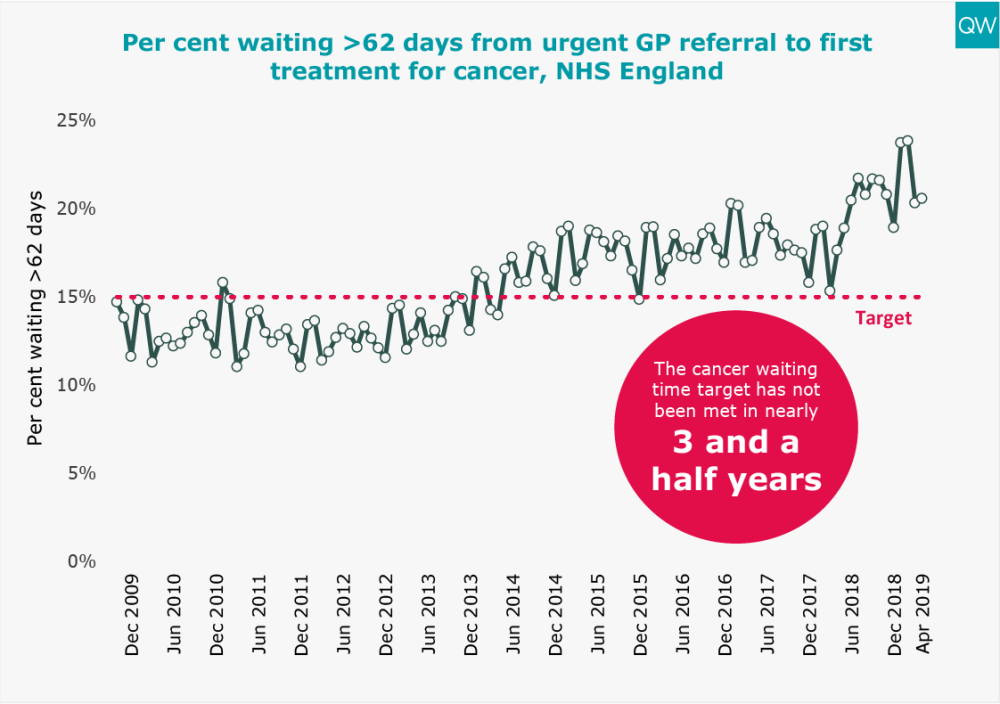
Cancer waiting times
- In April 2019, over one in five patients (20.6%) waited longer than two months to start their first treatment for cancer following an urgent GP referral. This is less than one percentage point higher than the previous month but three percentage points higher than in April 2018.
- The 62-day cancer target has now not been met for nearly three and a half years.