NHS England today published its Combined Performance Summary, which gives performance data from September for A&E, and from August for a range of other indicators.
Below is a selection of charts showing the most significant figures and how they compare with data from the last few years.
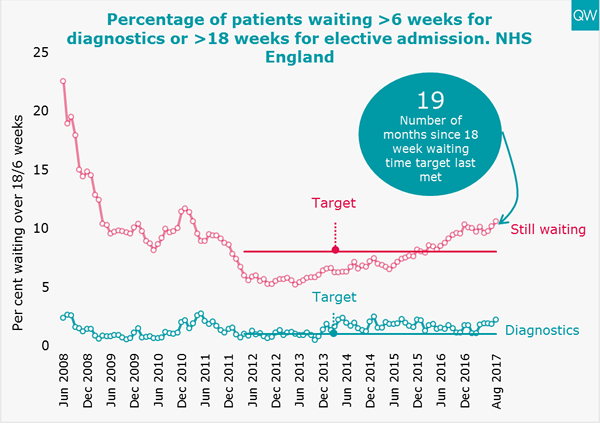
Diagnostic and elective waiting times
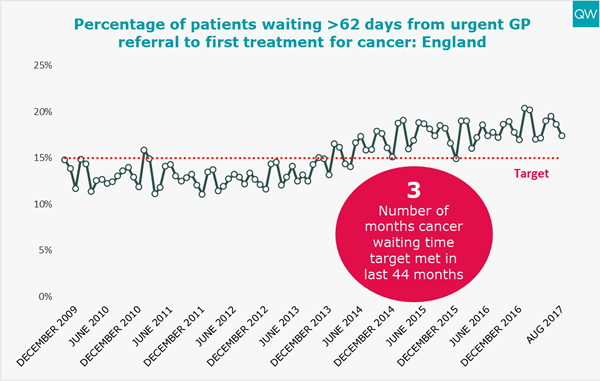
Cancer treatment referrals
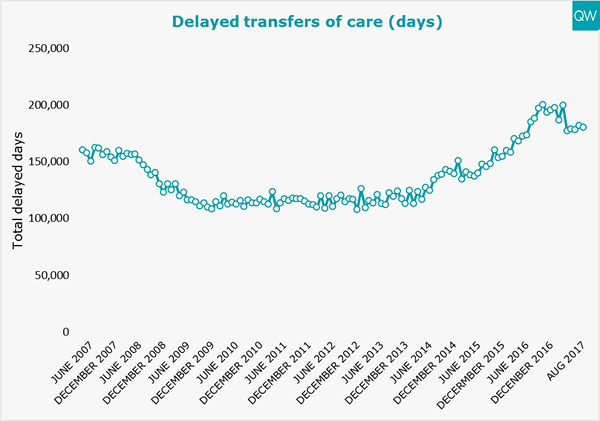
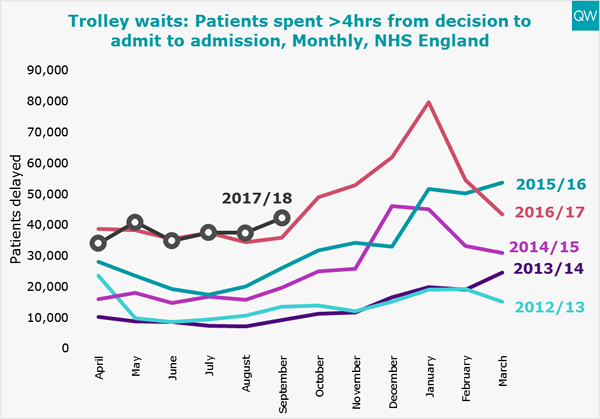
Delayed transfers of care