Today, NHS England published its Combined Performance Summary, which provides data on key performance measures for December 2018 and January 2019. SitRep data for Week 6 of 2019 was also released, giving a more up-to-date analysis of how the NHS is coping this winter. Here we show some of these statistics and how they compare with previous years.
For interactive charts showing the quality of health and social care over time, please refer to our 200+ indicators.
A&E
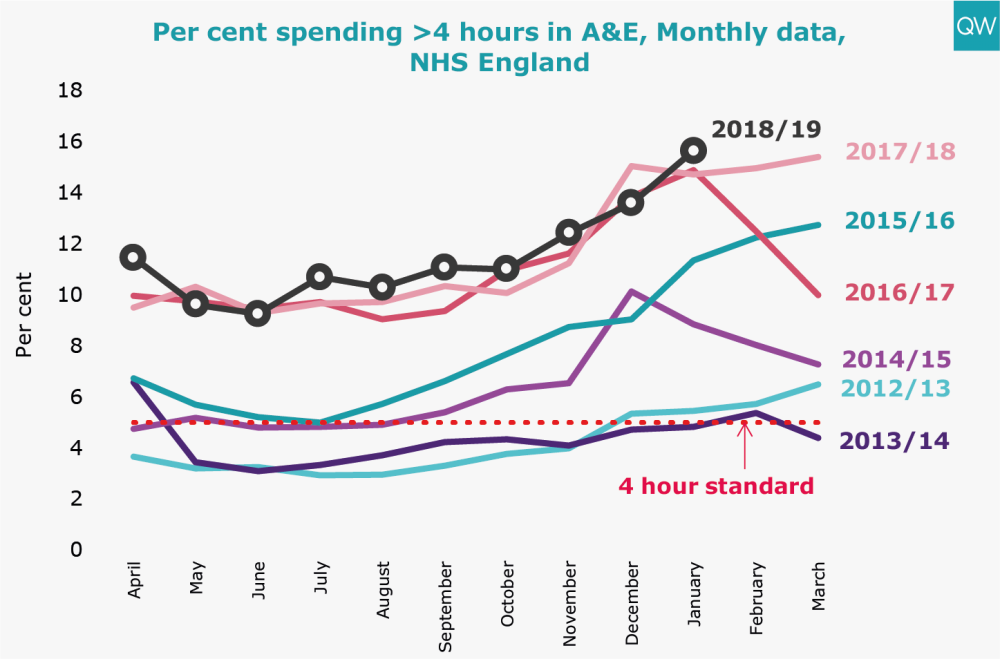
- In January 2019, 15.6% of people attending A&E spent more than 4 hours from arrival to admission, transfer or discharge. This is the highest it has been since the data set began.
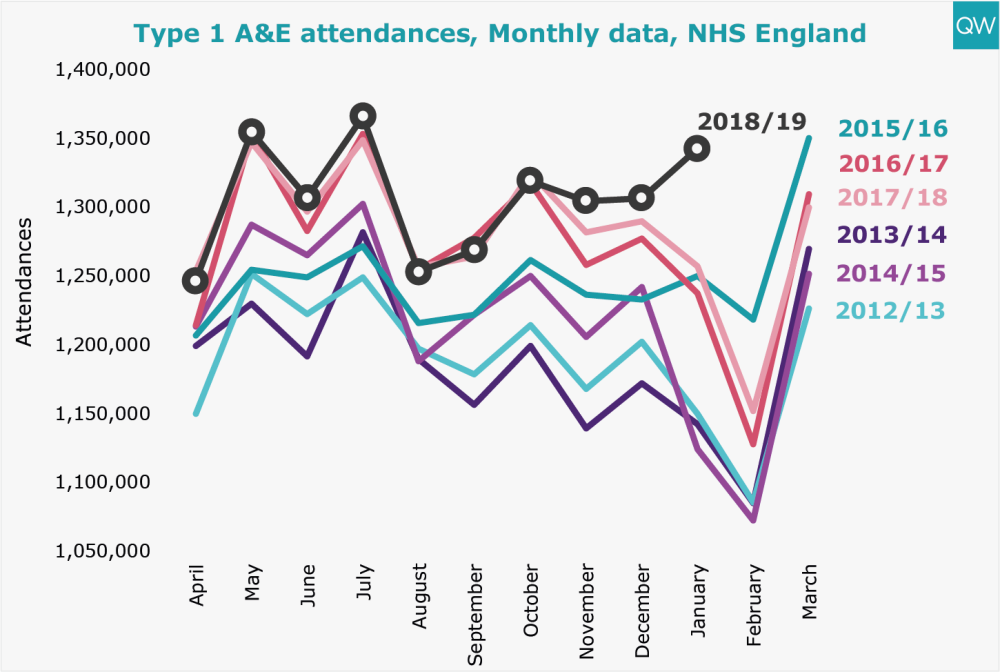
- Attendances in major A&E departments (Type 1) surpassed 1.34 million in January 2019, which is 7% higher than in January 2018. They were also up 3% on December 2018, which is unusual since attendances usually fall in January.
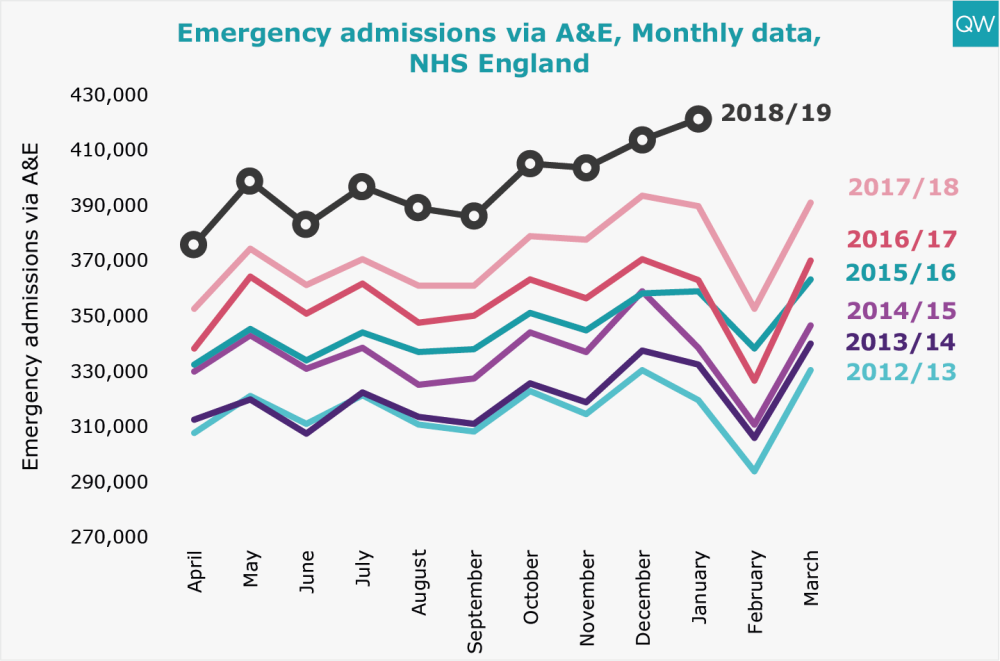
- Emergency admissions via A&E have continued to increase year-on-year, reaching over 421,000 in January 2019. This is 8% higher than the same month last year.
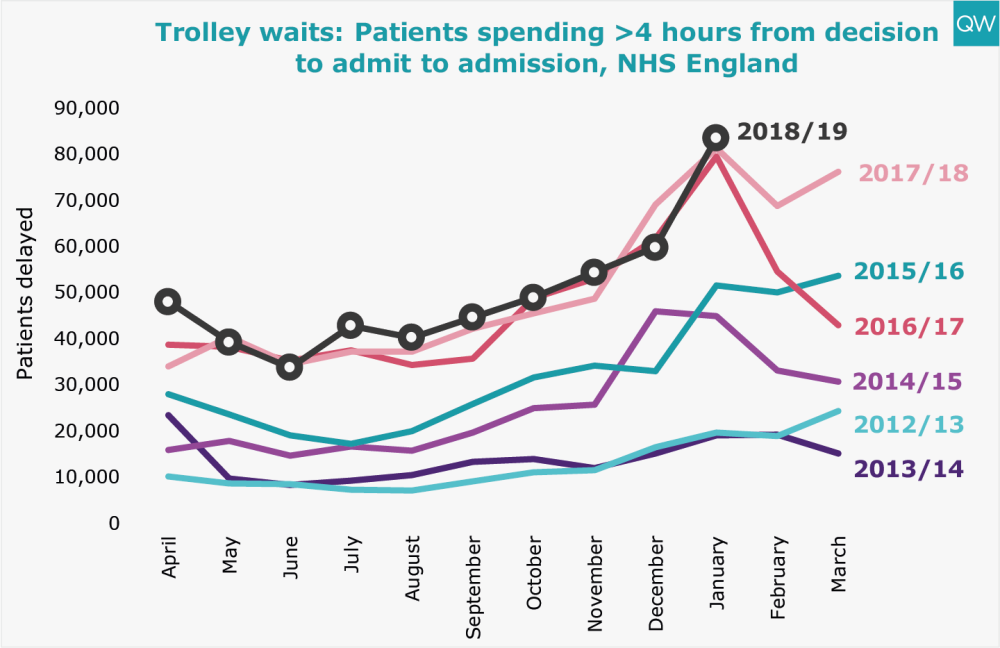
- 83,519 patients spent more than 4 hours waiting on a trolley from decision to admit to admission in January 2019. This is 3% higher than January of last year, and over 4 times higher than it was five years ago.
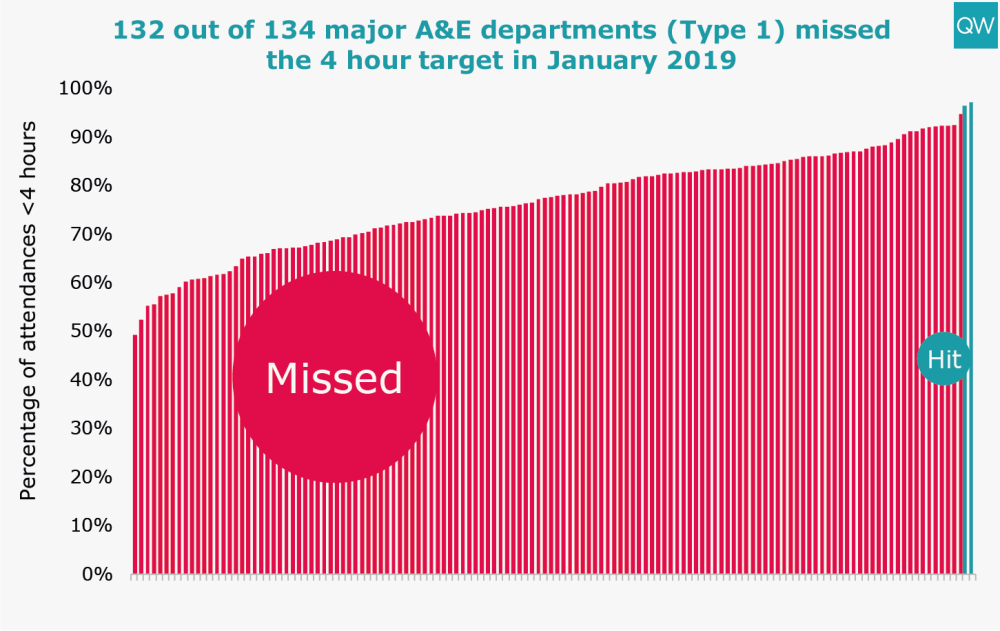
- Only two out of 134 major A&E departments met the four-hour A&E waiting time target in January 2019.
Ambulance
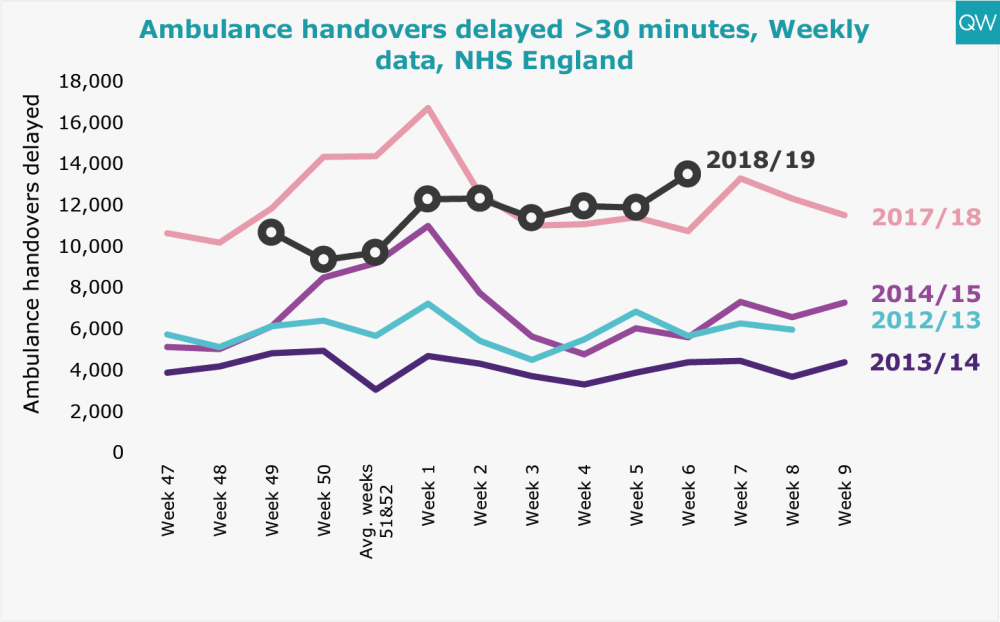
- In Week 6 of 2019 (commencing February 4th), 13,507 ambulances experienced a handover delay of over 30 minutes. This is 26% higher than Week 6 of 2018 and over 3 times higher than it was five years ago
Bed occupancy
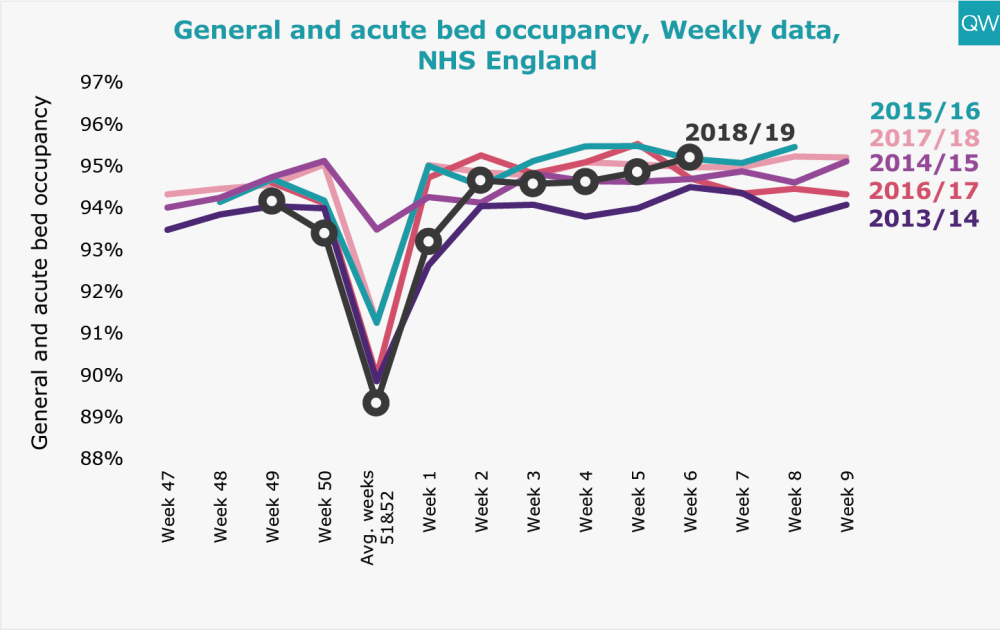
- General and acute bed occupancy was 95.2% in Week 6 of 2019. This is slightly higher (<1%) than Week 6 of the last five consecutive years.
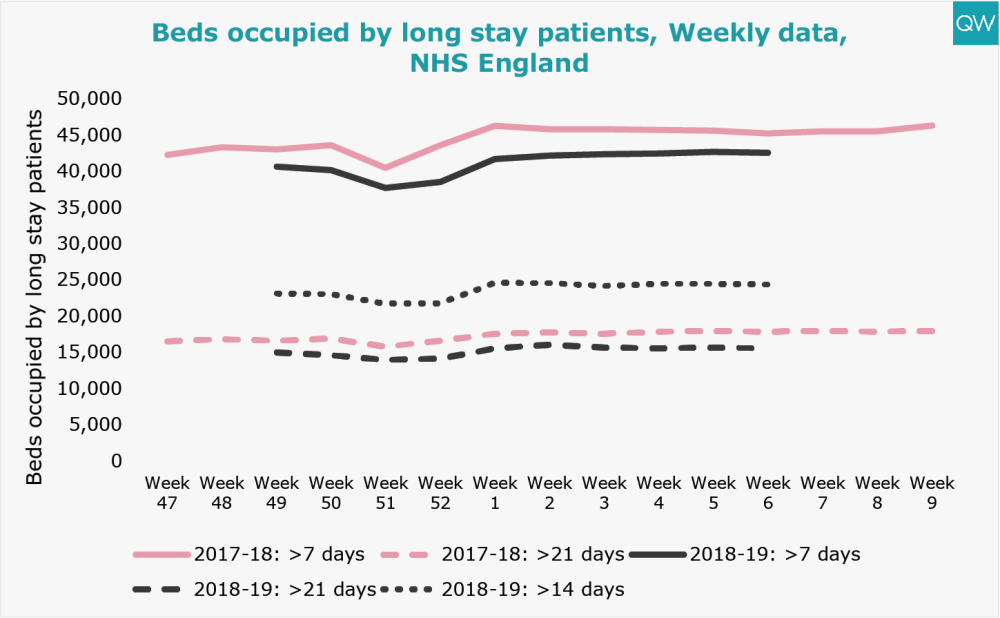
- In Week 6 of 2019, there was an average of 15,513 hospital beds occupied by long-stay patients (>21 days) per day. This is 13% lower than Week 6 of 2018.
Treatment and diagnostic test waiting times
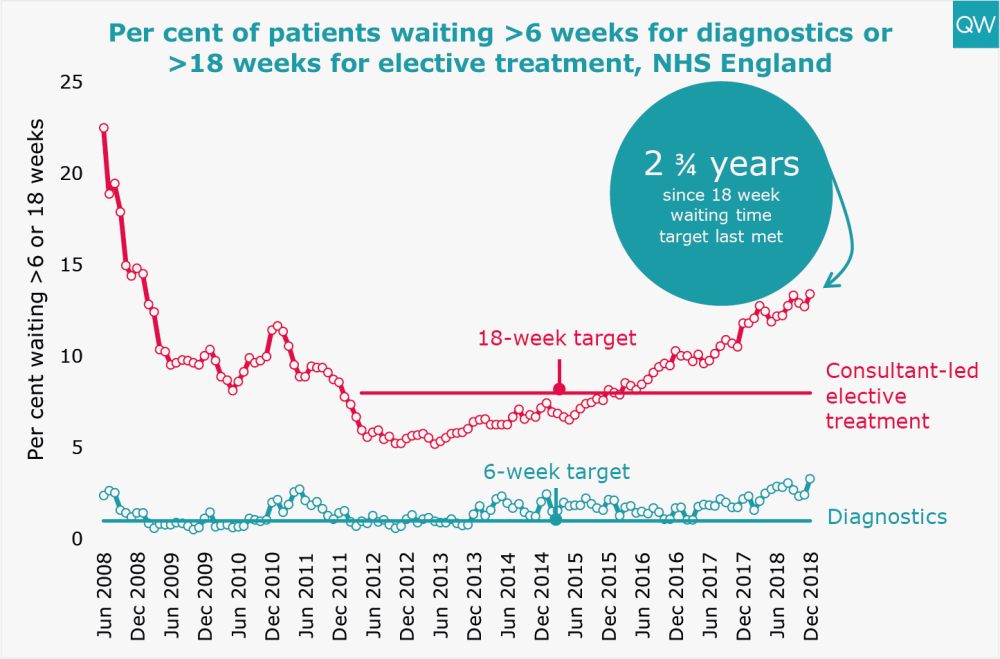
- The total number of people waiting to start consultant-led elective treatment remained above 4.2 million in December 2018.
- The proportion of people waiting over 18 weeks to start elective treatment reached 13.4% in December 2018 – the worst level of performance since January 2009. The referral-to-treatment target has not been met since February 2016.
- 2,237 people had been waiting over 52 weeks to start elective treatment in December 2018, which is 28% higher than in December 2017 but 36% lower than it was six months ago.
- In December 2018, 3.3% of patients had been waiting over 6 weeks for a diagnostic test.

Delayed transfers of care
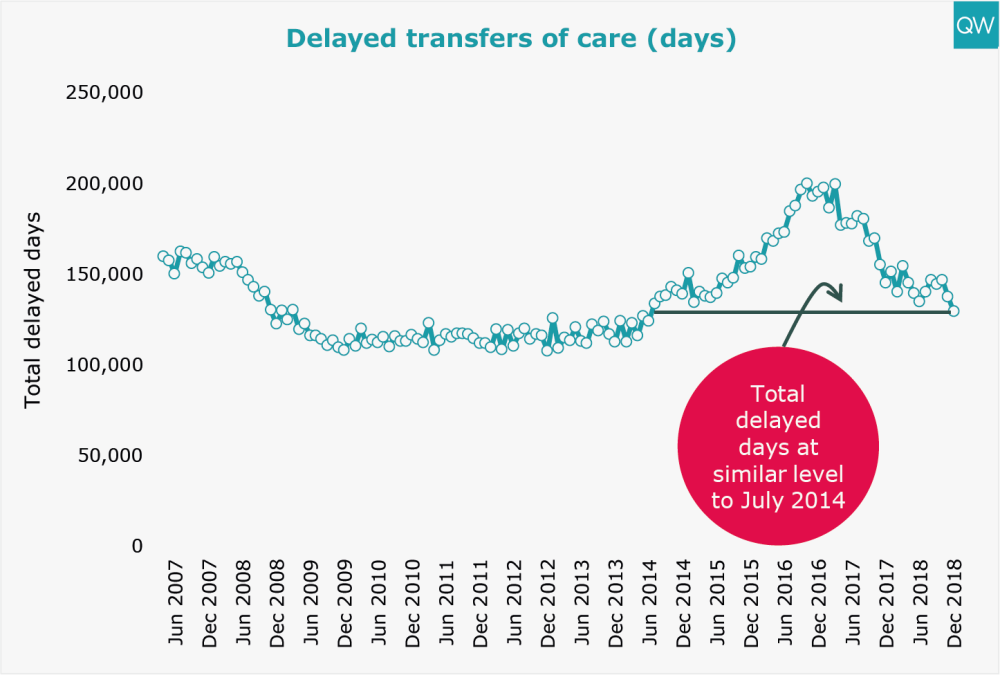
- The total number of delayed transfer of care days decreased to 129,374 in December 2018, which is 11% lower than in December 2017, but 15% higher than it was five years ago.
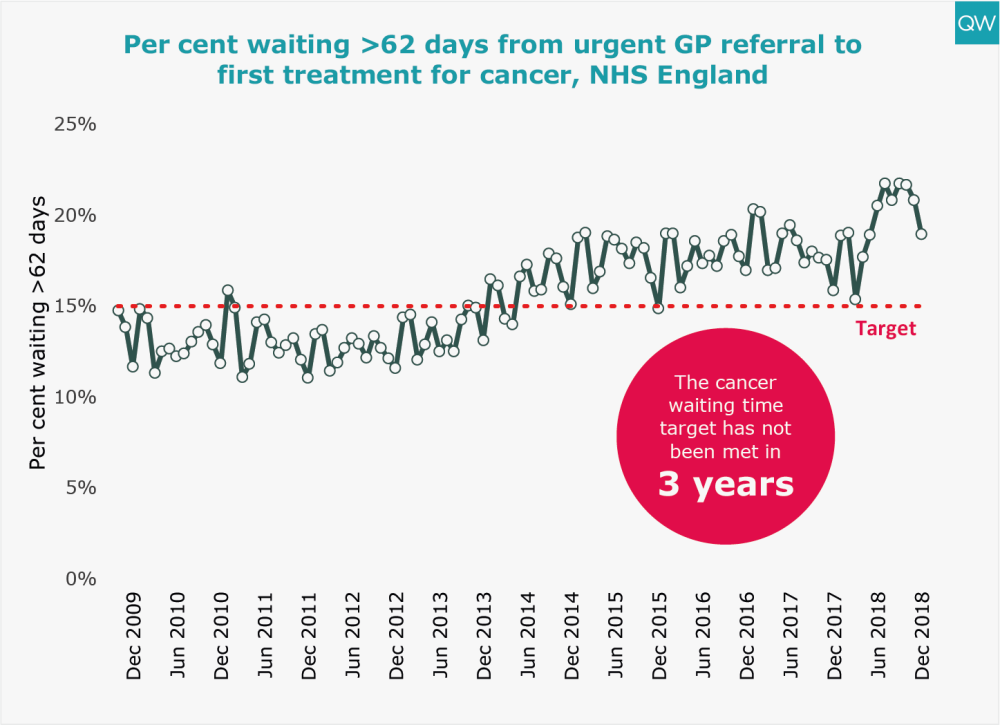
Cancer waiting times
- In December 2018, 19% of patients had been waiting longer than two months to start their first treatment for cancer following a GP urgent referral. The 62-day cancer target was last met three years ago.
- Alongside this there has been an increase in the number of cancer cases being urgently referred each month, from 8,147 in December 2009 to 12,299 in December 2018.