Today, NHS England published the latest data on key performance measures for February and March of this year. Here we show some of these statistics and how they compare with previous years.
During this unprecedented time for the health service, QualityWatch will continue to provide independent scrutiny of the health and social care system as far as possible. In light of the coronavirus (Covid-19) outbreak, NHS England have suspended data collection from 1 April to 30 June 2020 for some of their performance statistics, including delayed transfers of care. The most recent data published today is unaffected by this suspension, but may reflect changes in access and service use as a result of the outbreak.
In March 2019, the Clinically-Led Review of NHS Access Standards Interim Report was released, proposing some significant changes to many of the targets reported on here. A six-month Progress Report from the NHS Medical Director was also published in October 2019. Field testing of the proposed new standards began in 2019, however due to the coronavirus (Covid-19) outbreak, the review has been delayed until later this year.
For urgent and emergency care, the field test sites have not been submitting four-hour performance data since May 2019. The time series presented here excludes the field testing sites and so is comparable across months and years. For elective care, performance of the field test sites will continue to be included in the national time series, so the data is fully comparable over time.
For interactive charts showing the quality of health and social care over time, please refer to our 200+ indicators.
A&E
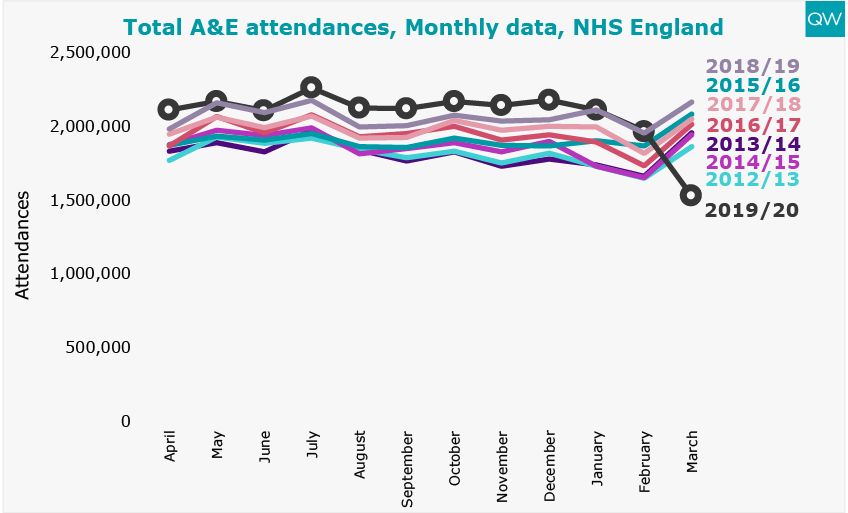
- The total number of A&E attendances fell to around 1.5 million in March 2020 – 22% lower than in February 2020. In 2019, there was an 11% increase in total A&E attendances between February and March.
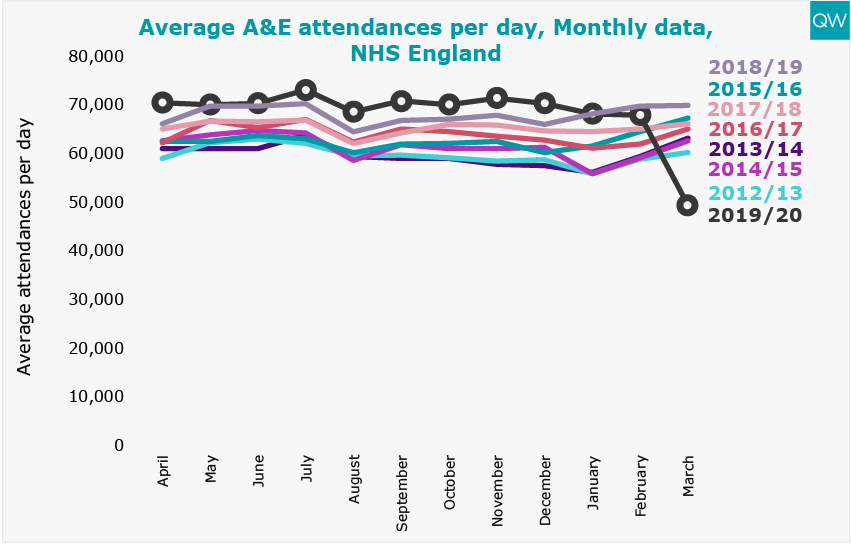
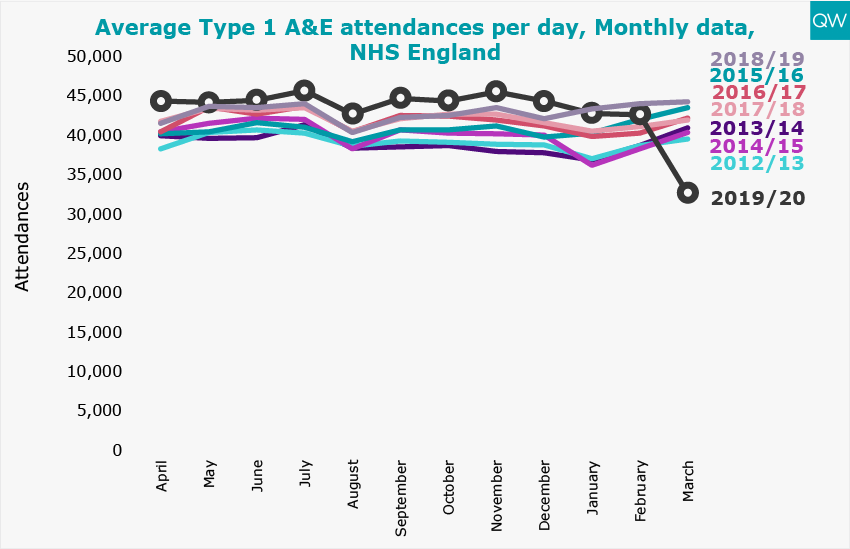
- There was an average of 49,390 A&E attendances per day in March 2020. This is 27% lower than in February 2020. This compares to last year, in 2019, when average attendances per day were approximately the same in February and March, and 2018 when there was a 1.7% increase in March compared to February.
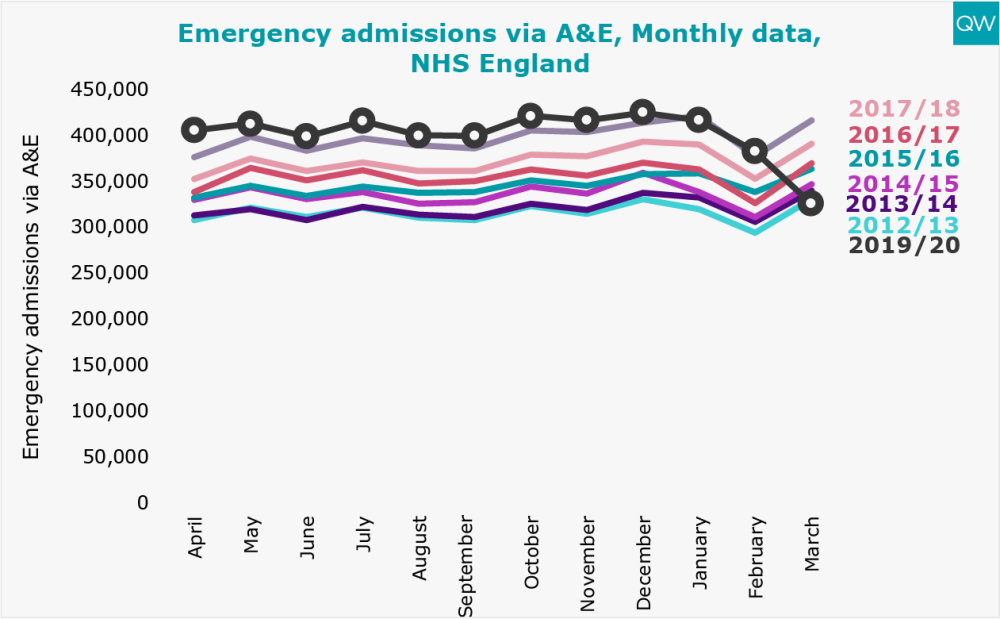
- Emergency admissions via A&E have generally been increasing year-on-year, but this year the number of emergency admissions has fallen for the last four consecutive months. In March 2020, there were 325,787 emergency admissions via A&E – 15% lower than in February 2020. This contrasts to 2019, when emergency admissions increased by 10% between February and March.
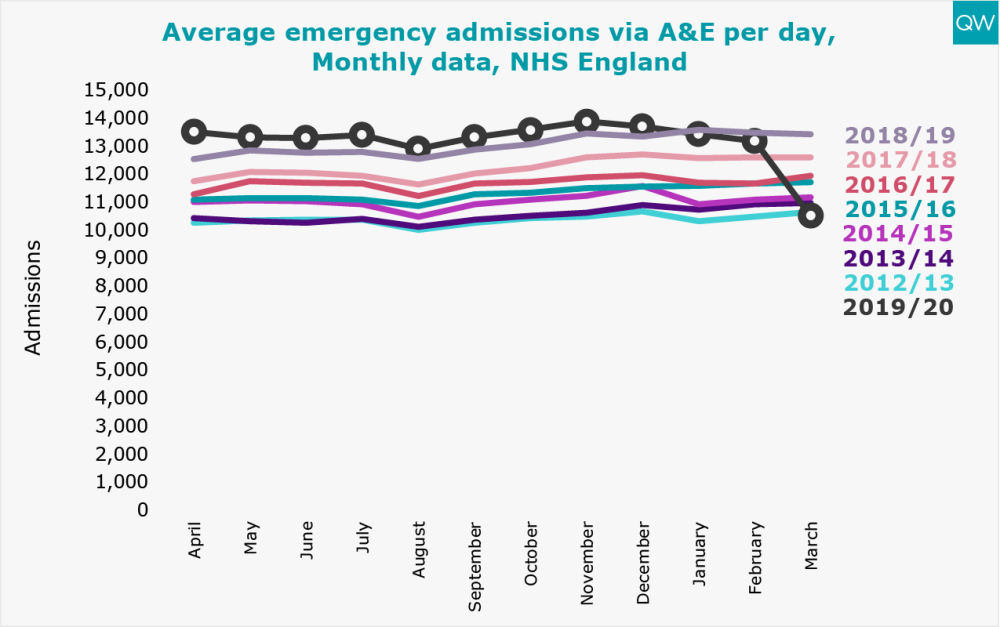
- The average number of emergency admissions via A&E per day dropped to 10,509 in March 2020. This is a 20% decrease compared with February 2020, while in 2018 and 2019 the average number of emergency admissions per day remained roughly constant between February and March.
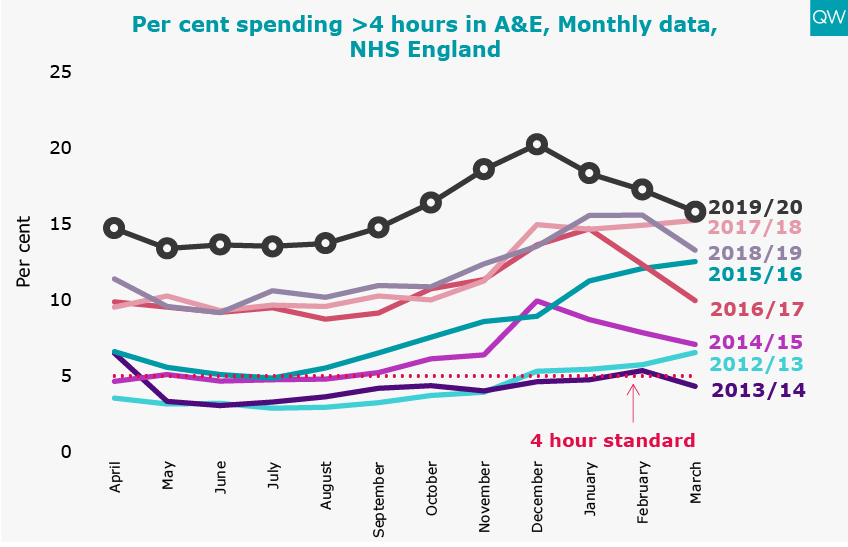
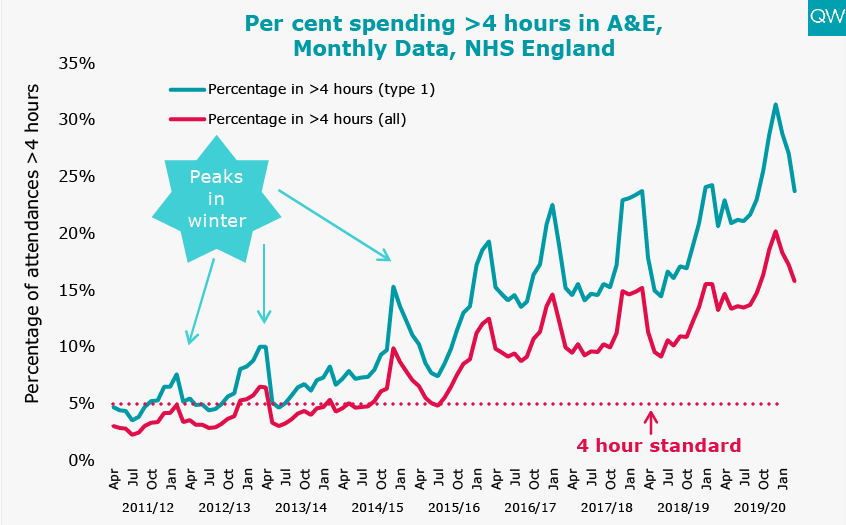
- In March 2020, 15.8% of people attending A&E spent more than four hours from arrival to admission, transfer or discharge. This has decreased for the past three consecutive months, but is still the worst performance for any March since records began.
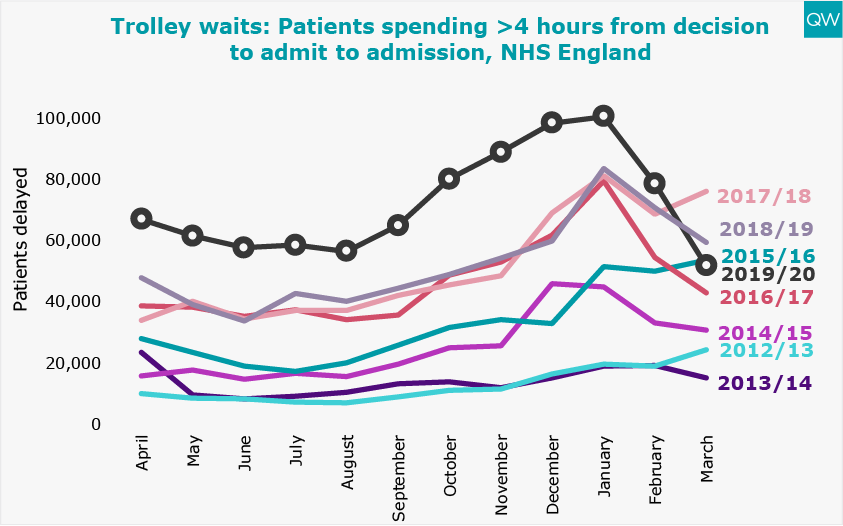
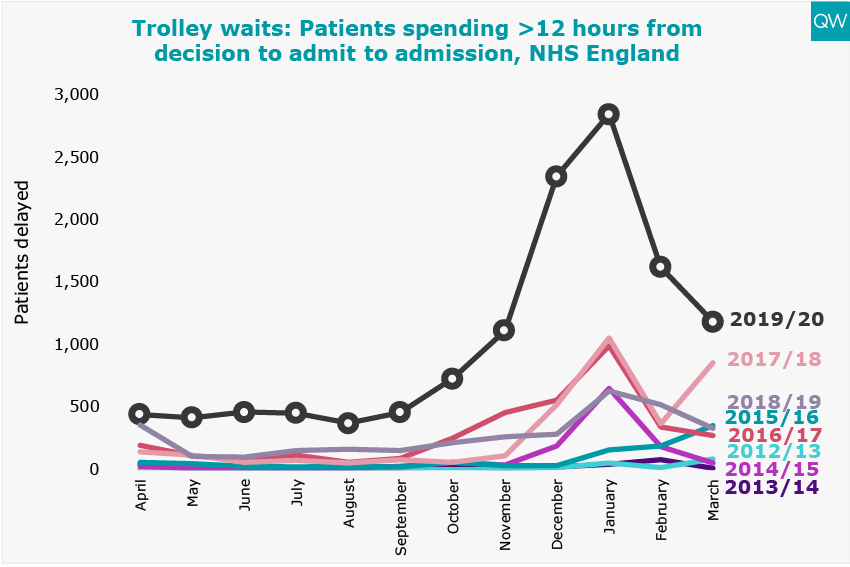
- 51,795 patients spent more than four hours waiting on a trolley from a decision to admit to admission in March 2020. 1,184 patients had a trolley wait of over 12 hours, which is the highest for any March since records began.
Ambulance response times
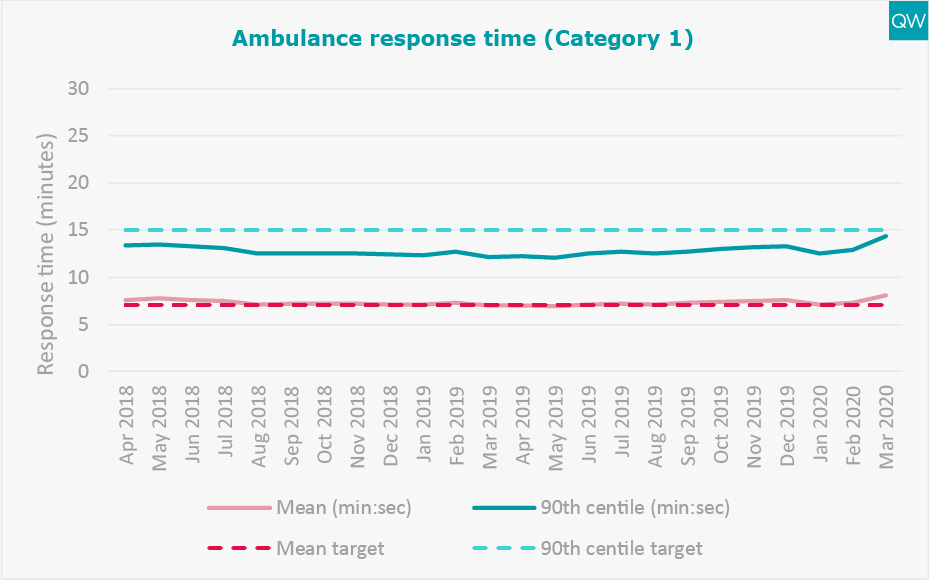
- The average ambulance response time for Category 1 (life-threatening) calls increased slightly to 8 minutes 7 seconds in March 2020. The 90th centile response time was 14 minutes 22 seconds.
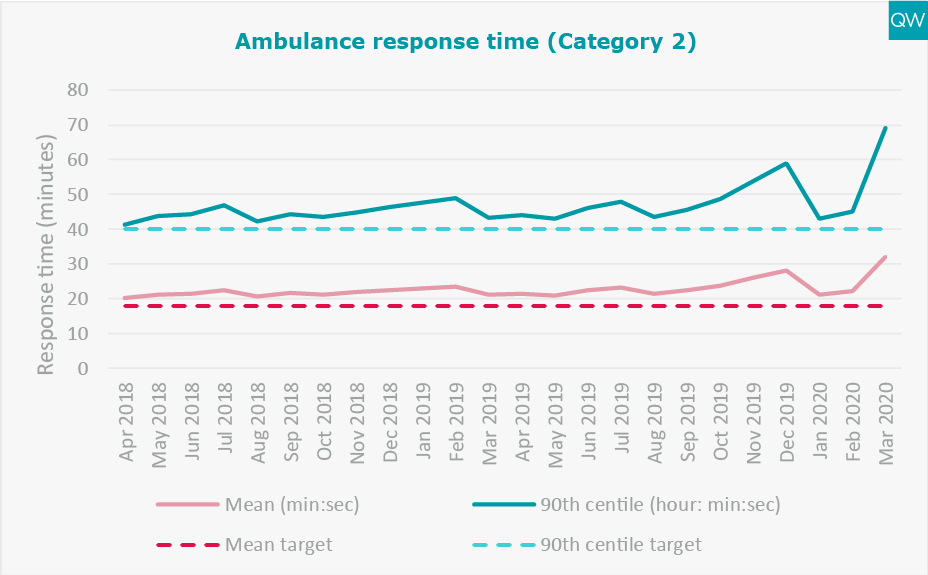
- The average response time for Category 2 (emergency) calls increased to 32 minutes 6 seconds in March 2020. The 90th centile response time was 1 hour 9 minutes 1 second. The target response time for Category 2 calls (an average response time of 18 minutes and a 90th centile response time of 40 minutes) has not been met since it was introduced in April 2018.
Treatment and diagnostic test waiting times
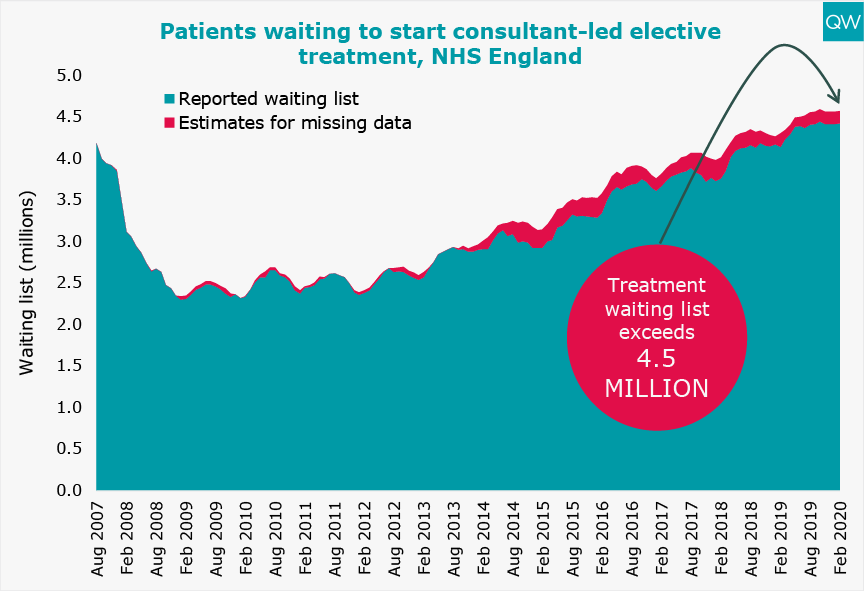
- The total number of people waiting to start consultant-led elective treatment remained above 4.5 million in February 2020 (reported waiting list plus the estimate of missing data).
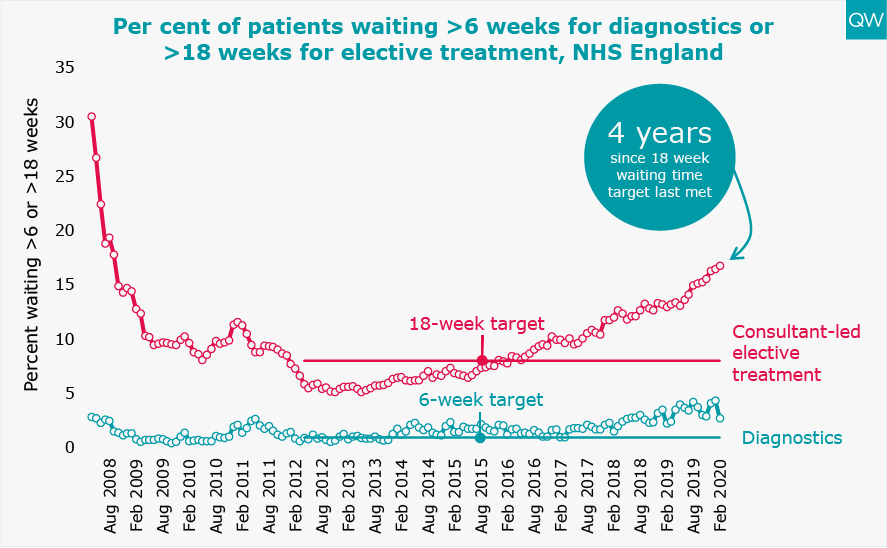
- The proportion of people waiting over 18 weeks to start elective treatment reached 16.8% in February 2020. The 18-week target has not been met for four years.
- In February 2020, 2.8% of patients had been waiting over six weeks for a diagnostic test. The diagnostic waiting time target has not been met for over six years.
Delayed transfers of care
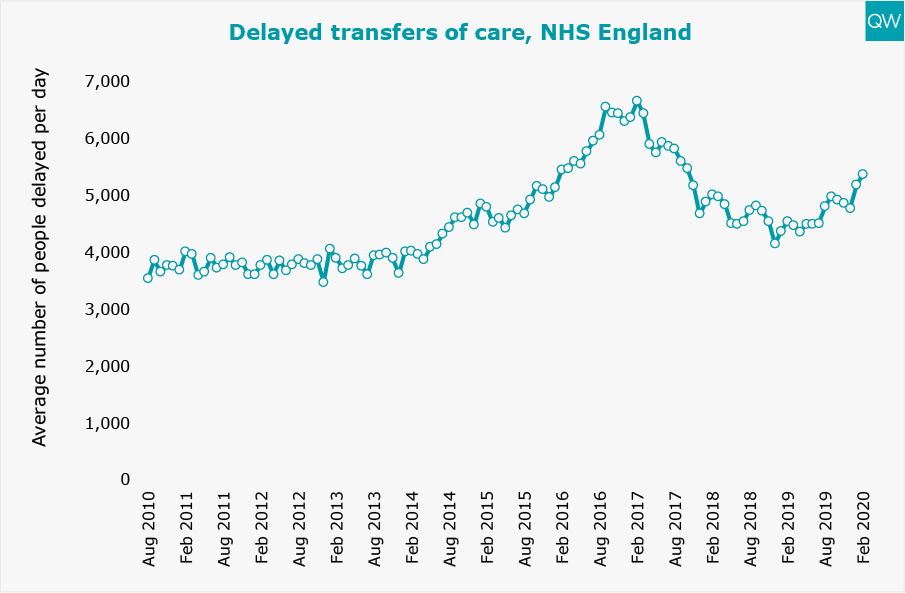
- There was an average of 5,370 people delayed per day in February 2020. This is 18% higher than it was in February 2018, but 22% lower than in February 2017.
Cancer waiting times
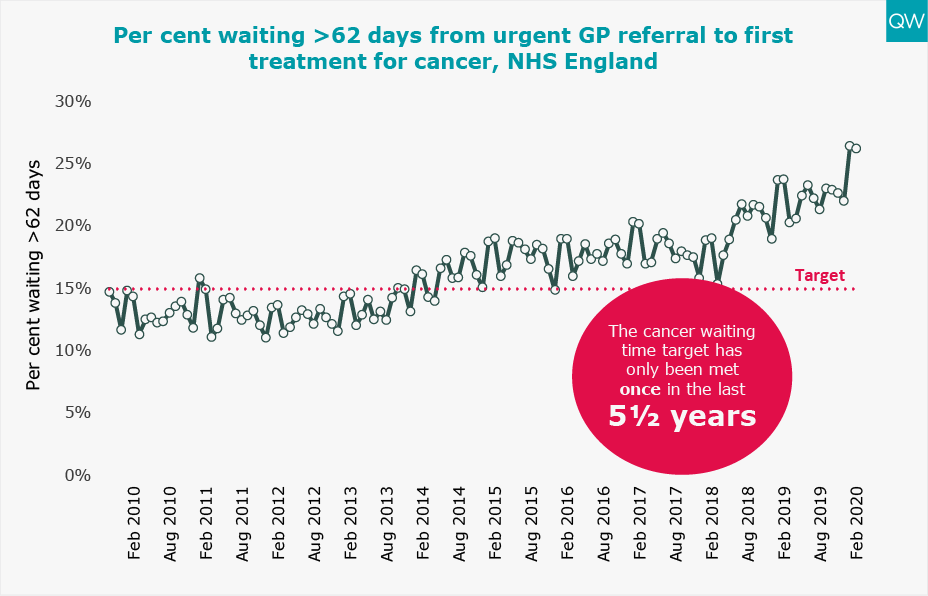
- In February 2020, over one in five patients (26%) waited longer than two months to start their first treatment for cancer following an urgent GP referral – the worst performance for any February since records began.
- The 62-day cancer target has not been met for over four years.