Today, NHS England published the latest data on key performance measures for January and February of this year. Here we show some of these statistics and how they compare with previous years.
In March 2019, the Clinically-Led Review of NHS Access Standards Interim Report was released, proposing some significant changes to many of the targets reported on here. A six-month Progress Report from the NHS Medical Director was also published in October 2019.
For urgent and emergency care, field testing of the proposed new standards began in 14 hospital trusts on 22 May 2019. The first stage of testing focused on measuring the “mean time in A&E”, when compared to the existing four-hour target. The field test sites have not been submitting four-hour performance data since May 2019, so the national time series omits these sites’ A&E performance. The time series data presented here excludes the field testing sites and so is comparable across months and years.
For elective care, field testing of the proposed new standards began in 12 hospital trusts in early August 2019. These trusts are testing the use of an average (mean) wait measure for people on the waiting list as a potential alternative to the current 18-week threshold target. Performance of the field test sites will continue to be included in the national time series, so the data is fully comparable over time.
For interactive charts showing the quality of health and social care over time, please refer to our 200+ indicators.
A&E
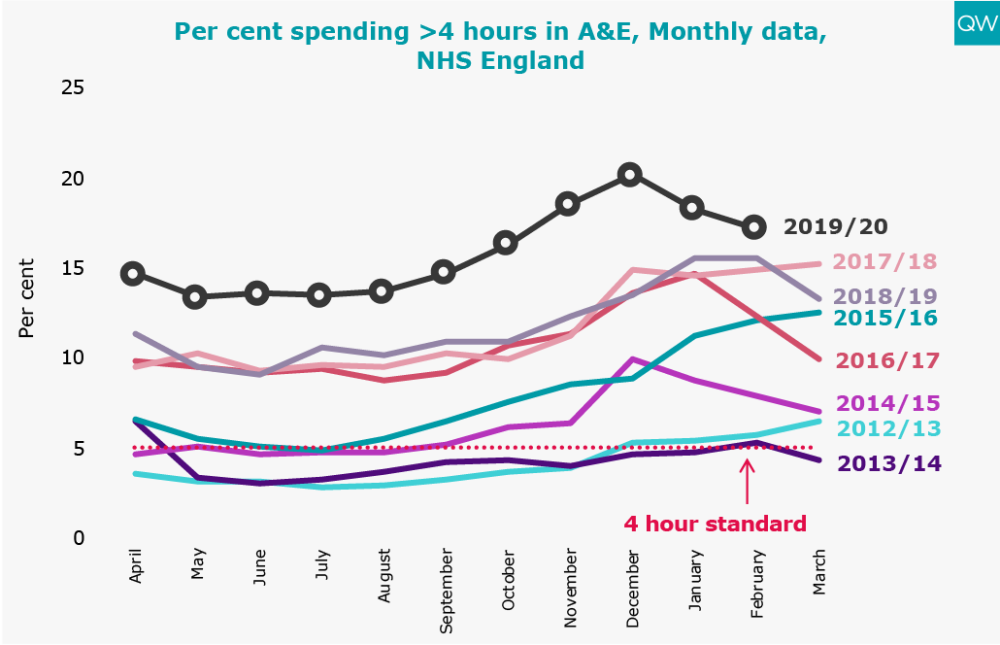
- In February 2020, 17.2% of people attending A&E spent more than four hours from arrival to admission, transfer or discharge – the worst performance for any February since records began.
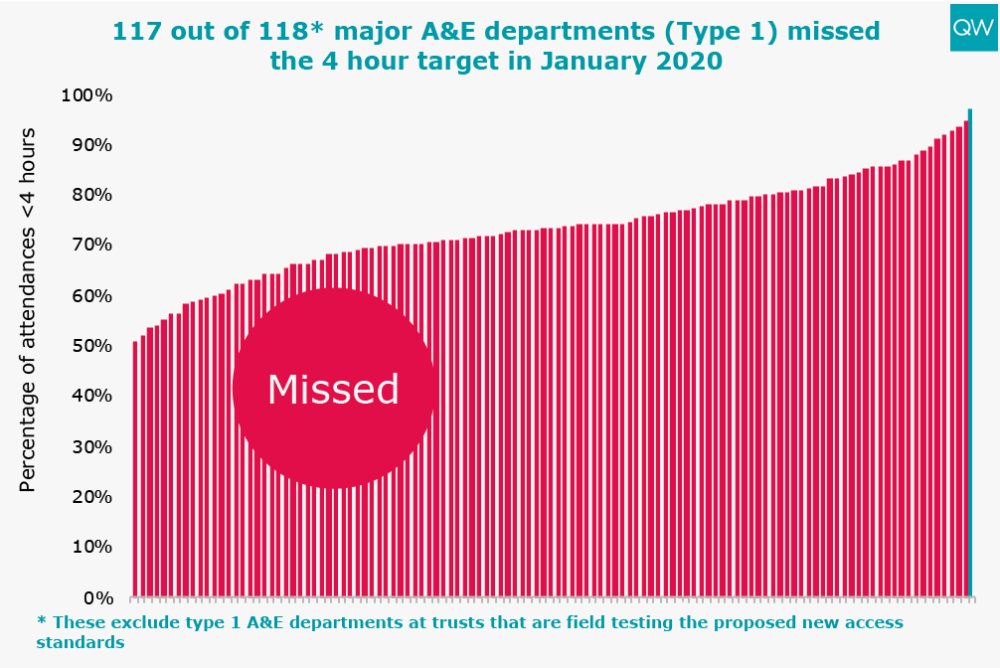
- Only one out of 118 major A&E departments (type 1) that submitted performance data met the four-hour A&E waiting time target in February 2020.
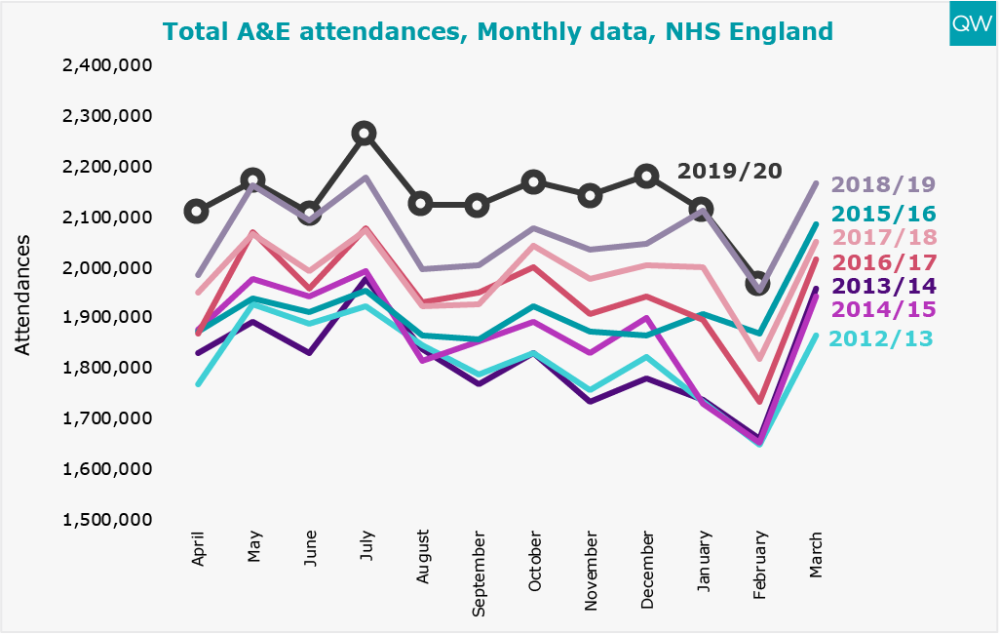
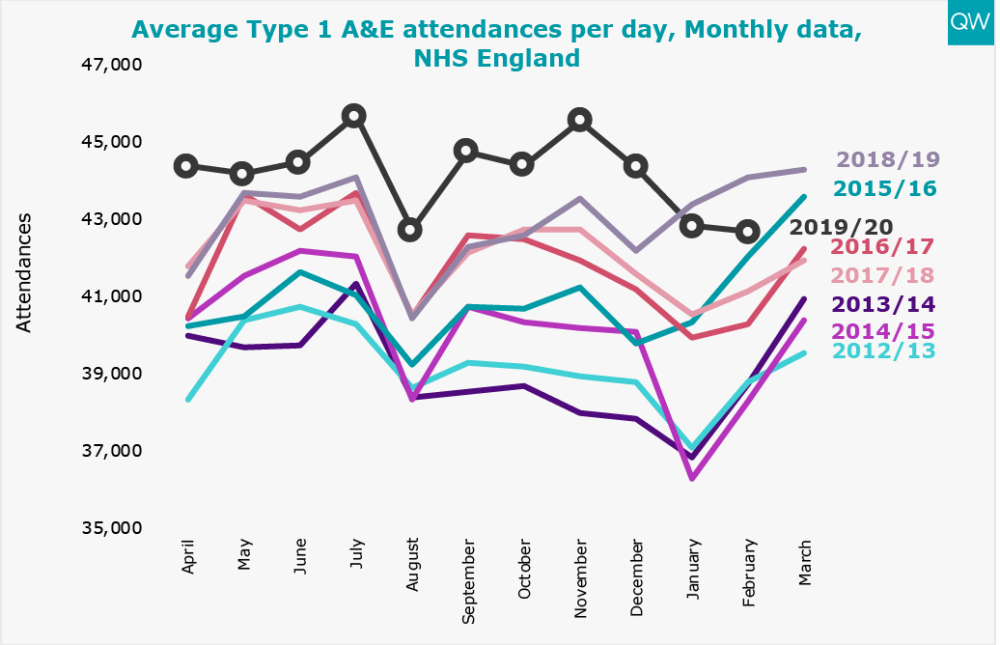
- The total number of A&E attendances exceeded 1.9 million in February 2020, which is about the same as it was in February last year. There was an average of 67,920 A&E attendances per day, which is 3% lower than February last year.
- There were over 1.23 million type 1 A&E attendances in February 2020. This equates to an average of 42,664 type 1 A&E attendances per day – a decrease of 3% compared to February 2019.
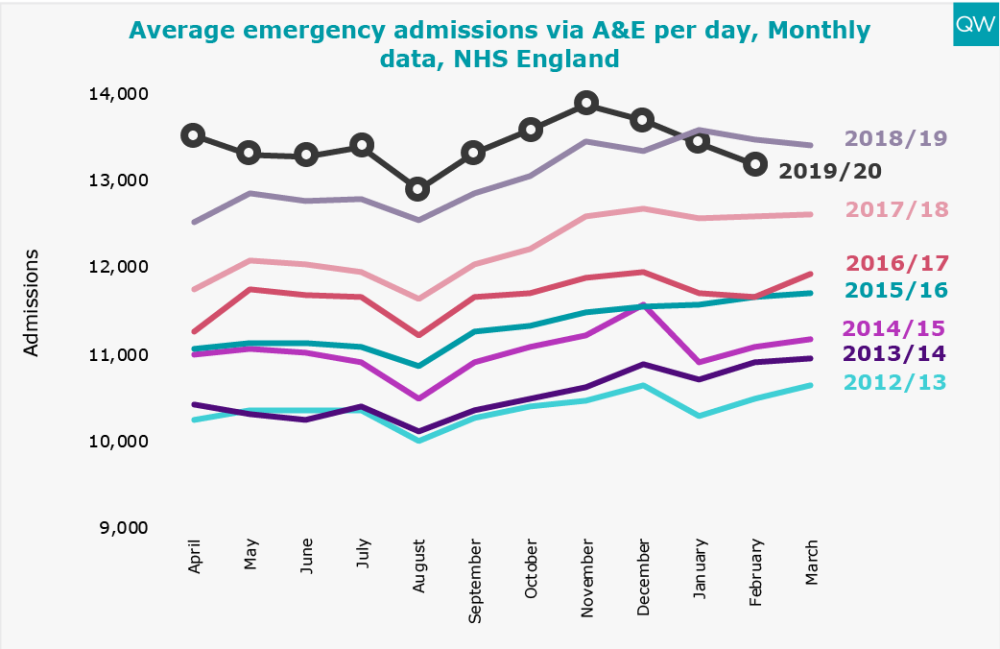
- Emergency admissions via A&E have generally been increasing year-on-year. But the average number of emergency admissions via A&E per day has fallen for the last three consecutive months and dropped to 13,182 in February, which is 2% lower than in February 2019.
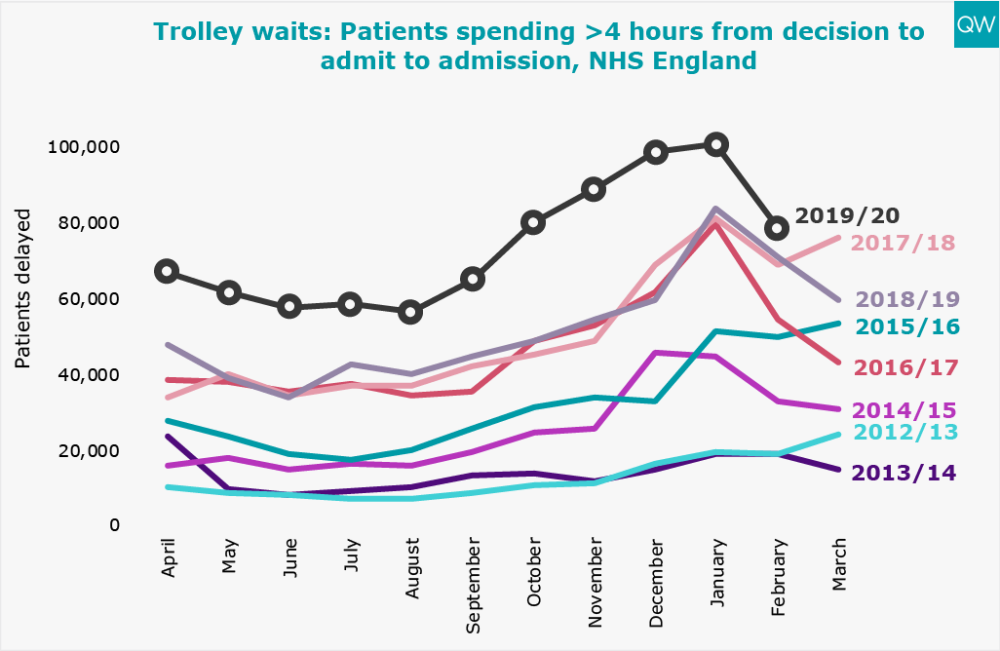
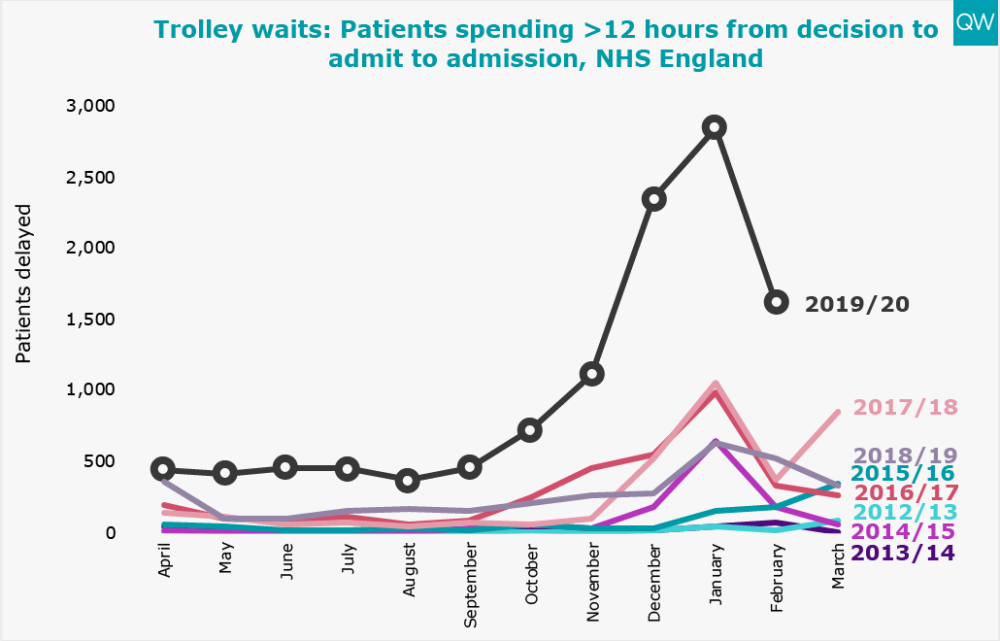
- 78,646 patients spent more than four hours waiting on a trolley from a decision to admit to admission in February 2020; this is the highest for any February since records began. 1,621 patients had a trolley wait of over 12 hours, which is more than three times higher than in February 2019.
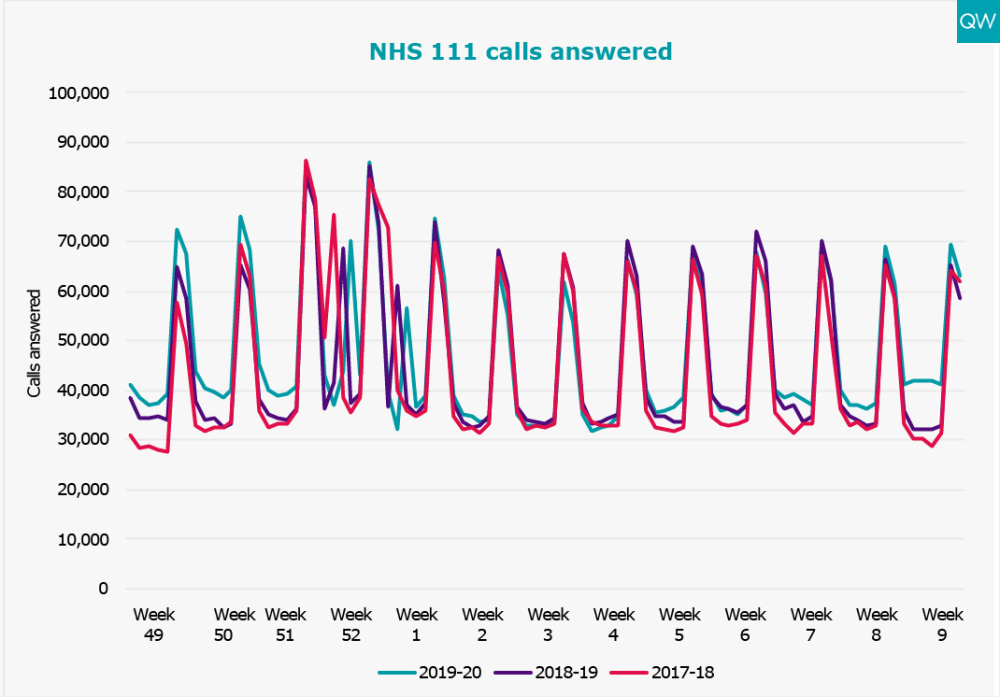
NHS 111
- The number of NHS 111 calls answered peak over the weekend. However, in Week 9 of 2020 (commencing 24 February), the number of calls answered increased by 51,246 compared with Week 9 of 2019. This increase mostly occurred on weekdays, and may be related to the recent outbreak of coronavirus.
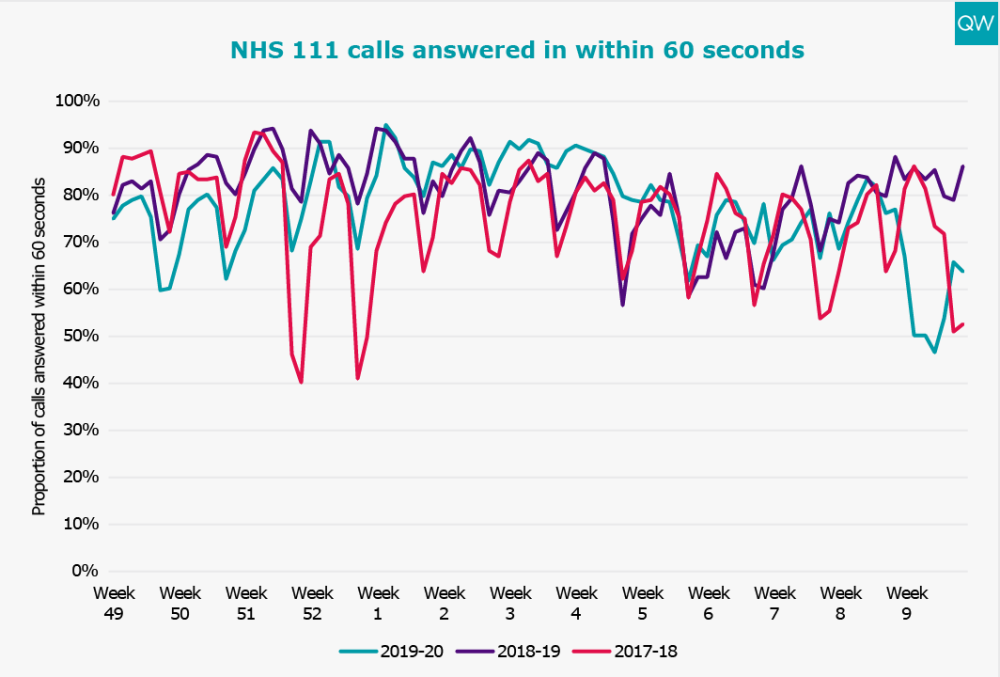
- In Week 9 of 2020, an average of 57% of calls were answered within 60 seconds, compared to 83% in Week 9 of 2019.
Treatment and diagnostic test waiting times
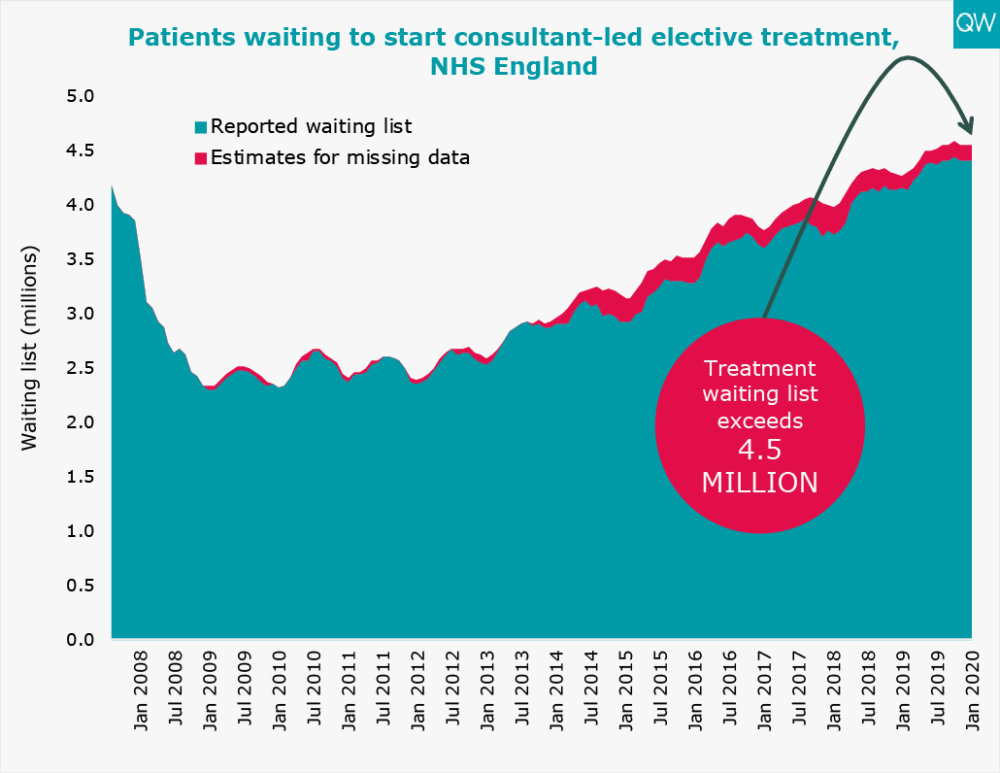
- The total number of people waiting to start consultant-led elective treatment remained above 4.5 million in January 2020 (reported waiting list plus the estimate of missing data).
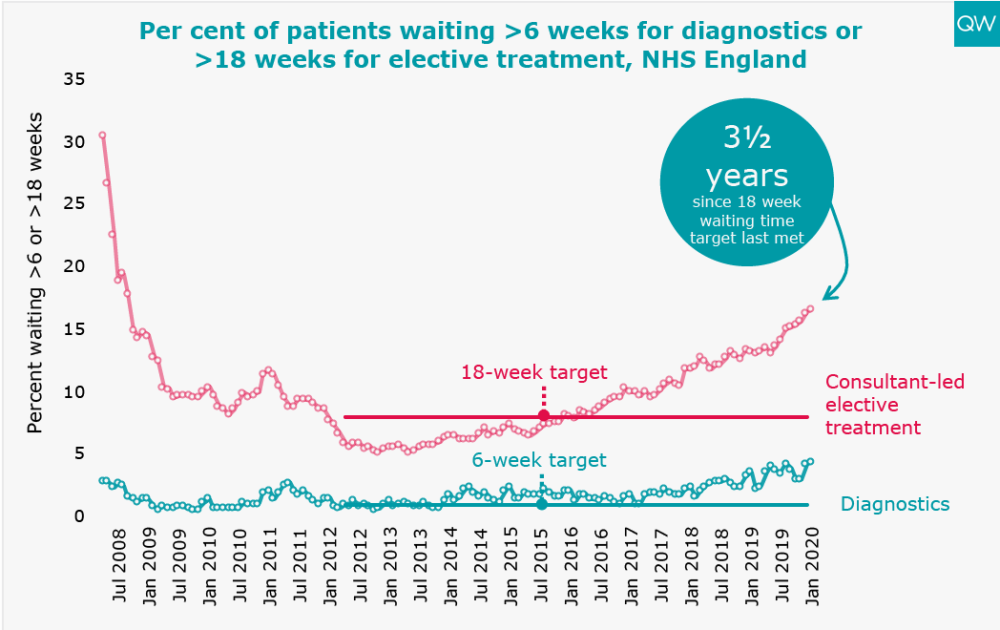
- The proportion of people waiting over 18 weeks to start elective treatment reached 16.5% in January 2020 – the highest level since September 2008.
- In January 2020, 4.4% of patients had been waiting over six weeks for a diagnostic test – the highest proportion since February 2008. The diagnostic waiting time target has not been met for over six years.
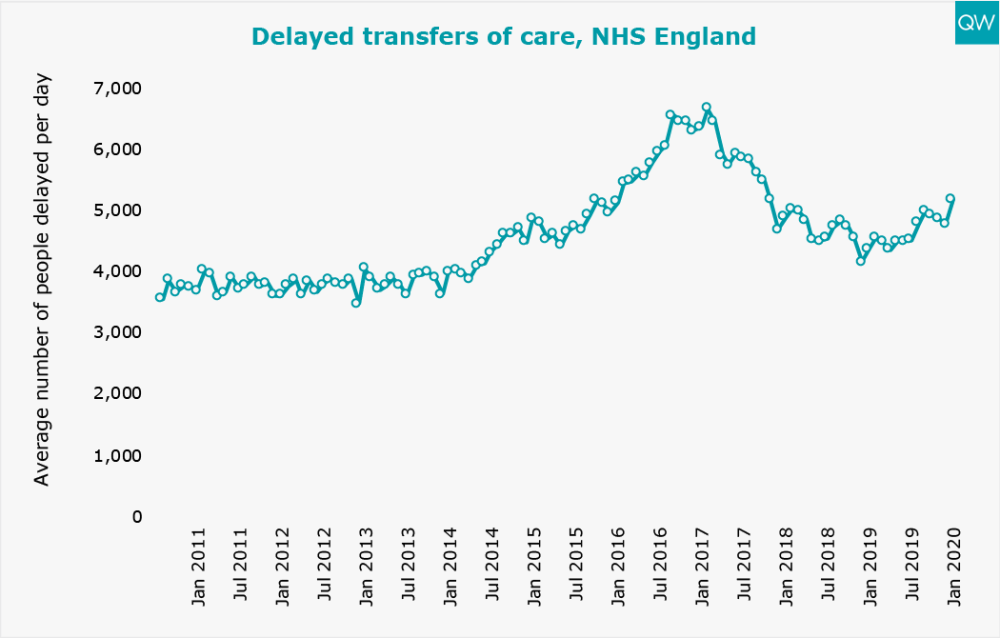
Delayed transfers of care
- There was an average of 5,182 people delayed per day in January 2020. This is 19% lower than it was in January 2017, but 29% higher than it was in January 2014.
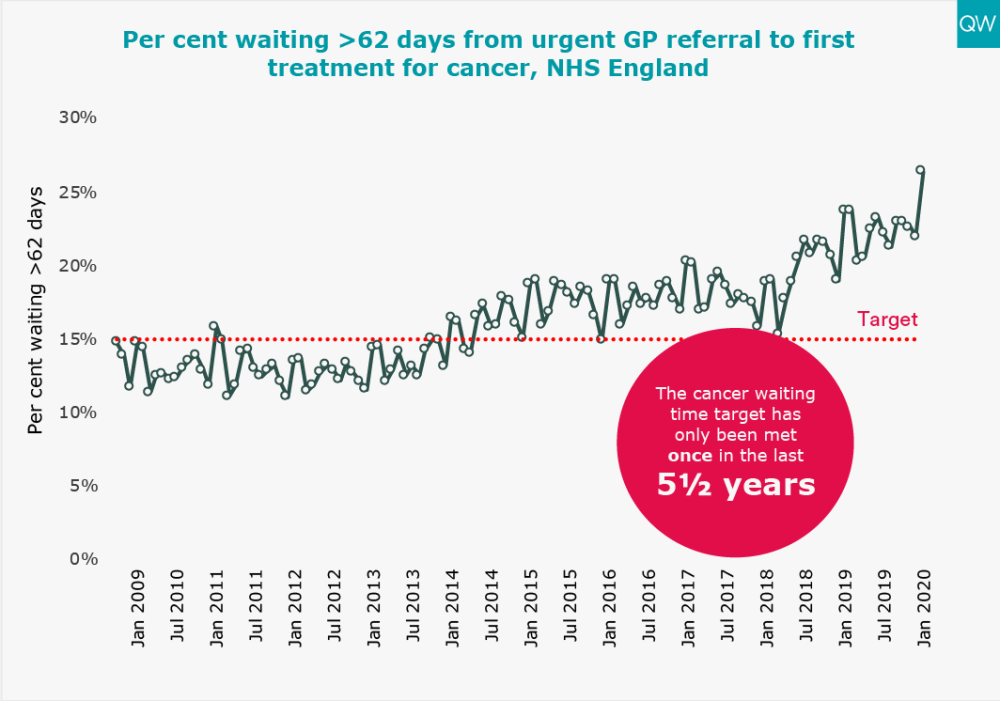
Cancer waiting times
- In January 2020, over one in five patients (26%) waited longer than two months to start their first treatment for cancer following an urgent GP referral – the worst performance since records began.
- The 62-day cancer target has not been met for four years.