Today, NHS England published its Combined Performance Summary, which provides data on key performance measures for March and April of this year. Here we show some of these statistics and how they compare with previous years.
In March, the Clinically-Led Review of NHS Access Standards Interim Report was released, which proposed some significant changes to many of the targets reported on here. While field testing is occurring, NHS England will continue to monitor performance against the current access standards that are set out in the NHS Constitution Handbook.
For interactive charts showing the quality of health and social care over time, please refer to our 200+ indicators.
A&E
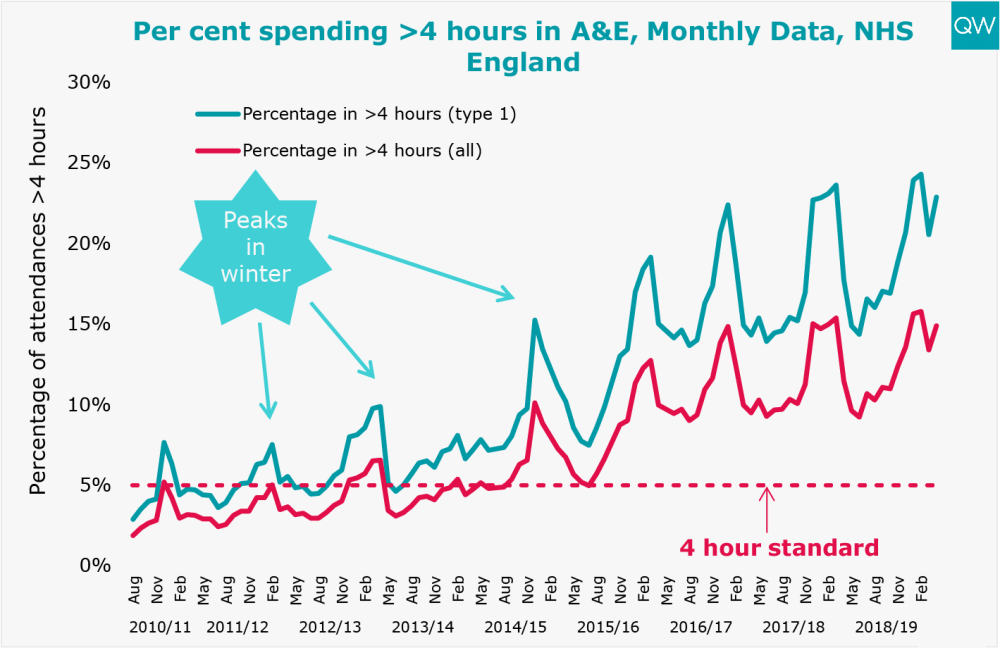
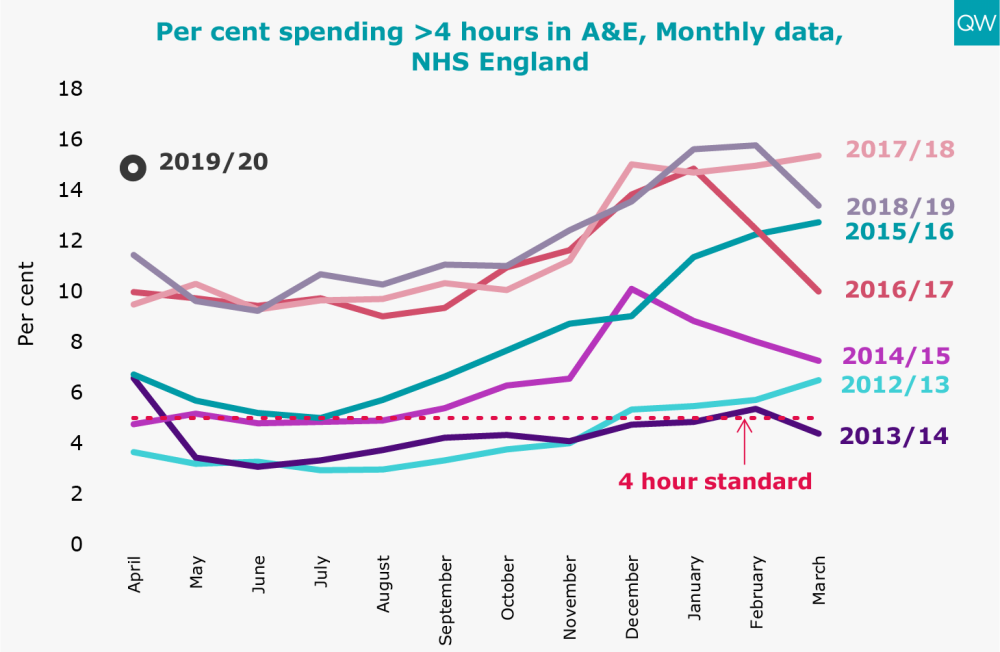
- In April 2019, 14.9% of people attending A&E spent more than 4 hours from arrival to admission, transfer or discharge – the worst performance for April on record. There was a 1.5 percentage point increase on the previous month, and a 3.4 percentage point increase on April 2018.
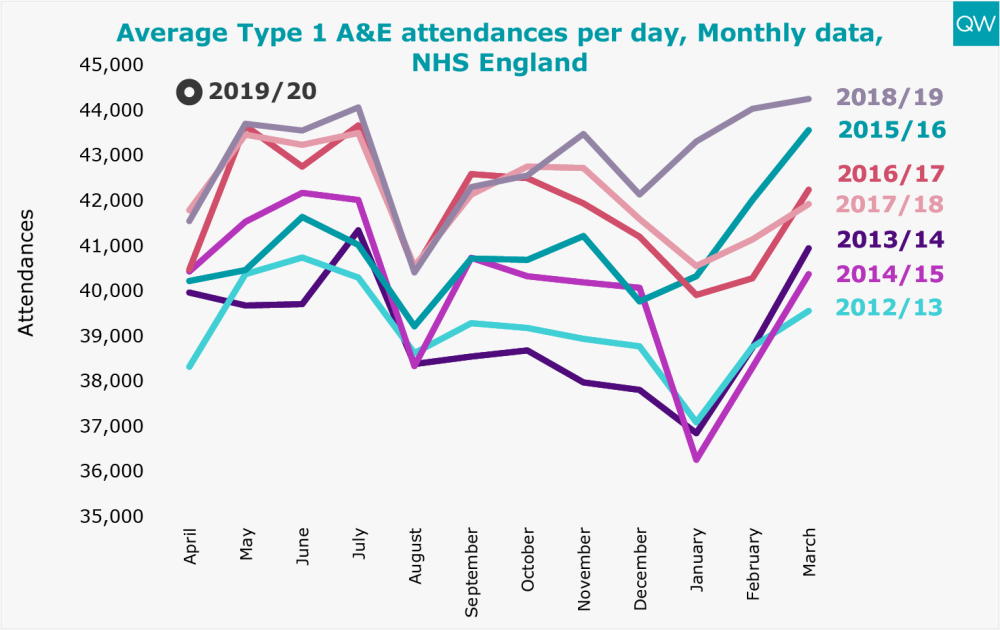
- This deterioration in performance comes alongside a 7% increase in the average number of major A&E department (Type 1) attendances per day in April 2019 compared to April last year. In April 2019, there was a total of 1.3 million Type 1 A&E attendances, equating to an average of 44,400 attendances per day.
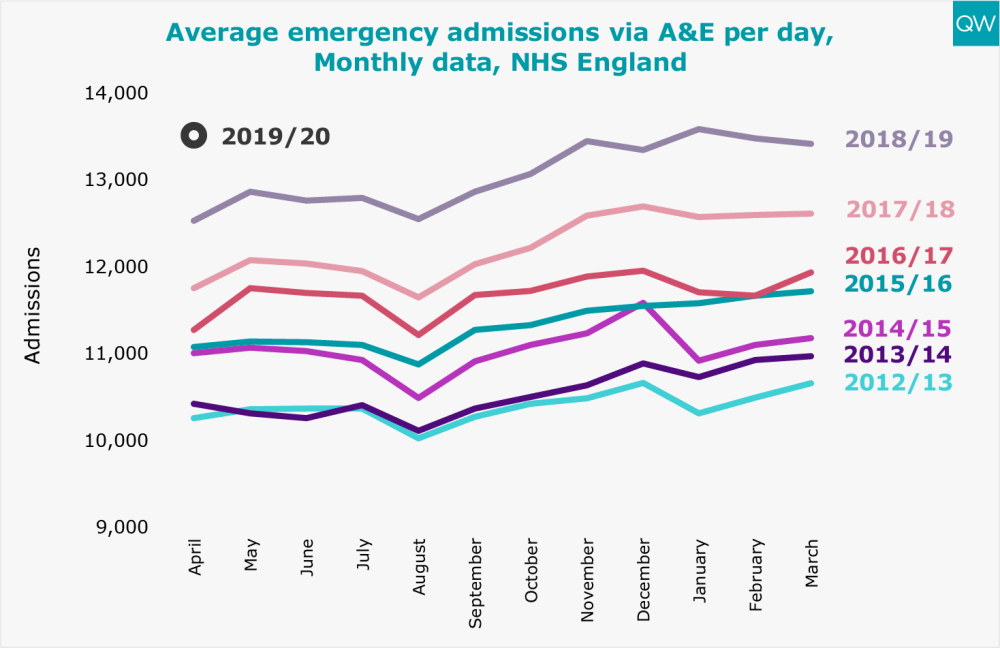
- Emergency admissions via A&E have been increasing year-on-year, reaching over 405,000 in April 2019. The average number of emergency admissions via A&E per day reached 13,512 in April, which is 8% higher than the same month last year. This increase may be related to the rise in same-day emergency care, where patients are treated and discharged on the same day as admission.
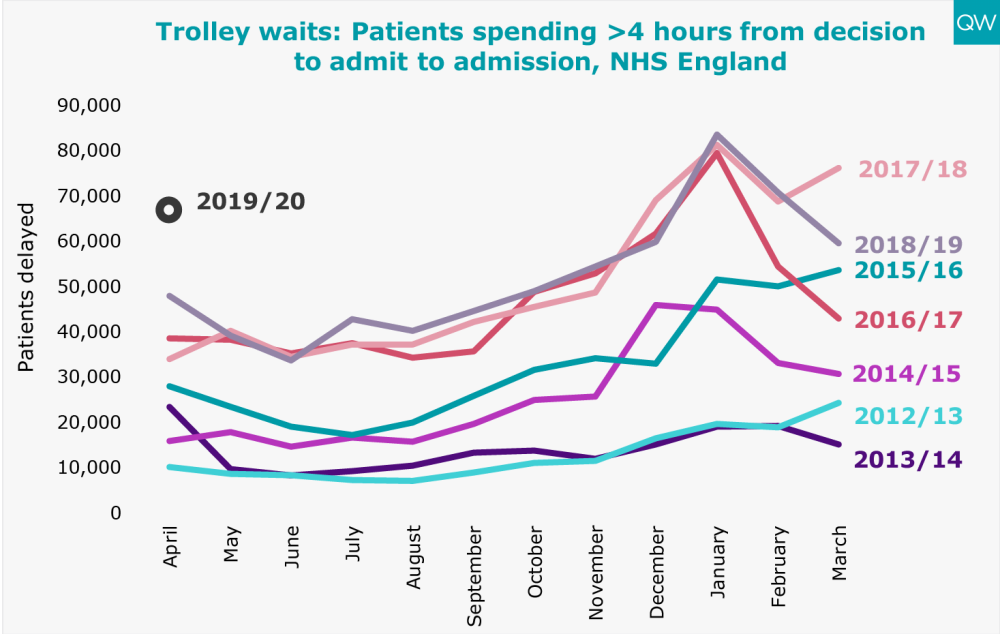
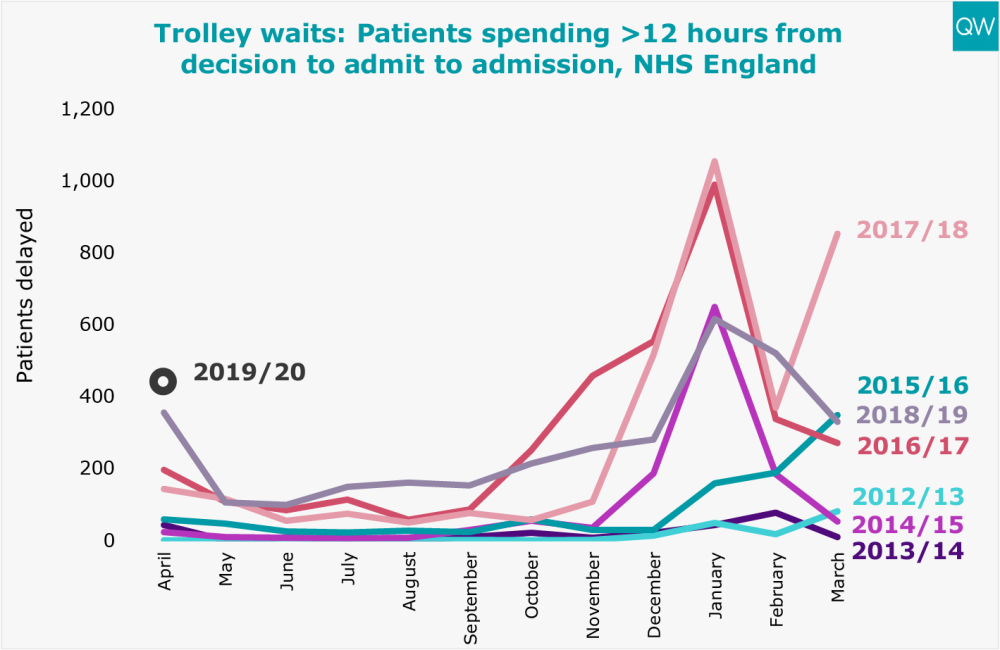
- 66,938 patients spent more than 4 hours waiting on a trolley from decision to admit to admission in April 2019. This is almost 40% higher than April of last year. In April 2019, 442 patients had a trolley wait of over 12 hours, which is almost 25% higher than the same month last year.
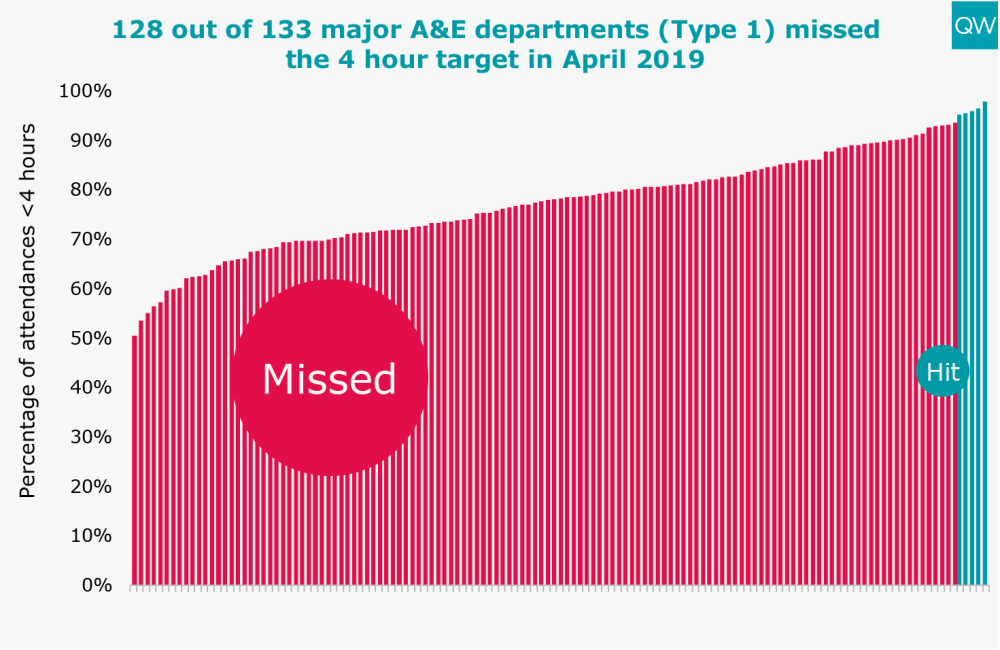
- Only five out of 133 major A&E departments met the four-hour A&E waiting time target in April 2019.
Treatment and diagnostic test waiting times
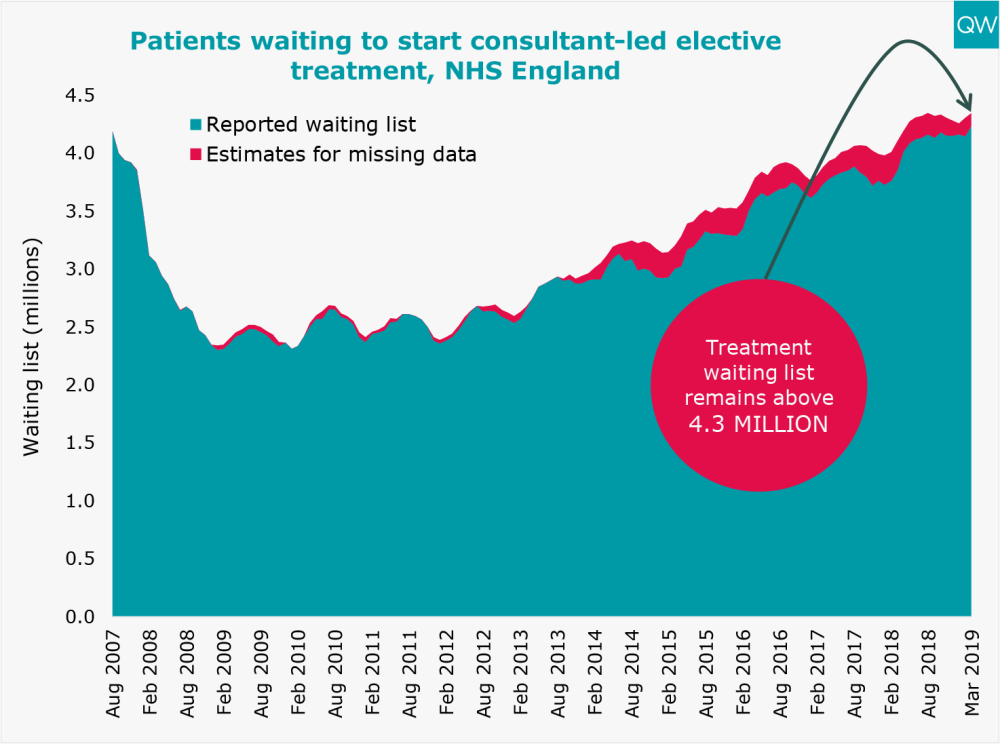
- The total number of people waiting to start consultant-led elective treatment remained above 4.3 million in March 2019.
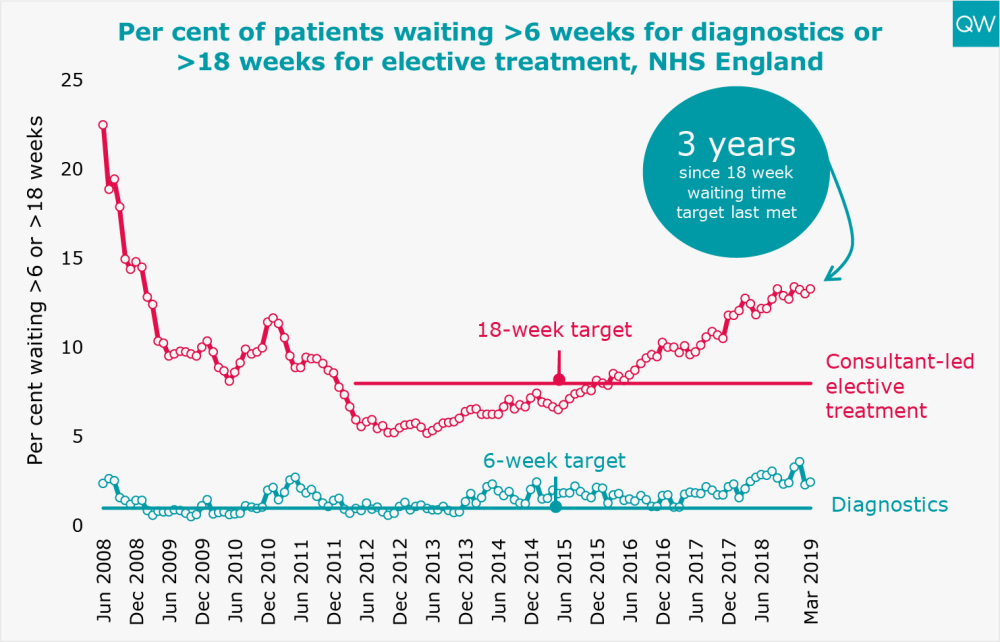
- The proportion of people waiting over 18 weeks to start elective treatment reached 13.3% in March 2019. It has been over three years since the referral-to-treatment target was last met.
- In March 2019, 2.5% of patients had been waiting over 6 weeks for a diagnostic test, which is 0.4 percentage points higher than in March 2018.
Delayed transfers of care
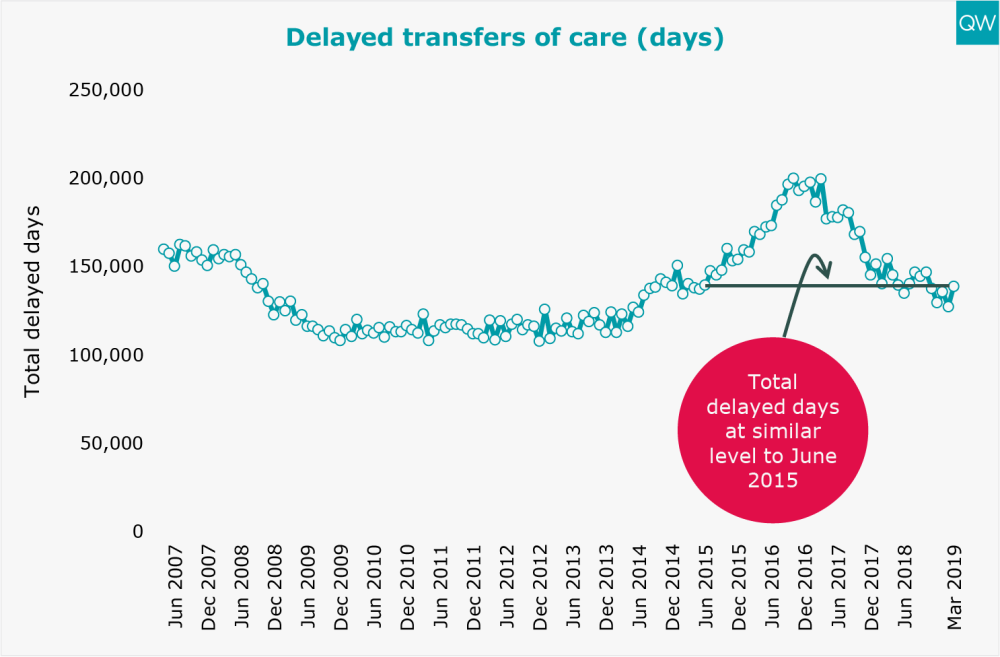
- The total number of delayed transfer of care days increased slightly to 138,831 in March 2019, which is almost the same as it was in June 2015.
Cancer waiting times
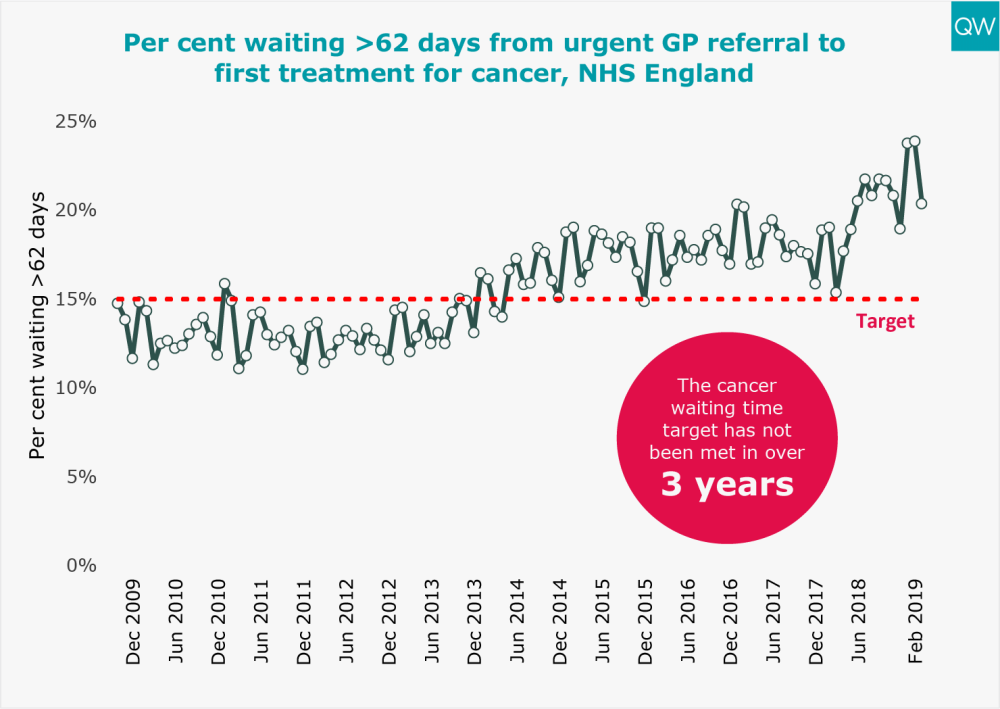
- In March 2019, 20.3% of patients waited longer than two months to start their first treatment for cancer following an urgent GP referral. This is a 3.5 percentage point decrease on the previous month but 5 percentage points higher than in March 2018.
- The 62-day cancer target was last met over three years ago.