Today, NHS England published its Combined Performance Summary, which provides data on key performance measures for November and December of last year. SitRep data for the first week of 2019 was also released, giving a more up-to-date analysis of how the NHS is coping this winter.
Here we show some of these statistics and how they compare with previous years.
For interactive charts showing the quality of health and social care over time, please refer to our 200+ indicators.
A&E
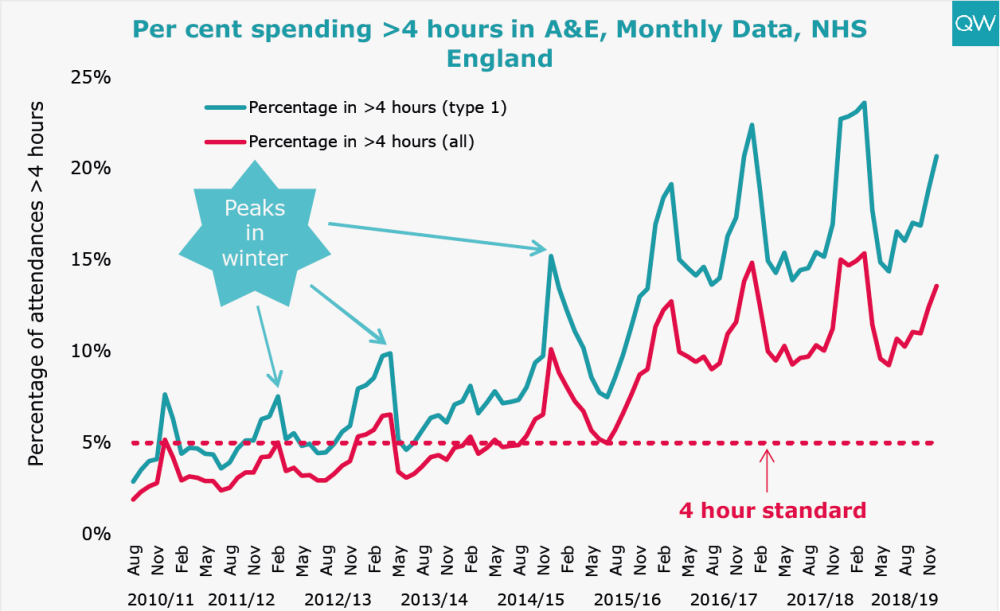
- In December 2018, 13.6% of people attending A&E spent more than 4 hours from arrival to admission, transfer or discharge. This is lower than it was for the last two Decembers, but over 2 ½ times as high as it was five years ago.
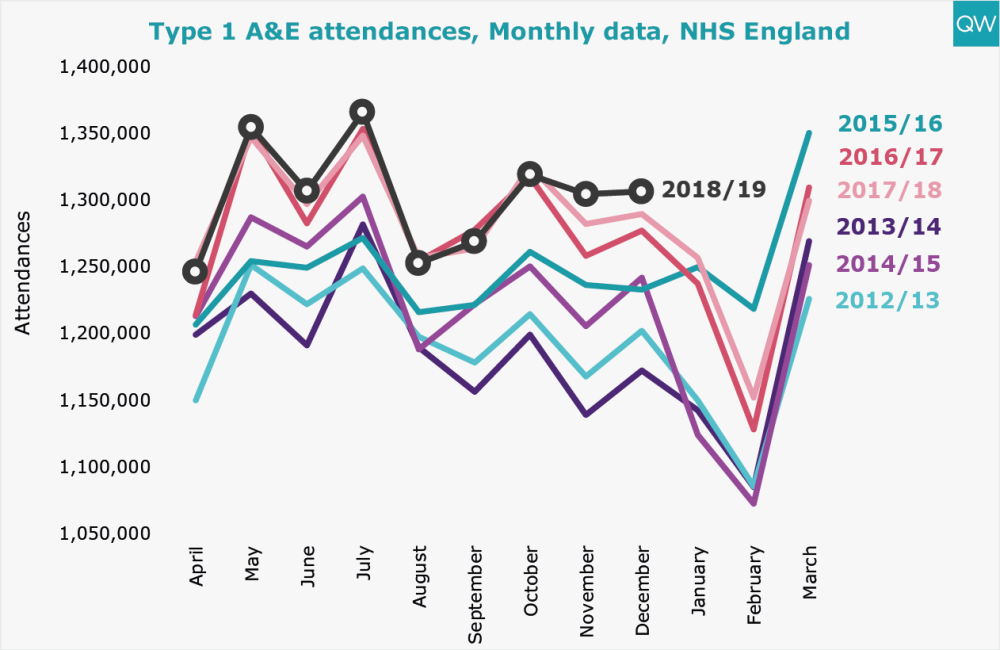
- Attendances in major A&E departments (Type 1) surpassed 1.3 million in December 2018, which is 1.3% higher than in December 2017.
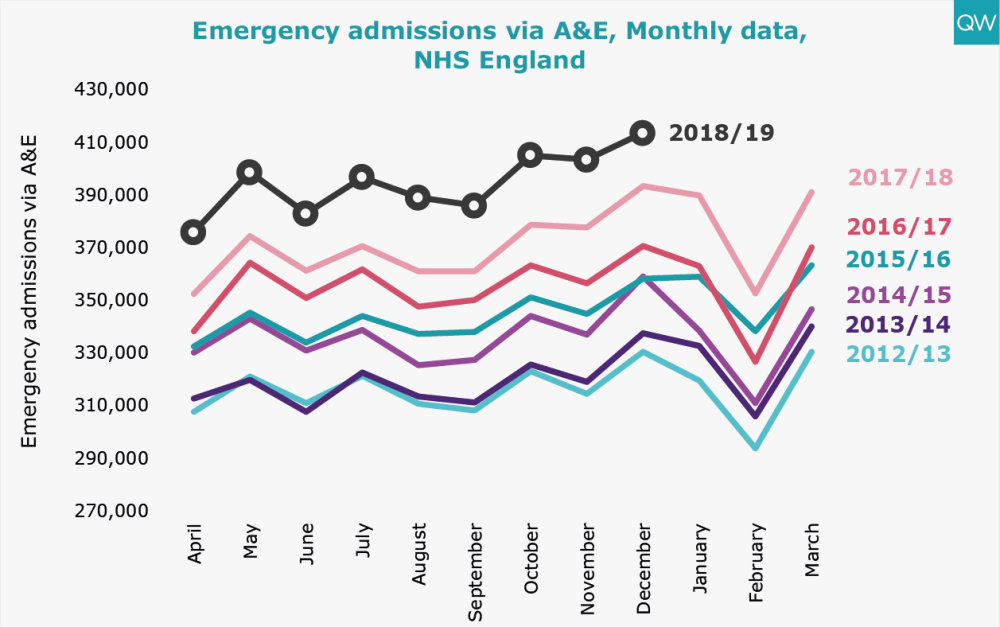
- Emergency admissions via A&E have been increasing year-on-year, reaching over 413,000 in December 2018. This is 5% higher than the same month last year.
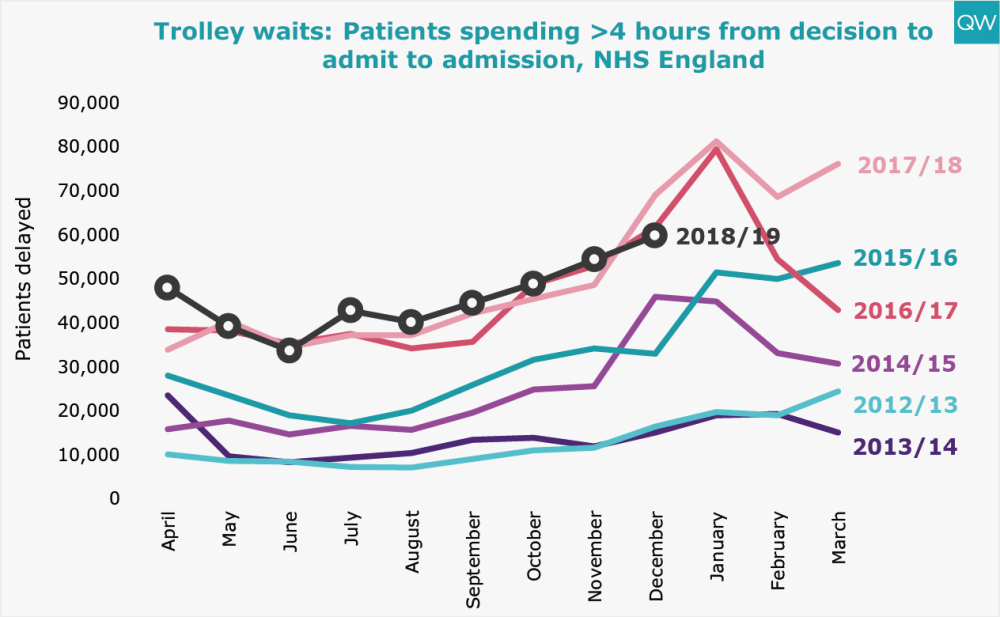
- 59,803 patients spent more than 4 hours waiting on a trolley from decision to admit to admission in December 2018. This is 13% lower than for December last year, but almost 4 times as high as it was five years ago.
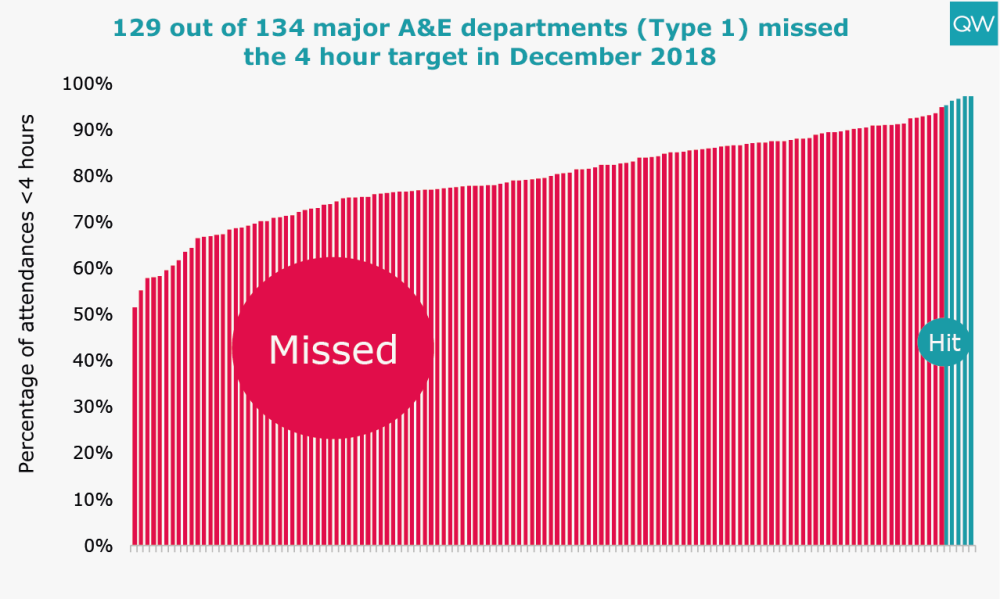
- Only five out of 134 major A&E departments met the four-hour A&E waiting time target in December 2018.
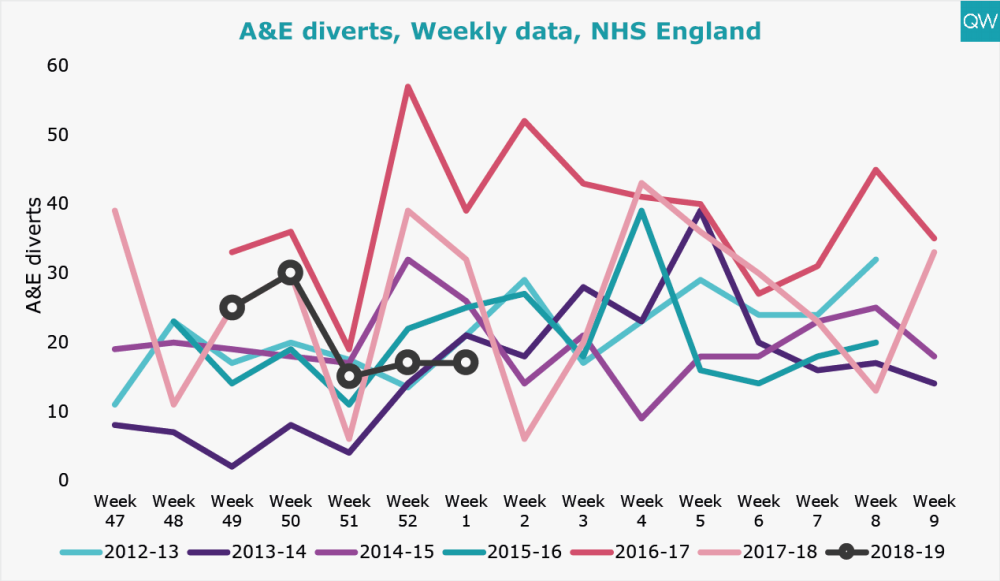
- The number of A&E diverts vary considerably week-by-week; however, during the 1st week of 2019 there were 17 diverts, which is the lowest it has been for the corresponding week of the last six years.
Ambulance
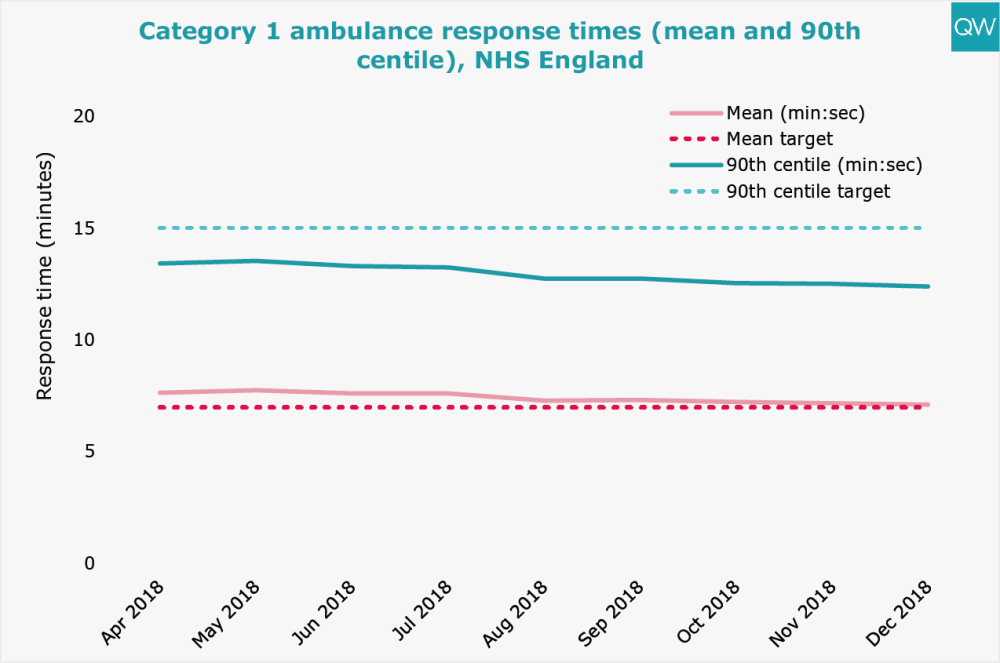
- The average ambulance response time for Category 1 (life-threatening) calls decreased slightly to 7 minutes 6 seconds in December 2018. The 90th centile response time was 12 minutes 24 seconds.
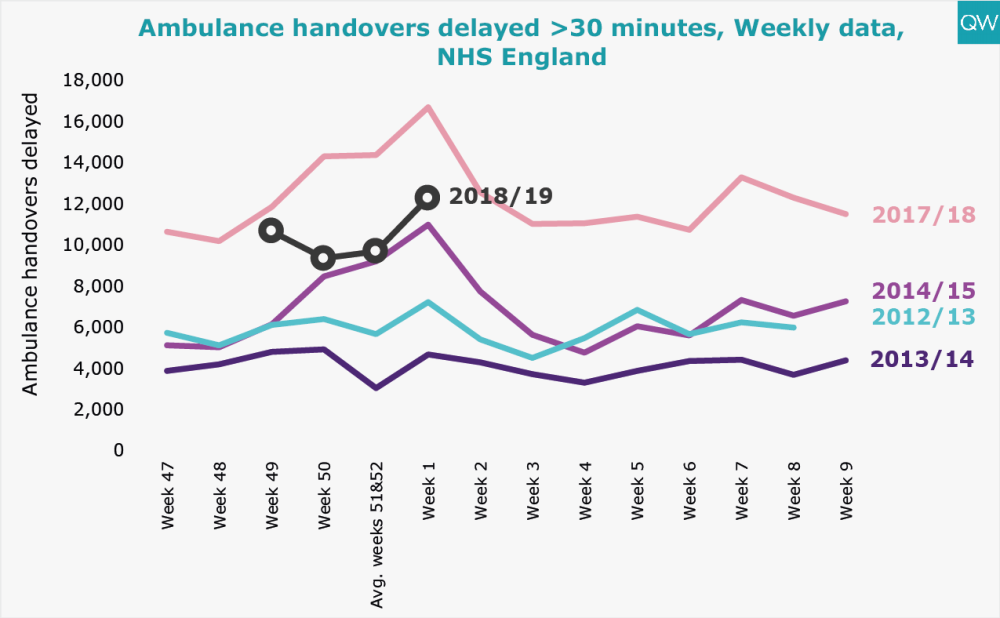
- In Week 1 of 2019 (commencing December 31st 2018), 12,285 ambulances experienced a handover delay of over 30 minutes. This is 26% lower than Week 1 of 2018 but over 2 ½ times as high as Week 1 of 2013.
Bed occupancy
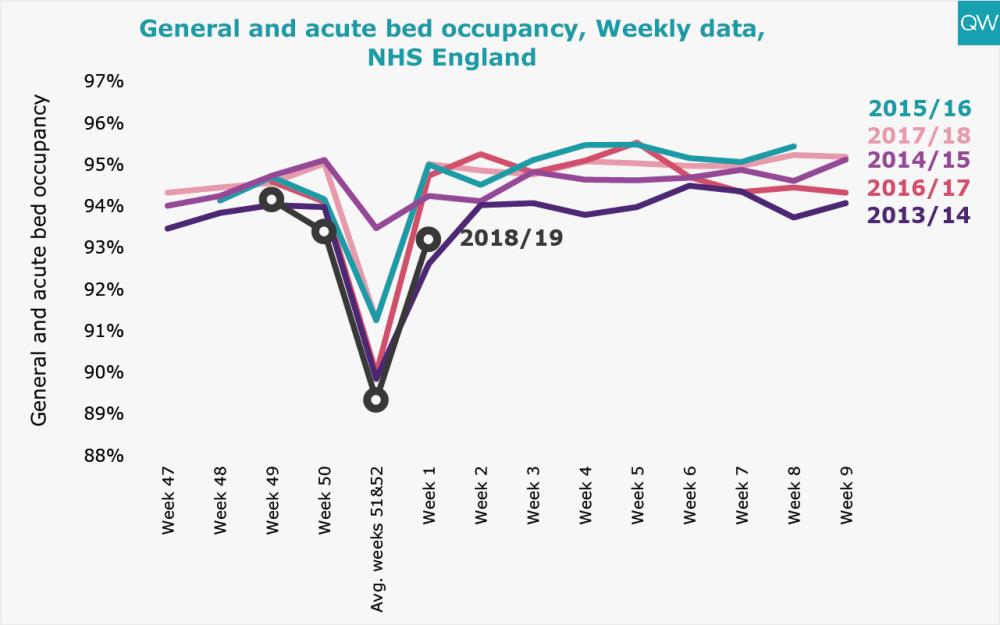
- General and acute bed occupancy was 93.2% in Week 1 of 2019. This is slightly lower (<2%) than Week 1 of the last four consecutive years.
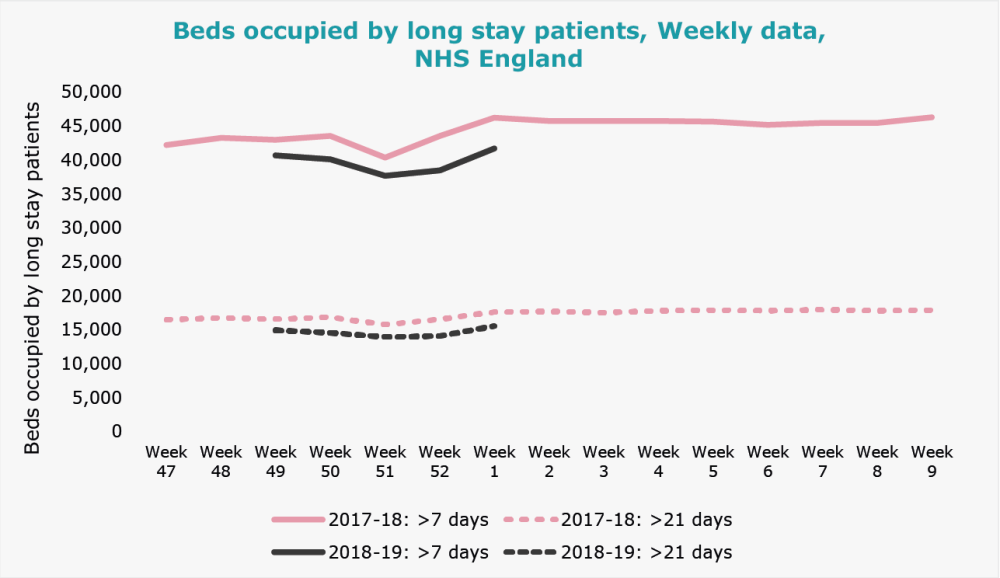
- In Week 1 of 2019, there was an average of 15,564 hospital beds occupied by long-stay patients (>21 days) per day. This is 12% lower than the 1st week of 2018.
Treatment and diagnostic test waiting times
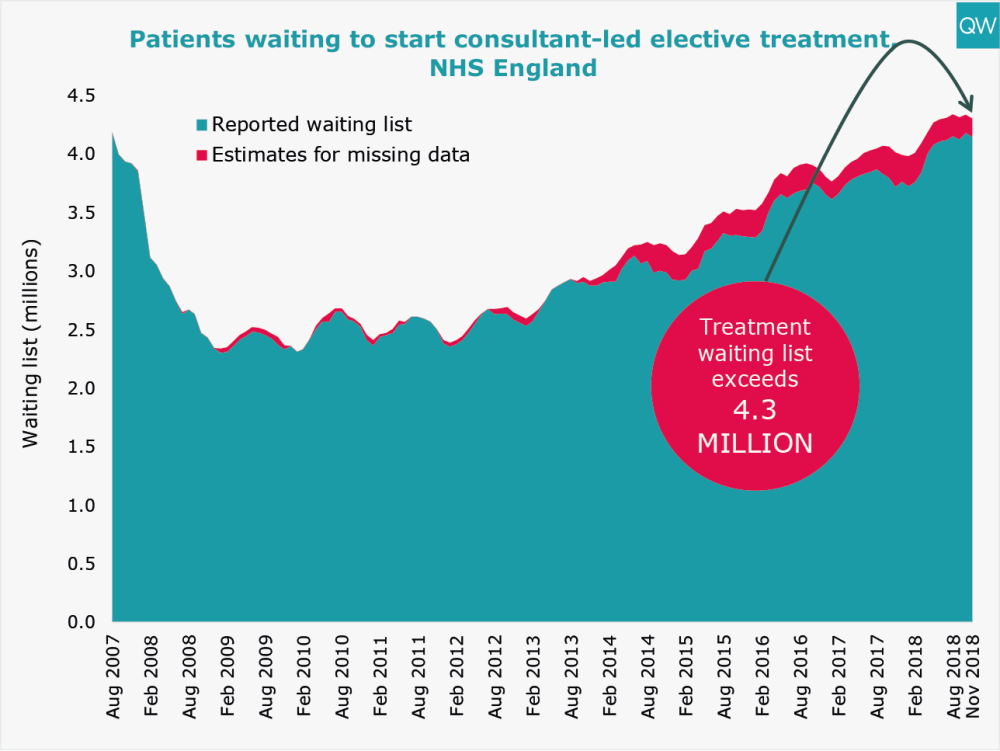
- The total number of people waiting to start consultant-led elective treatment remained at 4.3 million in November 2018.
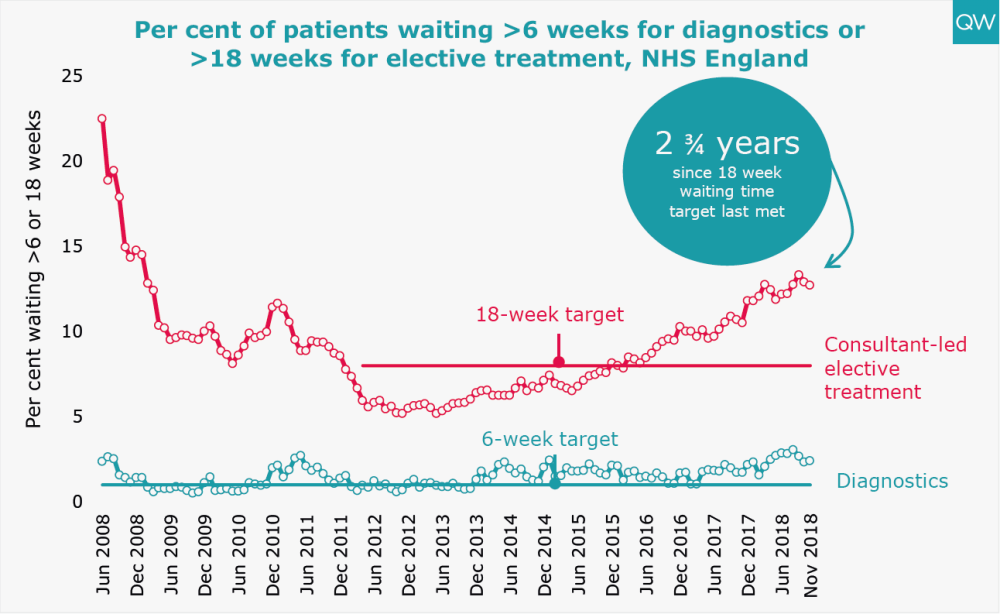
- The proportion of people waiting over 18 weeks to start elective treatment reached 12.7% in November 2018. The referral-to-treatment target has not been met since February 2016.
- 2,432 people had been waiting over 52 weeks to start elective treatment in November 2018, which is almost 70% higher than in November 2017.
- In November 2018, 2.4% of patients had been waiting over 6 weeks for a diagnostic test. This is 38% higher than it was the previous November.
Delayed transfers of care
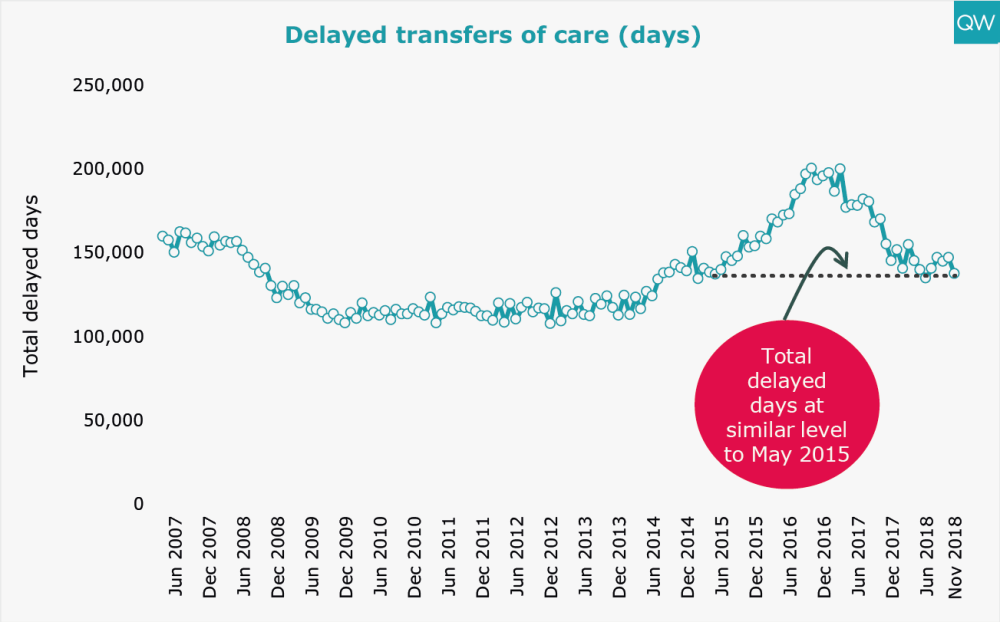
- The total number of delayed transfer of care days decreased to 137,388 in November 2018, which is 11% lower than in November 2017, but 17% higher than it was five years ago.
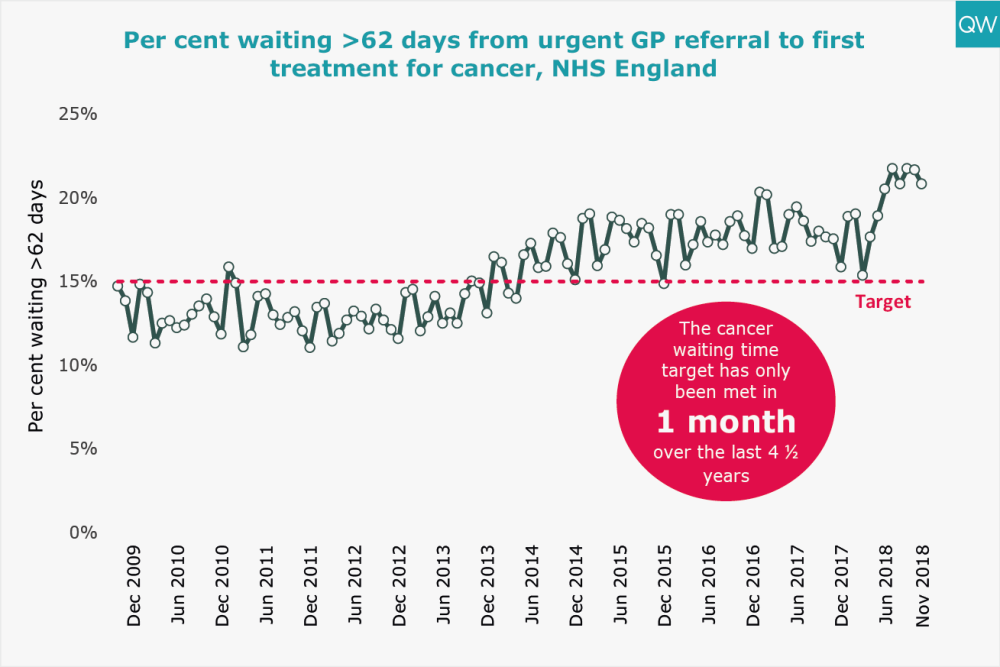
Cancer waiting times
- In November 2018, 20.8% of patients had been waiting longer than two months to start their first treatment for cancer following a GP urgent referral.
- The 62-day cancer target has only been met in one month over the last 4 ½ years.
- Alongside this there has been an increase in the number of cancer cases being urgently referred each month, from 7,913 in November 2009 to 13,856 in November 2018.