
The NHS is in the most serious crisis in its recent history. The long-term failure to train, recruit and retain a sufficient number of health care staff is cited as one of the causes of poorer patient access, ballooning waiting lists and delayed treatment times.
But on the face of it, the NHS has more funding and more staff than ever before. In this blog, we look at the trends of staff working in different services, professions and regions, and outline the possible explanations as to why patients are not reaping the benefits of an increased NHS workforce.
Overall trend in staff
Currently there are over 1,410,000 directly employed staff working in NHS hospital and community services in England, around a further 212,000 in general practice and more still working as, for example, outsourced workers in the NHS. Staff costs make up around two-thirds of NHS expenditure, and have – across NHS and foundation trusts – doubled in cash terms to £67 billion in 2020/21 relative to 2008/09 (1.6 times higher in real terms).
The number of NHS staff in England has increased substantially since 2014, with over a quarter of a million (26%) more working in hospital and community health services in November 2022 compared to eight years prior, and over 36,000 (29%) more working in general practice. Much of this increase has occurred in the latter half of this period (see the darker blue bars in the chart below). The expansion of the NHS workforce between 1998 and 2022 has also exceeded the increase to population need over the same period, growing by 62% compared to a 28% increase in the needs-adjusted population. But overarching trends rarely tell the whole story.
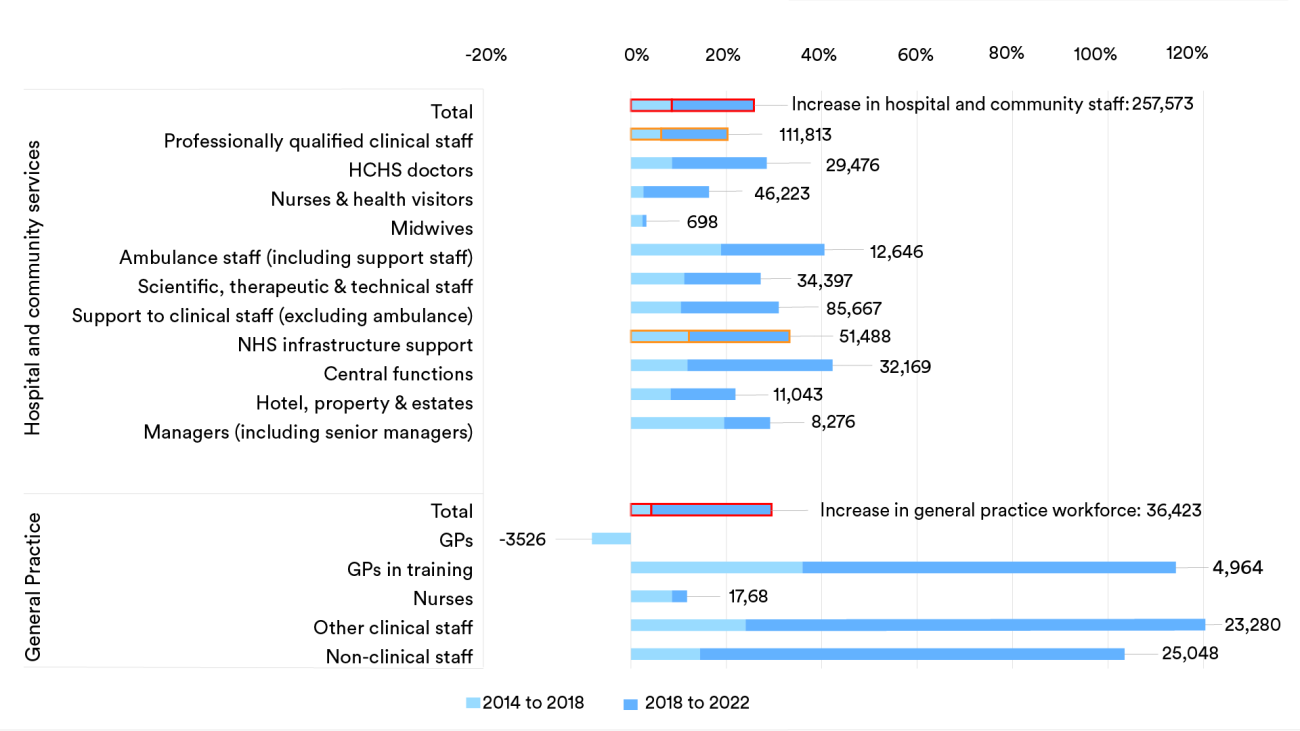
What do staffing levels look like when accounting for vacancies and sickness?
Despite increasing staff numbers, the published vacancy data – which describe how many posts remain unfilled by permanent or fixed term staff – stood at 8.9% (124,000) in December 2022. It had fallen since June 2022 (9.6%, 130,800), but remained above pre-pandemic levels (88,300, 8.1% in March 2020). Although we don’t have an indication of how many of these posts are filled by temporary staff overall, piecemeal data suggest that around one-in-five nursing vacancies remain unfilled.
There are also gaps in the workforce when staff take unplanned time off due to illness or emergency. Sickness absence, in particular, increased during the peaks of Covid-19, and remained at higher levels in December 2022 than before the pandemic. Again, taking nurses as an example (as captured within the grey and orange bars in the chart below), this means there are a greater number of nurses off work whose roles need to be filled.
What about differences between services and professions?
The overall trend hides significant variation between different services. Since 2014, growth has been much larger in children’s and adult nursing whereas the number of learning disability nurses has fallen by 21%. Similarly, with doctors, the number of hospital specialists has increased by 25% since 2015, while the number of fully qualified GPs has fallen by 6%.
Not only this, but there has been a shift in the different types of staff that make up a service. For example, in general practice, large increases in numbers are due to qualified staff (excluding GPs) and administrative roles. In 2015, there was one clinical professional (including trainee GPs) to every one fully qualified GP – in 2022, the ratio stood at two clinical professionals to every one GP. These changes have predominantly happened since 2019, highlighting how rapid the shift in the mix of staff has taken place. This timing and trend aligns with the introduction of the Additional Roles Reimbursement Scheme (ARRS), which is still supporting the recruitment of health professionals in general practice – such as physiotherapists, pharmacists, and therapists – as one of the government’s workforce priorities.
There have also been large differences in the scale of increases in other settings and staff groups. Since 2014, the number of ambulance staff and (non-clinical) central functions staff have increased by over 40%, whereas there has been a far smaller increase in the number of nurses (16%) and midwives (3%). And, as ever, there has been an uneven increase in staff when looking between regions – with the increase in hospital and community services staff ranging from 16% in the North East and Yorkshire to 31% in London.
Why might patients and the public not be experiencing the benefits of more NHS staff?
Despite seeing sizeable overall increases to the number of NHS staff, it’s been pointed out that, for example, the NHS is actually treating fewer patients from the waiting list and access to general practice remains a problem. Several unanswered questions remain as to why this is the case:
- Have staff increases resulted in an optimal mix of different roles? The make-up of staff has likely been influenced in part by specific funding allocated to boost the number of nurses and allied health professionals.
- Have national policies resulted in a sufficiently distributed workforce to tackle patient need? We have highlighted a few areas where – at least in the case of absolute staffing numbers – some settings and groups have benefitted disproportionately.
- Have the ‘costs’ of onboarding new staff been accounted for?
- Has high staff turnover had an effect in terms of causing disruption and loss of experience? Despite seeing net growth in the NHS workforce overall, this coincided with a peak in the number of experienced staff leaving their role (with nursing being just one example).
- Have higher levels of stress and burnout resulted in higher cases of presenteeism? The latest staff survey results show that the proportion of staff going to work while unwell is back to 2019 levels, having dipped during the years of the Covid-19 pandemic, but the impact remains poorly understood.
- Have the measures in place to increase infection control since Covid-19 impacted on staff efficiency?
- Has the proportion of clinicians’ time spent on direct patient care, as opposed to other tasks, changed?
- Has the availability of resources, such as scanners and beds, affected activity?
More needs to be done to determine whether the NHS has enough staff across different services to meet current and future demand. Staffing levels must be taken into account along with funding and resources available, as well as changes in the complexity of patient problems and wider system challenges, such as delayed hospital discharges into the community. If these factors are not considered alongside the number of staff in post, then it is difficult to see how this will translate into more timely care for patients.
Suggested citation
Rolewicz L (2023) “More, more, more: do we have more NHS staff than ever before?”, Nuffield Trust blog.