
Headlines
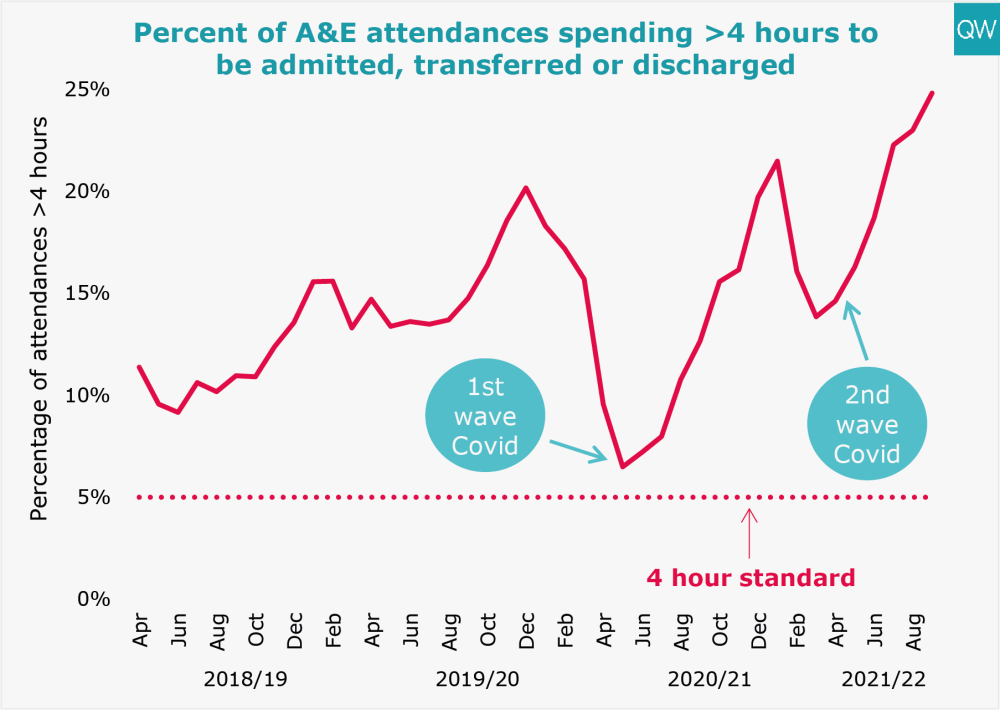
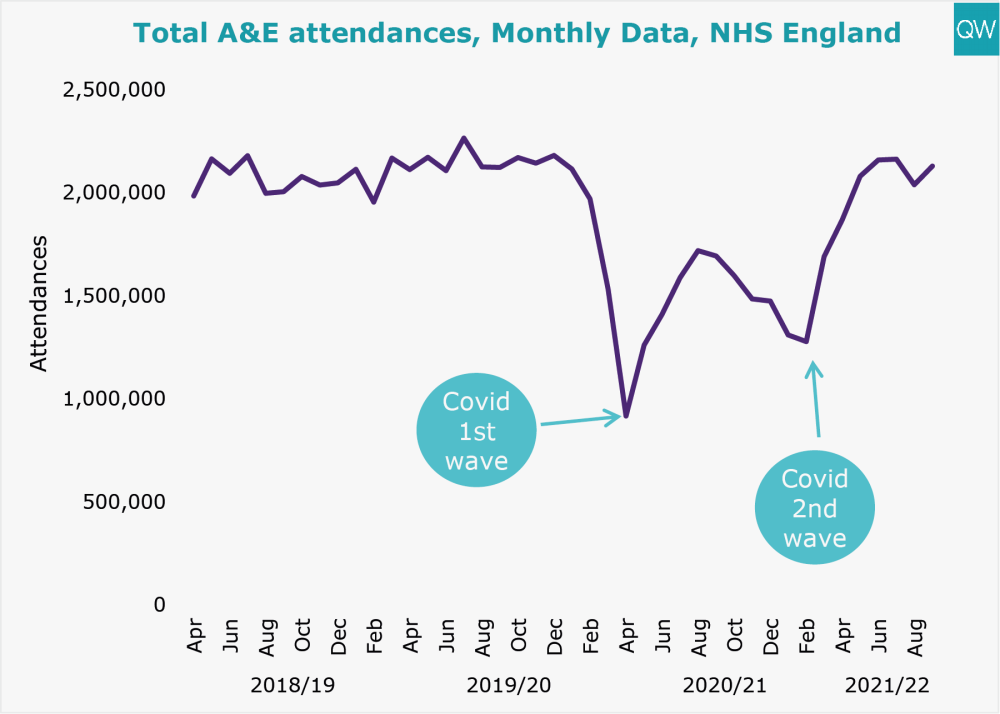
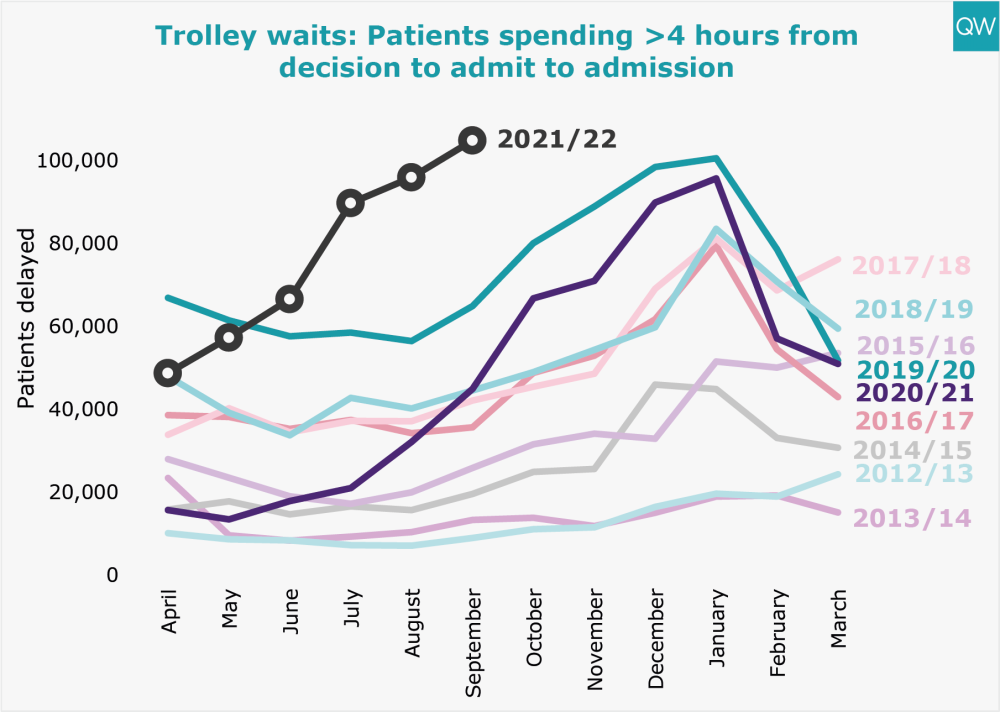
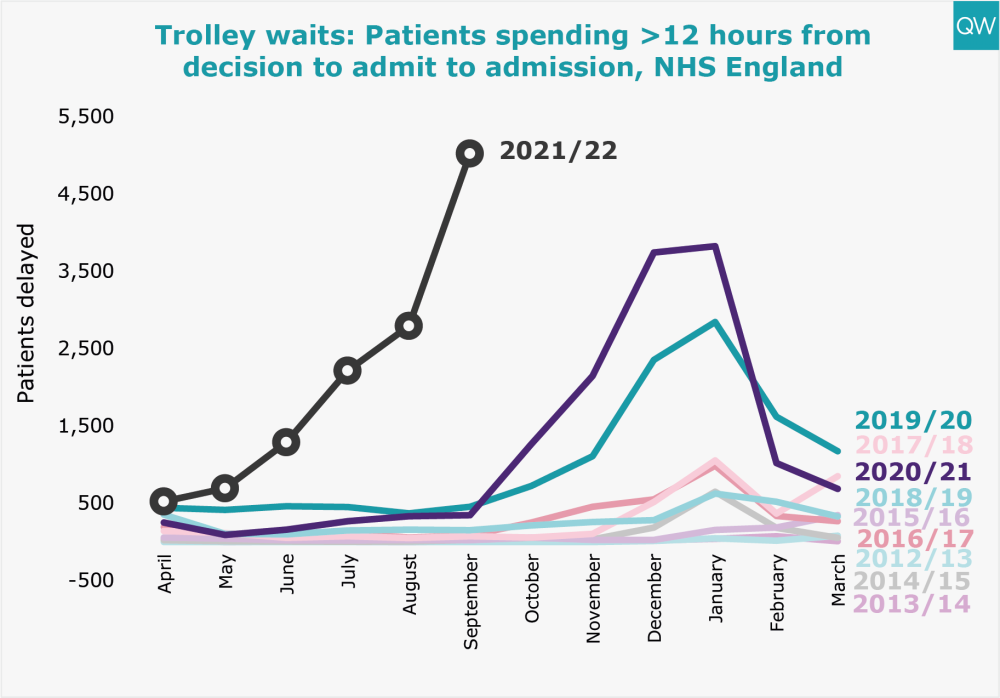
- A&E waiting times in September were the worst since records began, with 1 in 4 patients waiting longer than four hours to be admitted, transferred or discharged. Attendances are back to pre-pandemic levels, and trolley waits are at record highs for this time of year.
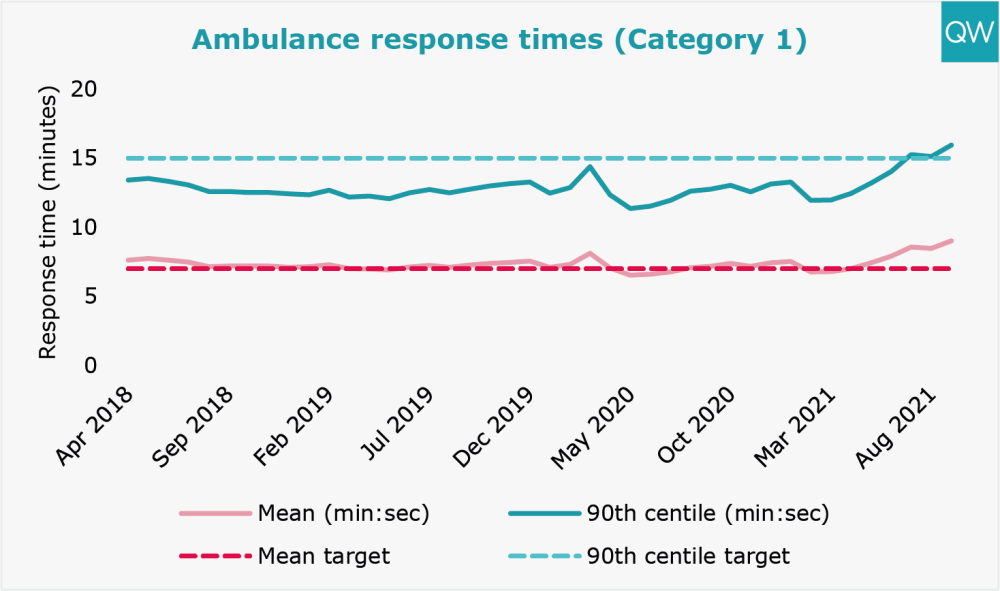
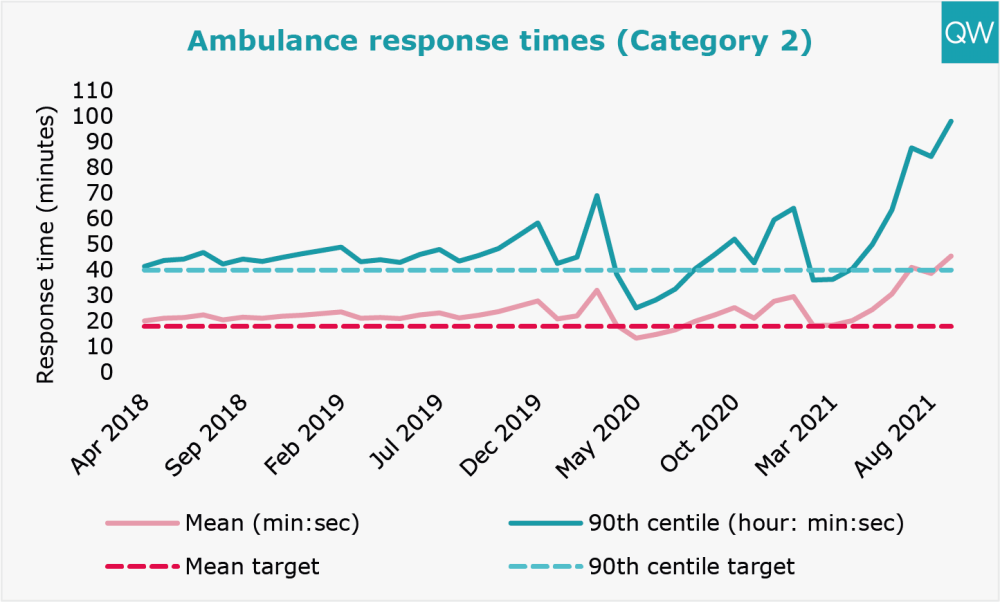
- Ambulance response times worsened in September – the mean response time for Category 2 (emergency) calls increased to 45 minutes, more than double the 18 minute target.
- The waiting list for planned care continued to grow to over 5.7 million in August, and the number of two year waiters increased to 9,754.
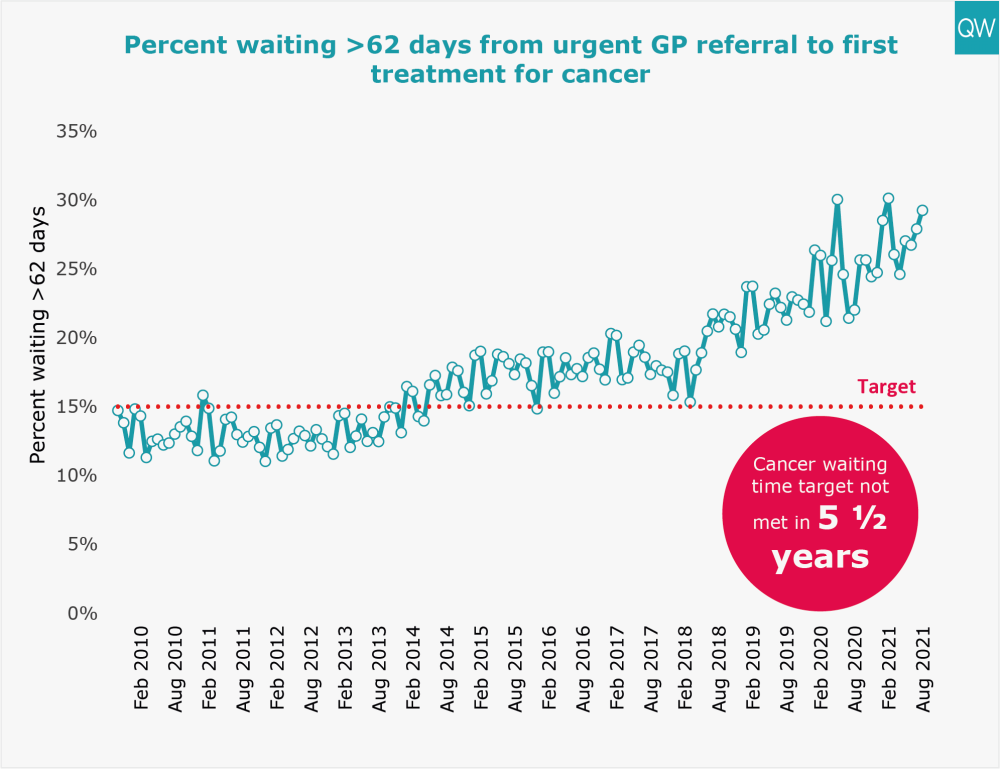
- Almost 30% of patients with an urgent GP referral for suspected cancer waited longer than two months for their first treatment in August.
Today, NHS England published the latest data on key activity and performance measures for August and September of this year. Here we show the performance against some key targets, including those set out in the 2021/22 operational planning guidance published in September.
Planned (elective) and diagnostic care
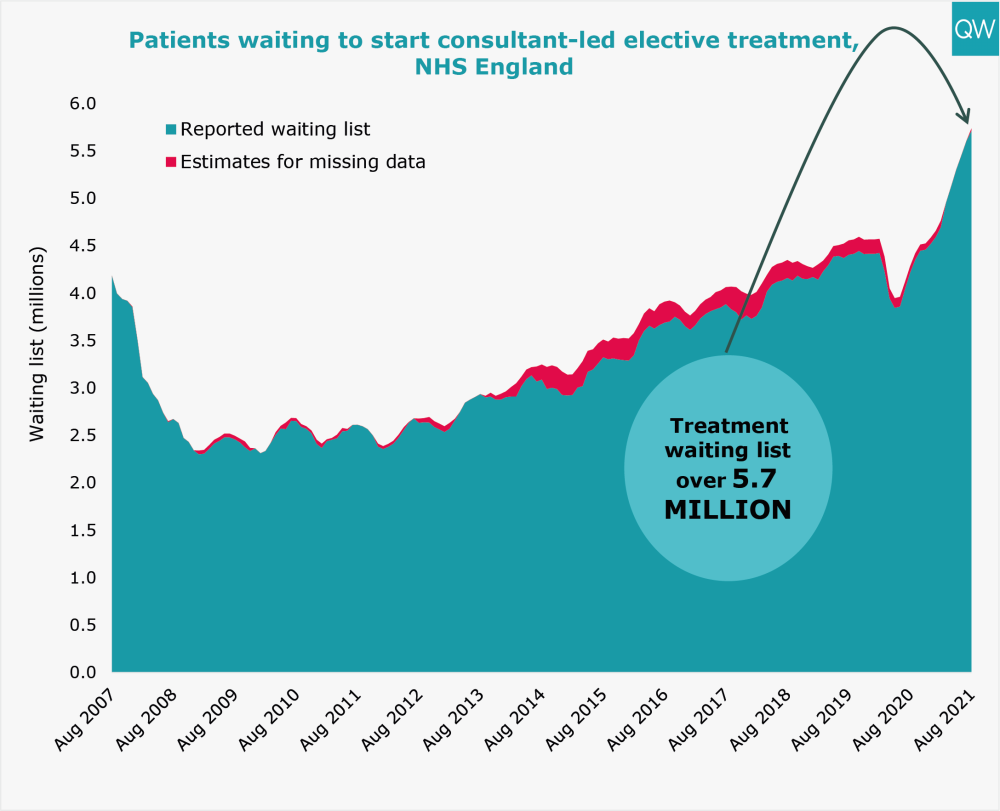
- The total number of people waiting to start consultant-led elective treatment increased to over 5.7 million in August 2021, the highest level since records began.
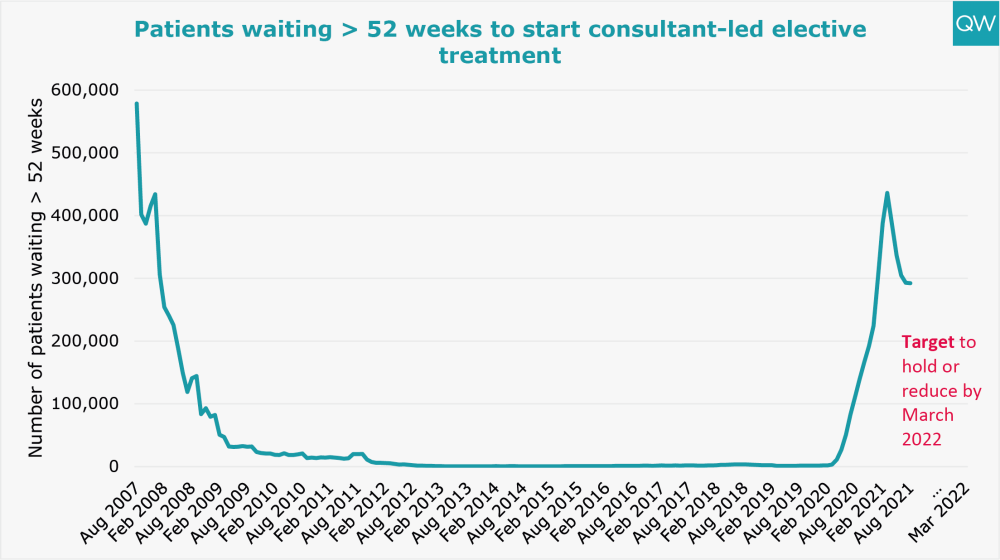
- The number of people waiting over 52 weeks to start elective treatment fell slightly in August 2021 to 292,138, but remains significantly higher than in August 2019 when there were 1,236 people.
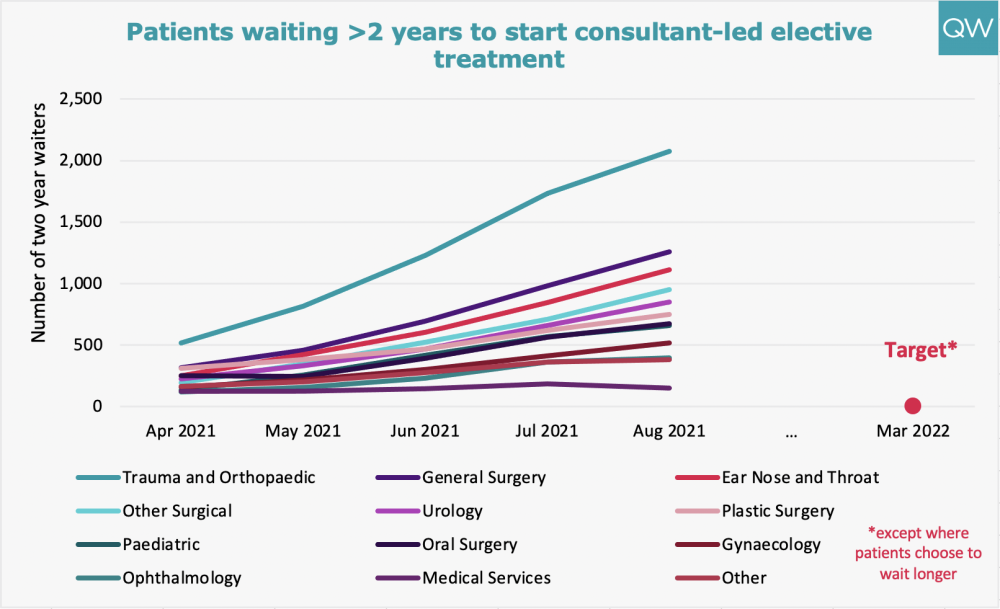
- The number of people waiting over two-years increased to 9,754. The specialities with the highest number of long-waiters were trauma and orthopaedics; general surgery; and ear, nose and throat.
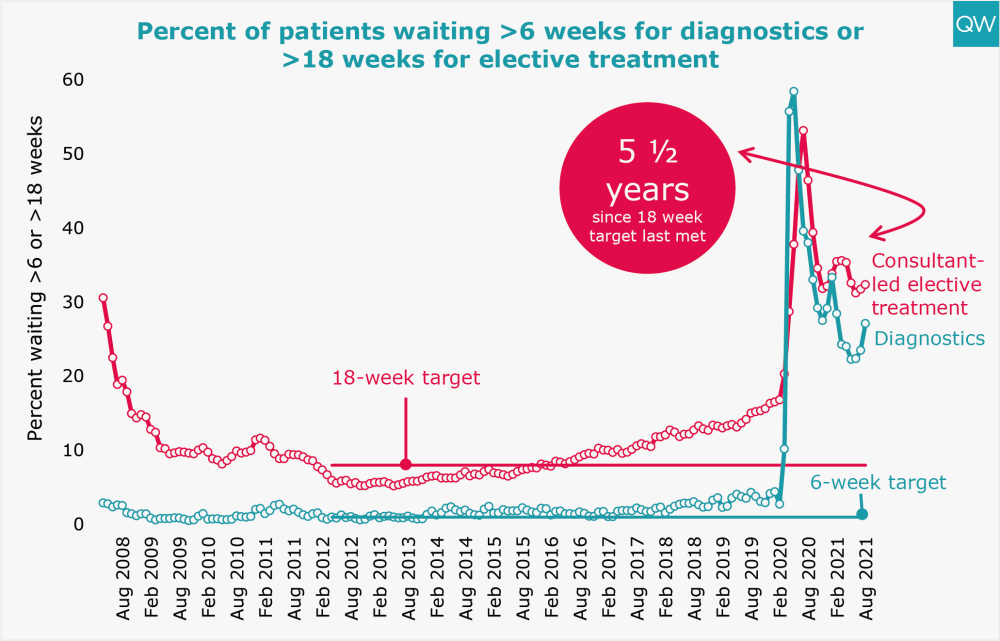
- Almost a third of patients (32%) had been waiting over 18 weeks to start elective treatment in August 2021.
- Over one in four patients (27%) had been waiting over six weeks for a diagnostic test in August 2021.
Planned (elective) and diagnostic care
- The total number of people waiting to start consultant-led elective treatment increased to over 5.7 million in August 2021, the highest level since records began.
- The number of people waiting over 52 weeks to start elective treatment fell slightly in August 2021 to 292,138, but remains significantly higher than in August 2019 when there were 1,236 people.
- The number of people waiting over two-years increased to 9,754. The specialities with the highest number of long-waiters were trauma and orthopaedics; general surgery; and ear, nose and throat.
- Almost a third of patients (32%) had been waiting over 18 weeks to start elective treatment in August 2021.
- Over one in four patients (27%) had been waiting over six weeks for a diagnostic test in August 2021.
For more information, see our treatment waiting times and diagnostic test waiting times indicators.
Accident and Emergency
- In September 2021, 25% of people attending A&E spent more than four hours from arrival to admission, transfer or discharge, the worst performance since records began.
- There were over 2.1 million A&E attendances in September 2021 – 0.3% higher than pre-pandemic levels in September 2019.
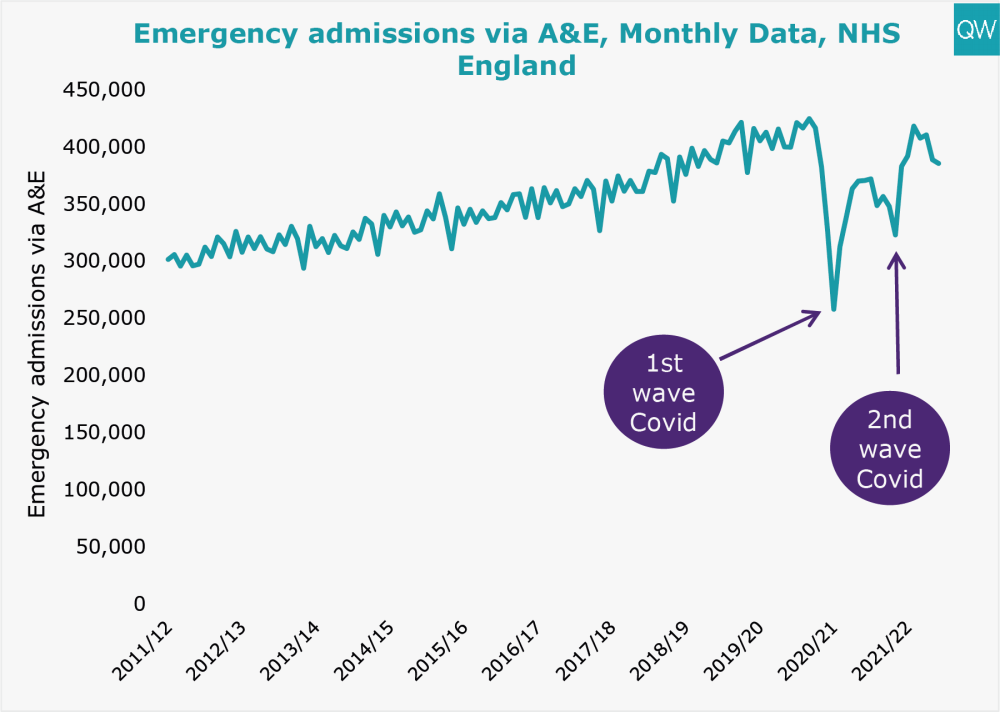
- In September 2021, emergency admissions to hospital via A&E decreased on the previous month to 385,554 – 4% lower than pre-pandemic levels in September 2019.
- 104,875 patients spent more than four hours waiting on a trolley from a decision to admit to admission in September 2021, the highest number for any September since records began. 5,025 people had a trolley wait of over 12 hours.
For more information, see our A&E waiting times indicator.
Cancer waiting times
- In August 2021, 29% of patients waited longer than two months to start their first treatment following an urgent GP referral for suspected cancer.
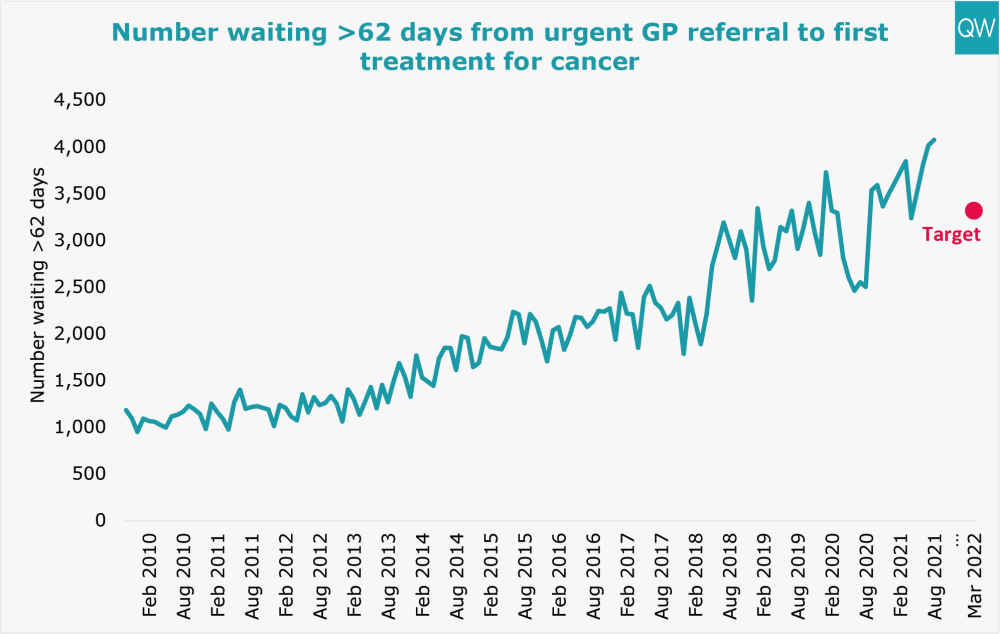
- 4,075 patients started their first treatment more than two months following an urgent GP referral, an increase on the previous month and further away from the March 2022 target of 3,316 patients.
For more information, see our cancer waiting time targets indicator.
Ambulance response times
- In September 2021, the average response time for Category 1 (life-threatening) ambulance incidents worsened to 9 minutes 1 second (mean target of 7 minutes).
- The average response time for Category 2 (emergency) incidents increased to 45 minutes 30 seconds in September 2021 (mean target of 18 minutes). The 90th centile reached 1 hour 38 minutes, surpassing the target of 40 minutes.
For more information, see our ambulance response times indicator.
About this data
During this unprecedented time for the health service, QualityWatch continues to provide independent scrutiny of the health and social care system as far as possible. The most recent data published today reflects changes in access and service use as a result of the coronavirus (Covid-19) pandemic. In light of these shifts in activity, we have added new charts and changed the presentation of some of our usual charts, to aid interpretation. It is also worth noting that NHS England have suspended data collection for some of their performance statistics, including delayed transfers of care.
In March 2019, the Clinically-Led Review of NHS Access Standards Interim Report was released, proposing some significant changes to many of the targets reported on here. A six-month Progress Report from the NHS Medical Director was also published in October 2019. Field testing of the proposed new standards began in 2019 and NHS England has recently consulted on the recommendations for urgent and emergency care.
For urgent and emergency care, the field test sites have not been submitting four-hour performance data since May 2019. The time series presented here excludes the field testing sites and so is comparable across months and years. For elective care, performance of the field test sites will continue to be included in the national time series, so the data is fully comparable over time.
For interactive charts showing the quality of health and social care over time, please refer to our 200+ indicators.