
Today, NHS England and NHS Digital published the latest data on key activity and performance measures for December of last year and January of this year. Urgent and Emergency Care Daily Situation Reports were also published for the first week of February, giving a more up-to-date analysis of how the NHS is coping this winter. Here we show some of these statistics and how they compare with previous trends.
Urgent care
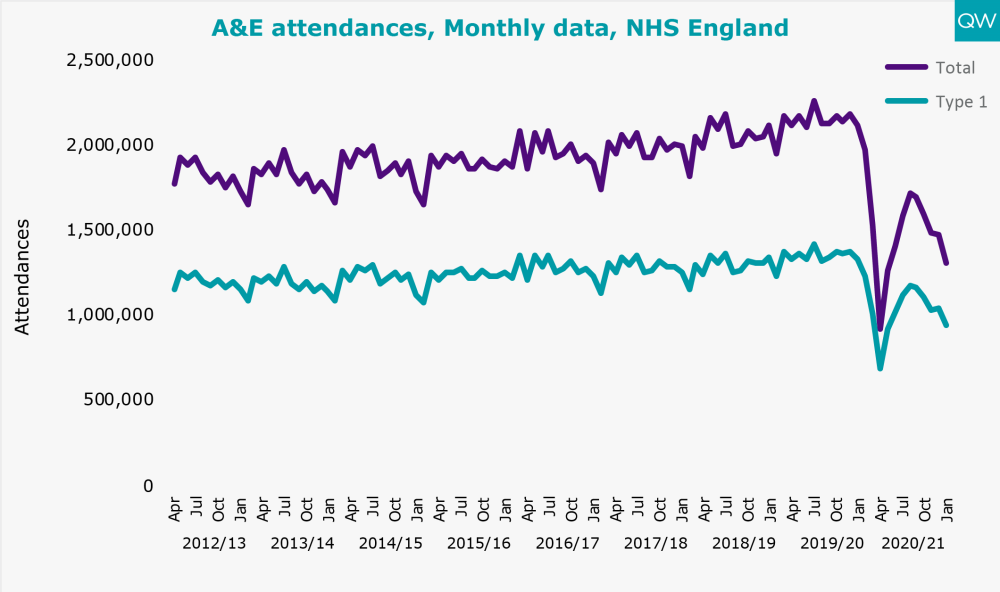
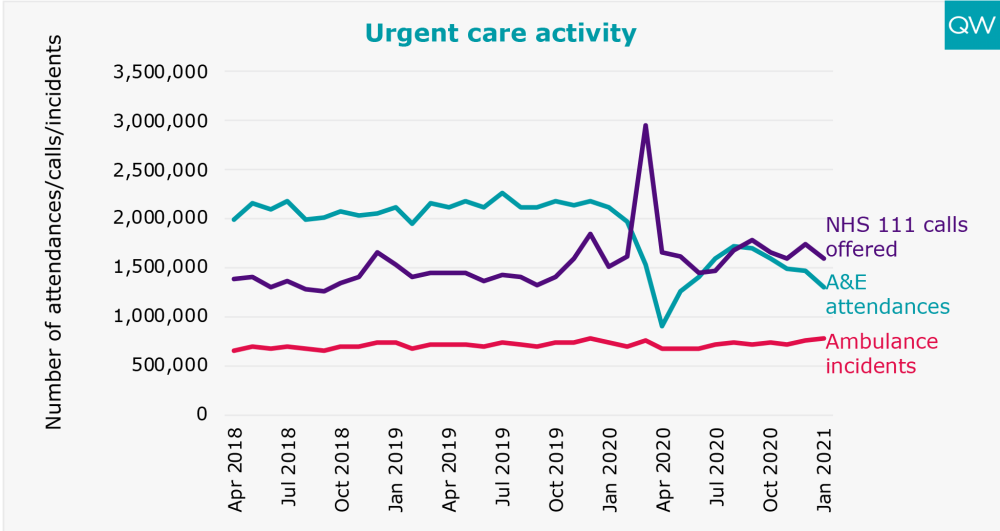
- In January 2021, total A&E attendances fell to 1.3 million – 38% lower than in January 2020. This follows a decrease to 916,581 in April 2020 and a subsequent increase to just over 1.7 million in August 2020. 941,151 attendances in January were to major (type 1) A&E departments.
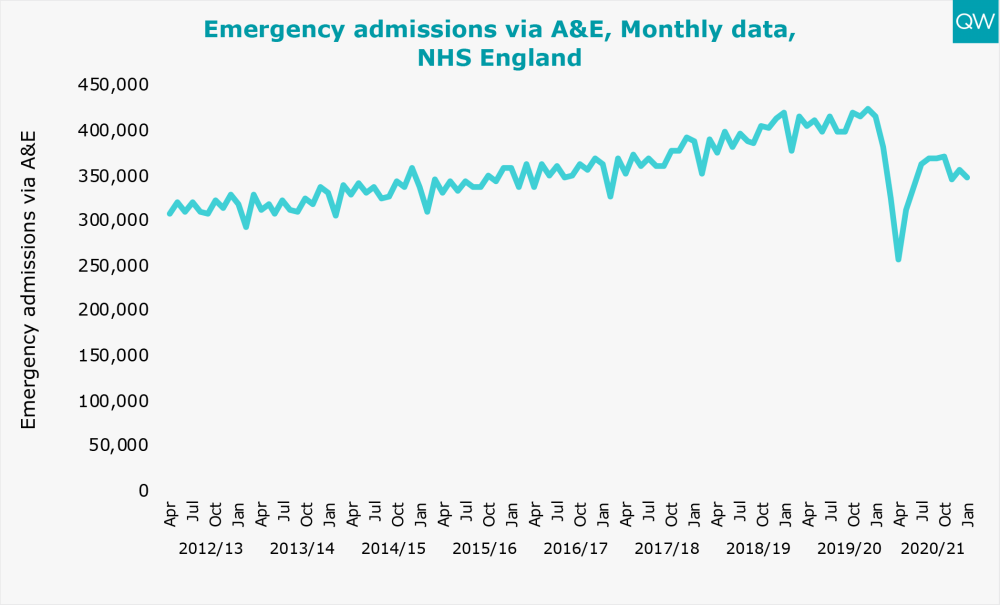
- There were 348,045 emergency admissions via A&E in January 2021 – 16% lower than in January 2020. Emergency admissions via A&E have generally been increasing year-on-year, but fell dramatically in April 2020 to 257,928.
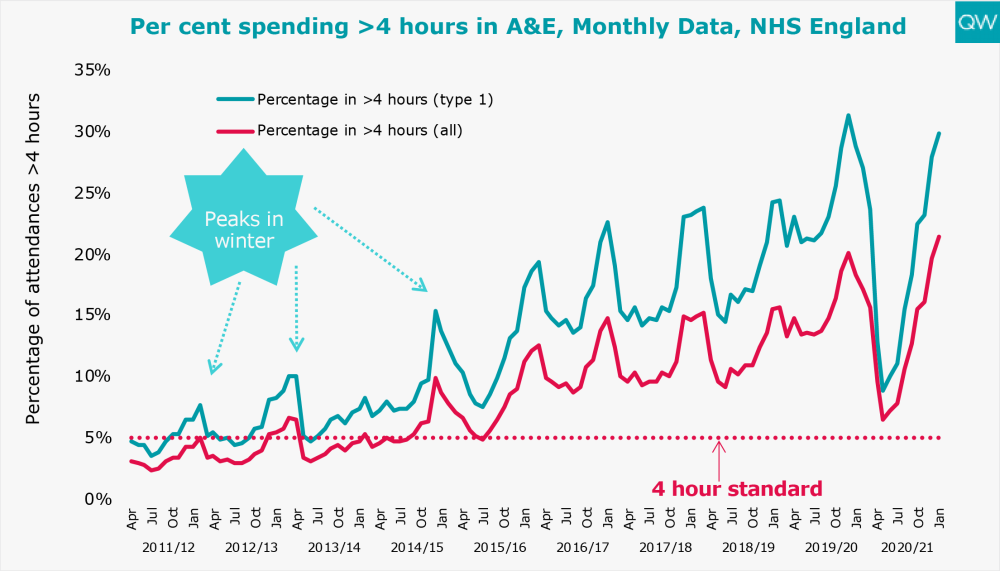
- In January 2021, over one in five people (21%) attending A&E spent more than four hours from arrival to admission, transfer or discharge. Waiting times have worsened for the past eight consecutive months.
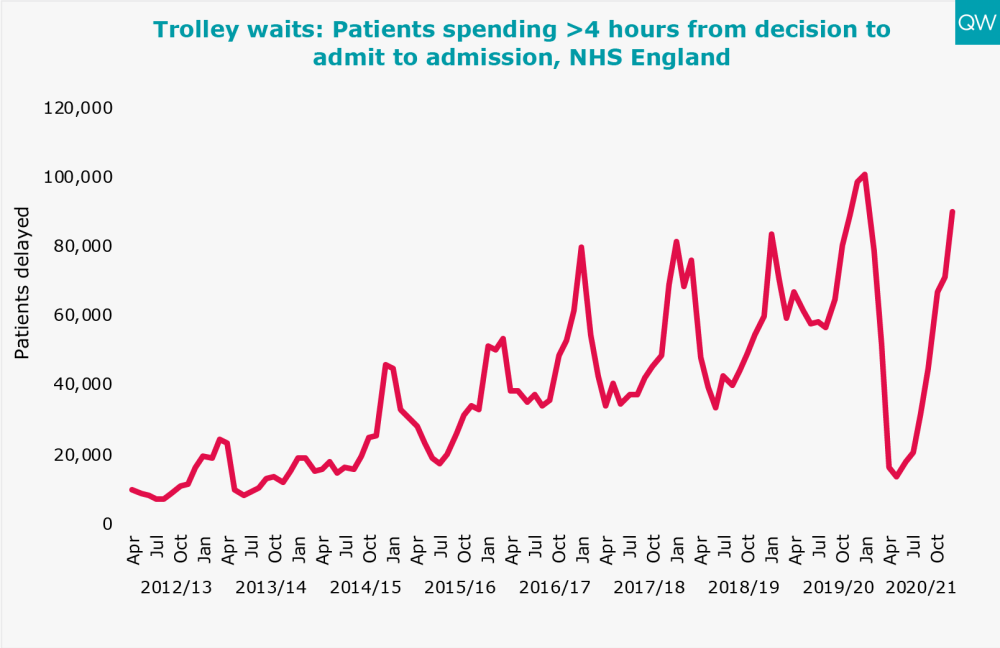
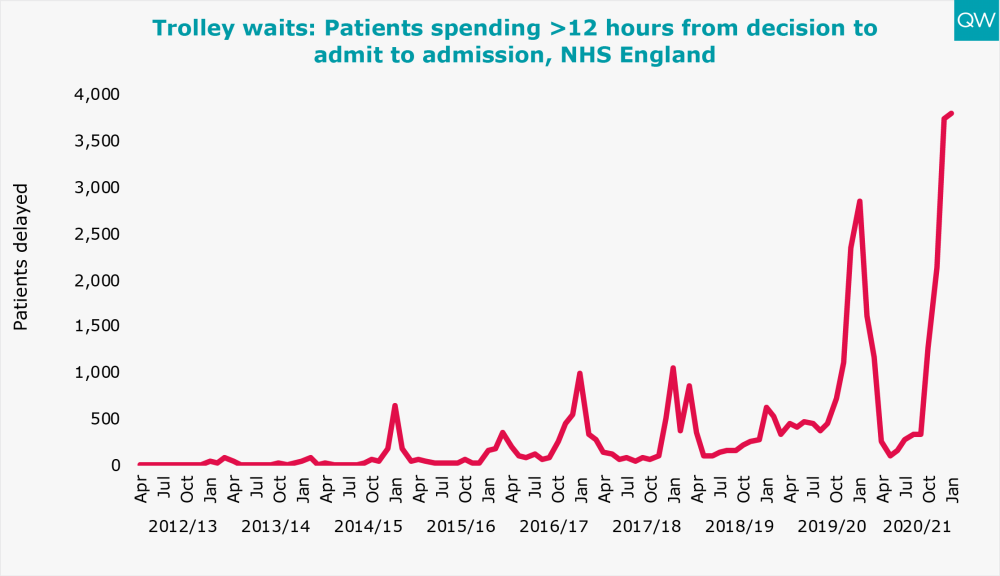
- 94,989 patients spent more than four hours waiting on a trolley from a decision to admit to admission in January 2021 – 6% lower than in January 2020. Trolley waits have been increasing each month since May 2020. 3,809 people had a trolley wait of over 12 hours in January 2021, the highest number since records began.
- There were almost 1.6 million calls made to NHS 111 in January 2021, 6% lower than in January 2020. For the past five consecutive months, there have been more calls made to NHS 111 than A&E attendances.
For more information, see our A&E waiting times indicator.
Ambulance handover delays
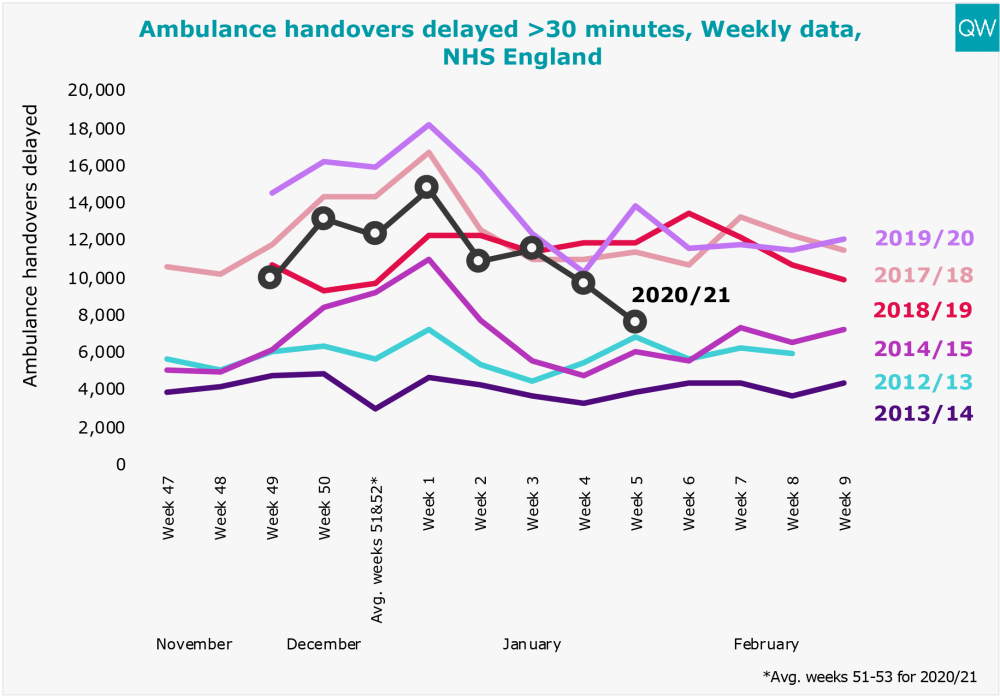
- In Week 5 of 2021 (commencing 1 February), 7,639 ambulance experienced a handover delay of 30 minutes, 45% lower than in Week 5 of 2020. The number of ambulances arriving at A&E was 10% lower in Week 5 of 2021 than Week 5 of 2020.
Bed occupancy
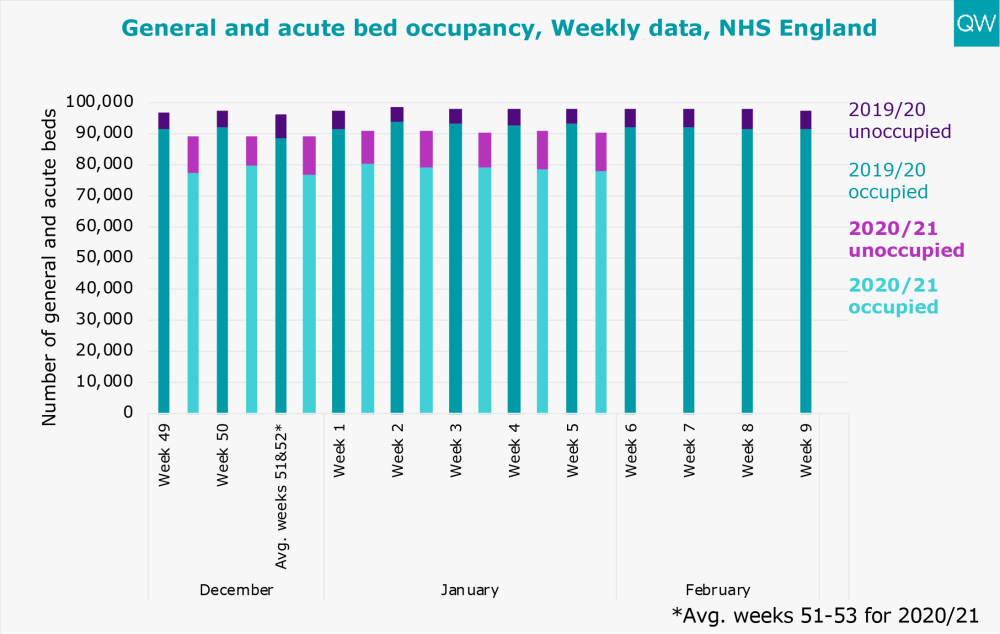
- General and acute bed occupancy was 86% in Week 5 of 2021. There was an average of 90,539 general and acute beds available each day – 8% fewer than in Week 5 of 2020.
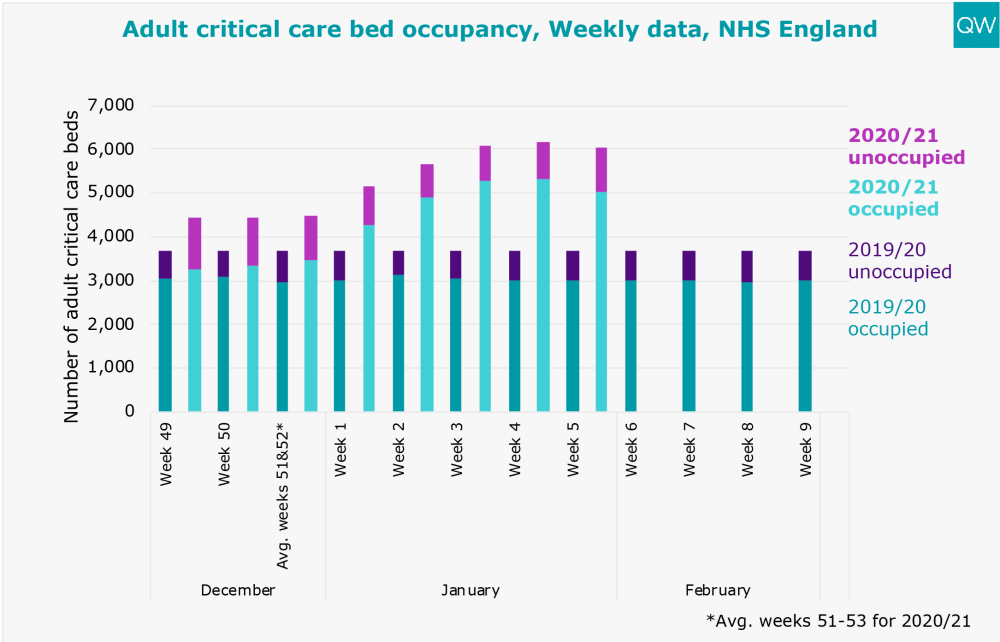
- In Week 5 of 2021, the average number of adult critical care beds available each day was 6,052 – 65% higher than in Week 5 of 2020.
- 83% of available adult critical care beds were occupied in Week 5 of 2021. Due to increased demand for critical care beds, additional beds have been opened in the winter of 2020/21. Relative to the number of available adult critical care beds in Week 5 of 2020, 138% of beds were occupied in Week 5 of 2021.
Treatment and diagnostic test activity and waiting times
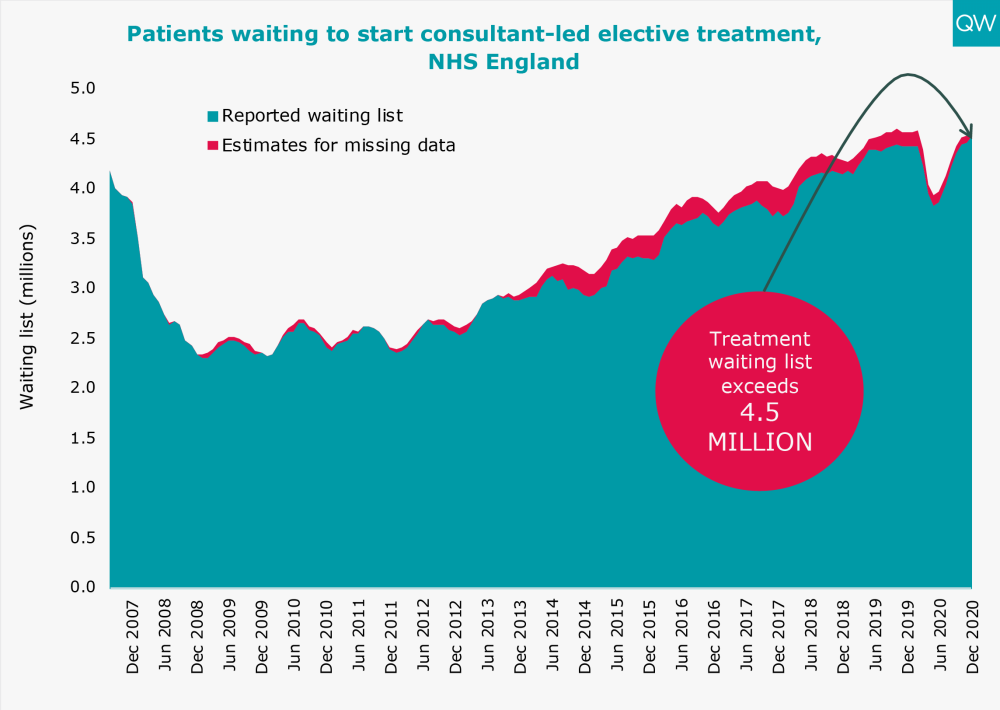
- The total number of people waiting to start consultant-led elective treatment increased to almost 4.6 million in December 2020 (reported waiting list plus the estimate of missing data). This follows a previous fall to 3.9 million in May 2020.
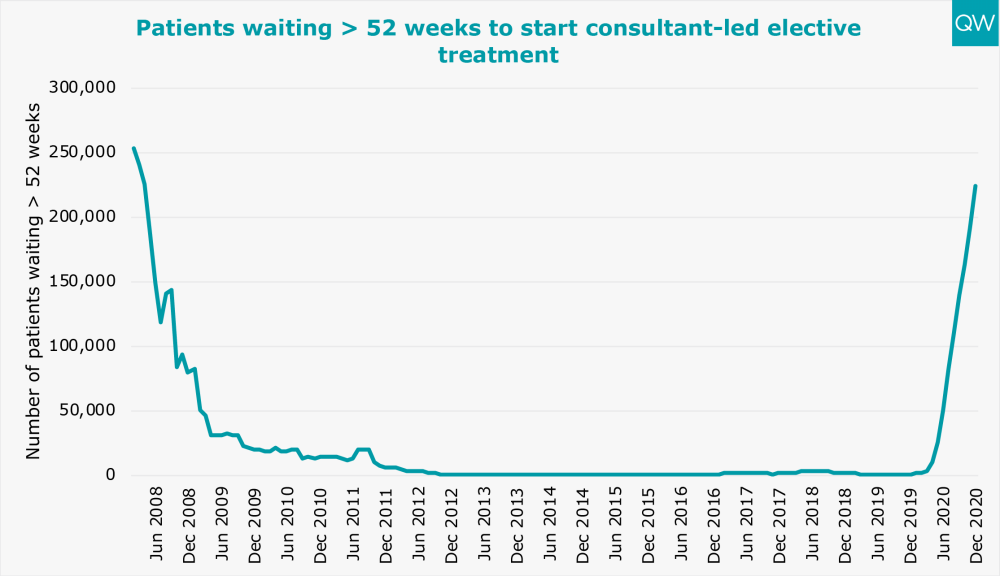
- The number of people waiting over 52 weeks to start consultant-led elective treatment increased to 224,205 in December 2020, the highest level since April 2008.
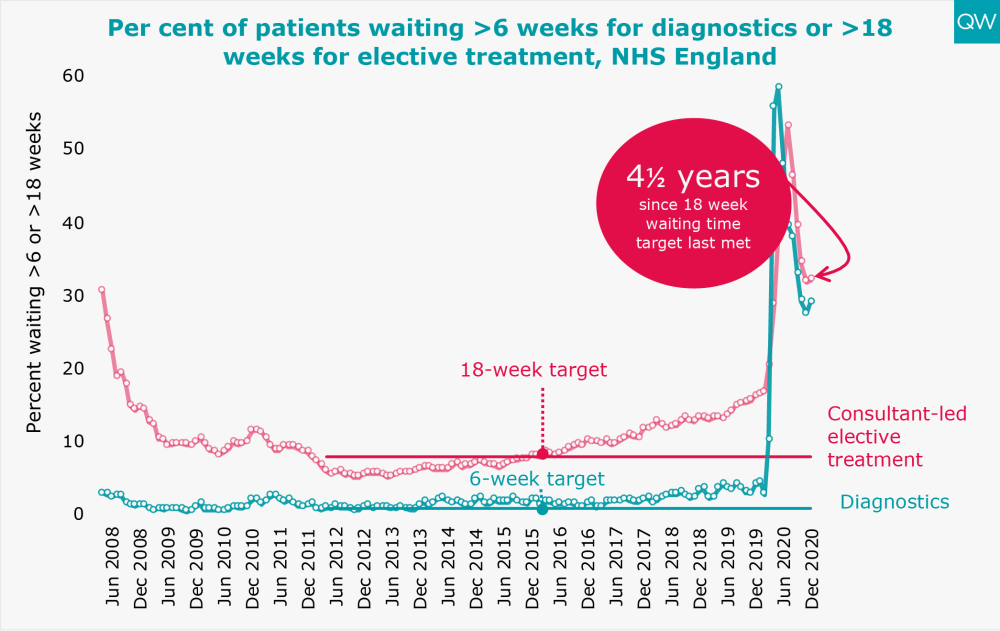
- In December 2020, 32% of people waiting to start elective treatment had been waiting over 18 weeks – almost double the percentage waiting over 18 weeks in December 2019. The 18-week target has not been met for over four and a half years.
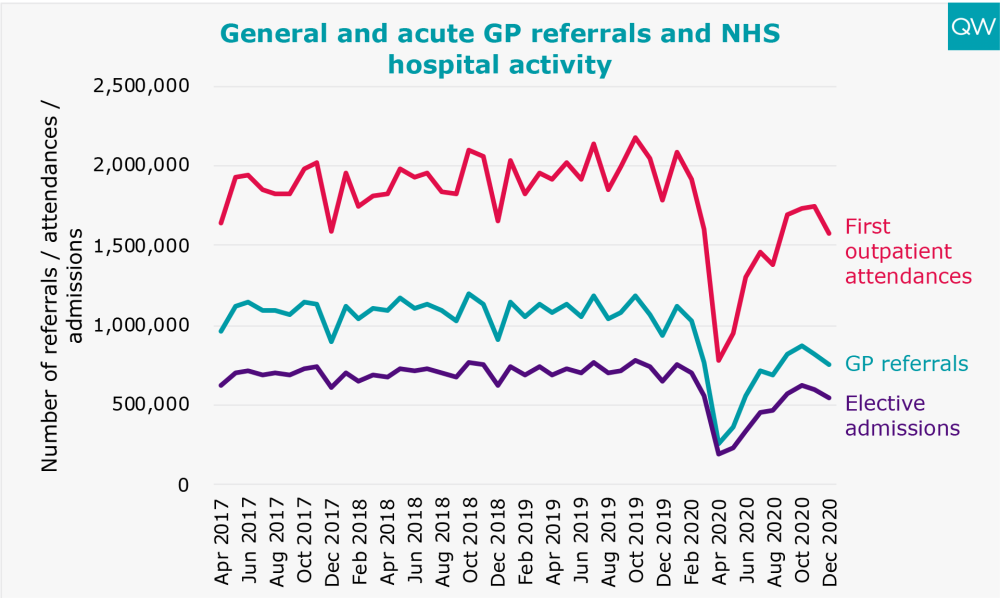
- There were just under 1.6 million first outpatient attendances for general and acute specialties in December 2020 – more than double the low of 785,970 in April 2020 but 12% lower than in December 2019.
- The number of GP referrals to general and acute specialties decreased to 756,545 in December 2020, following the recent fall to 257,850 in April 2020 and subsequent increase to 871,643 in October 2020.
- 29% of patients had been waiting over six weeks for a diagnostic test in December 2020. The diagnostic waiting time target has not been met for over seven years.
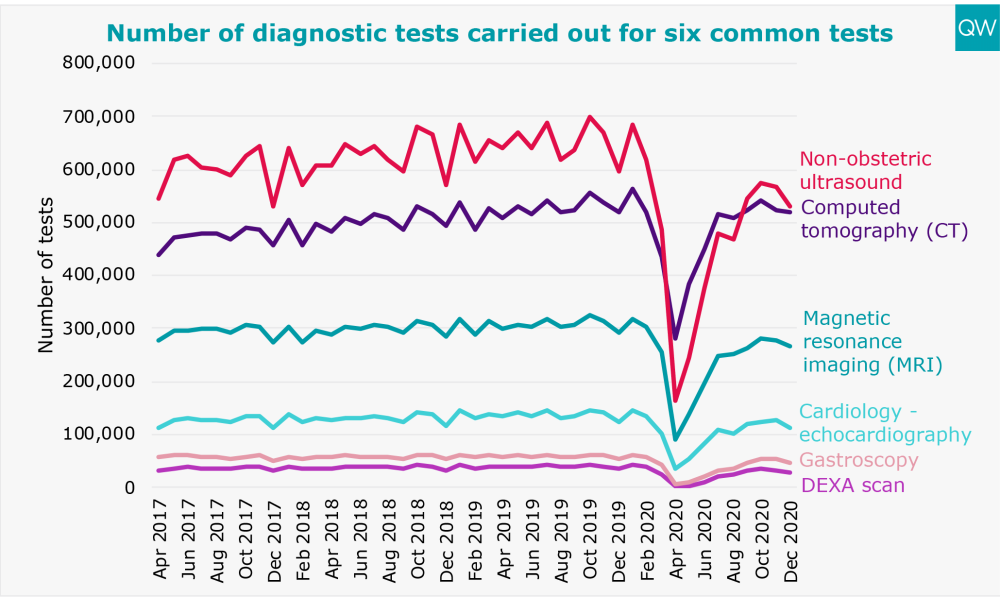
- For fifteen common diagnostic tests, including non-obstetric ultrasound, magnetic resonance imaging (MRI), and computed tomography (CT), there were almost 1.7 million tests carried out in December 2020. This follows a previous fall to 612,232 in April 2020 and subsequent increase to over 1.8 million 1,239,114 in October 2020.
For more information, see our treatment waiting times and diagnostic test waiting times indicators.
Cancer waiting times
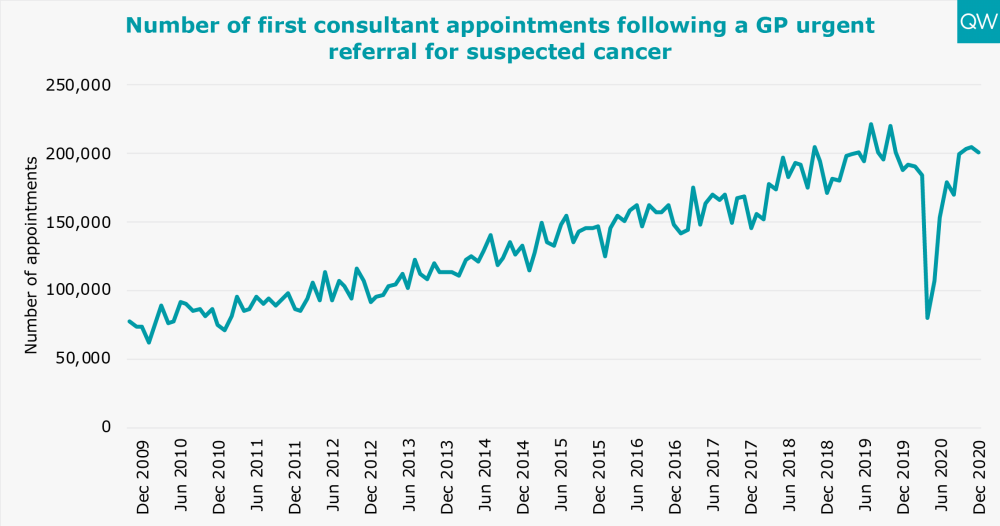
- 200,940 patients had a first consultant appointment for suspected cancer in December 2020 following an urgent GP referral – 7% higher than in December 2019. This follows a substantial drop to less than 80,000 first consultant appointments in April 2020.
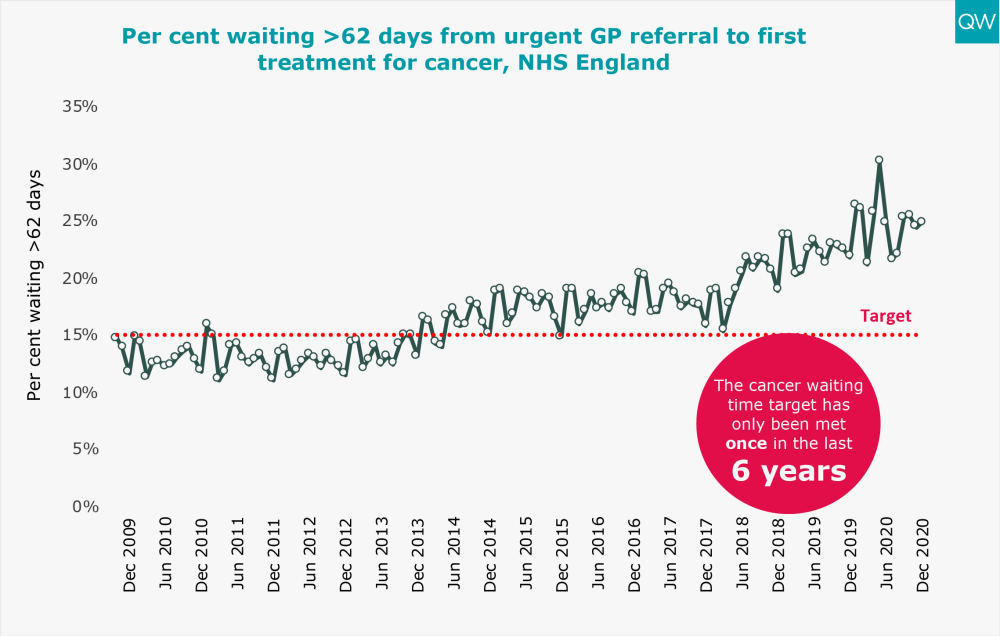
- In December 2020, one in four patients (25%) waited longer than two months to start their first treatment following an urgent GP referral for suspected cancer. The 62-day cancer target has not been met for five years.
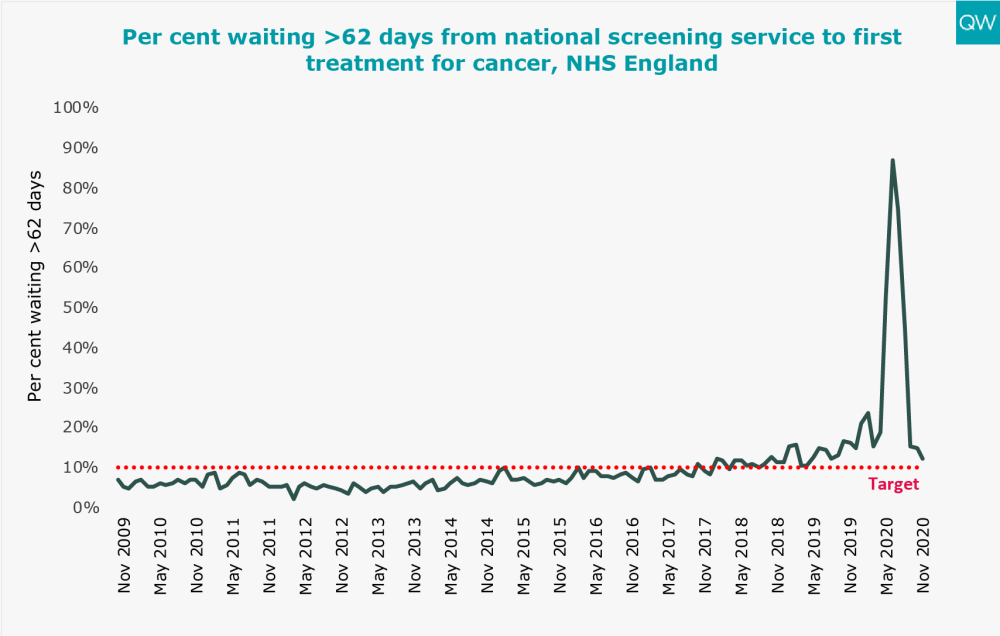
- The percentage of patients who waited longer than two months to start their first treatment for cancer following a referral from a national screening service increased slightly to 16% in December 2020, following the recent worsening to 87% in June 2020. The waiting time target has not been met for over two and a half years.
- 1,562 people started a first treatment for cancer in December 2020 following a referral from a national screening service – 13% lower than in December 2019.
For more information, see our cancer waiting time targets indicator.
About this data
During this unprecedented time for the health service, QualityWatch continues to provide independent scrutiny of the health and social care system as far as possible. The most recent data published today reflects changes in access and service use as a result of the coronavirus (Covid-19) pandemic. In light of these shifts in activity, we have added new charts and changed the presentation of some of our usual charts, to aid interpretation. It is also worth noting that NHS England have suspended data collection for 2020/21 for some of their performance statistics, including delayed transfers of care.
In March 2019, the Clinically-Led Review of NHS Access Standards Interim Report was released, proposing some significant changes to many of the targets reported on here. A six-month Progress Report from the NHS Medical Director was also published in October 2019. Field testing of the proposed new standards began in 2019 and NHS England is currently consulting on the recommendations for urgent and emergency care.
For urgent and emergency care, the field test sites have not been submitting four-hour performance data since May 2019. The time series presented here excludes the field testing sites and so is comparable across months and years. For elective care, performance of the field test sites will continue to be included in the national time series, so the data is fully comparable over time.
For interactive charts showing the quality of health and social care over time, please refer to our 200+ indicators.