Today, NHS England published the latest data on key performance measures for July and August of this year. Here we show some of these statistics and how they compare with previous years.
During this unprecedented time for the health service, QualityWatch will continue to provide independent scrutiny of the health and social care system as far as possible. The most recent data published today reflects dramatic changes in access and service use as a result of the coronavirus (Covid-19) outbreak. In light of these shifts in activity, we have changed the presentation of some of our usual charts, to aid interpretation. It is also worth noting that NHS England have suspended data collection from April to September 2020 for some of their performance statistics, including delayed transfers of care.
In March 2019, the Clinically-Led Review of NHS Access Standards Interim Report was released, proposing some significant changes to many of the targets reported on here. A six-month Progress Report from the NHS Medical Director was also published in October 2019. Field testing of the proposed new standards began in 2019, however due to the coronavirus (Covid-19) outbreak, the publication of the review’s recommendations has been delayed until later this year.
For urgent and emergency care, the field test sites have not been submitting four-hour performance data since May 2019. The time series presented here excludes the field testing sites and so is comparable across months and years. For elective care, performance of the field test sites will continue to be included in the national time series, so the data is fully comparable over time.
For interactive charts showing the quality of health and social care over time, please refer to our 200+ indicators.
A&E
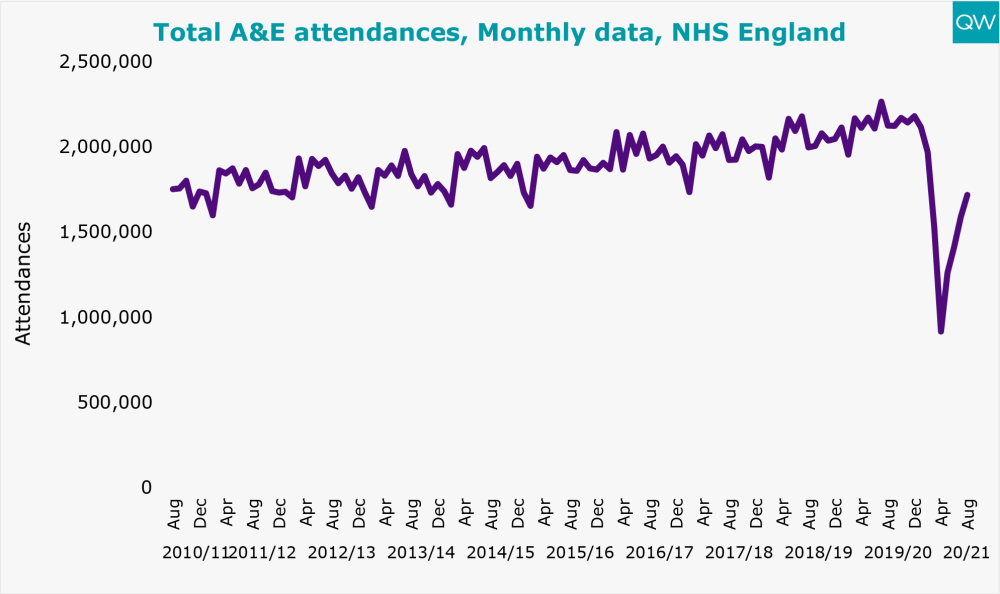
- In August 2020, there were 1.7 million total A&E attendances – 19% lower than in August 2019 but 8.2% higher than in July 2020. From August 2020, A&E attendance figures include booked appointments – 20,500 of these attendances were booked.
- There was an average of 55,452 total A&E attendances per day in August 2020.
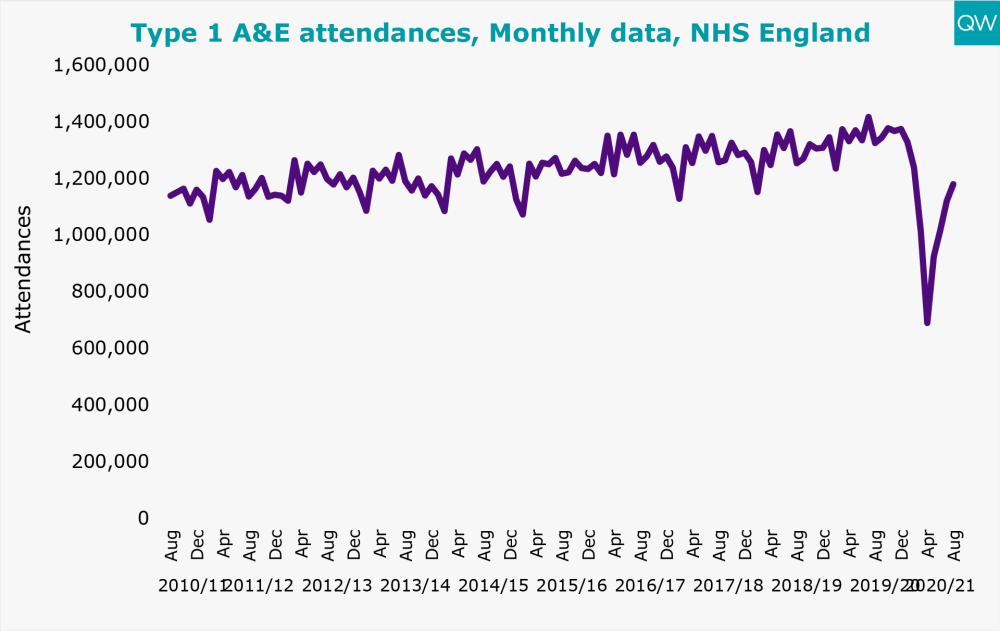
- In August 2020, there were 1.2 million attendances to major (type 1) A&E departments – 11% lower than in August 2019.
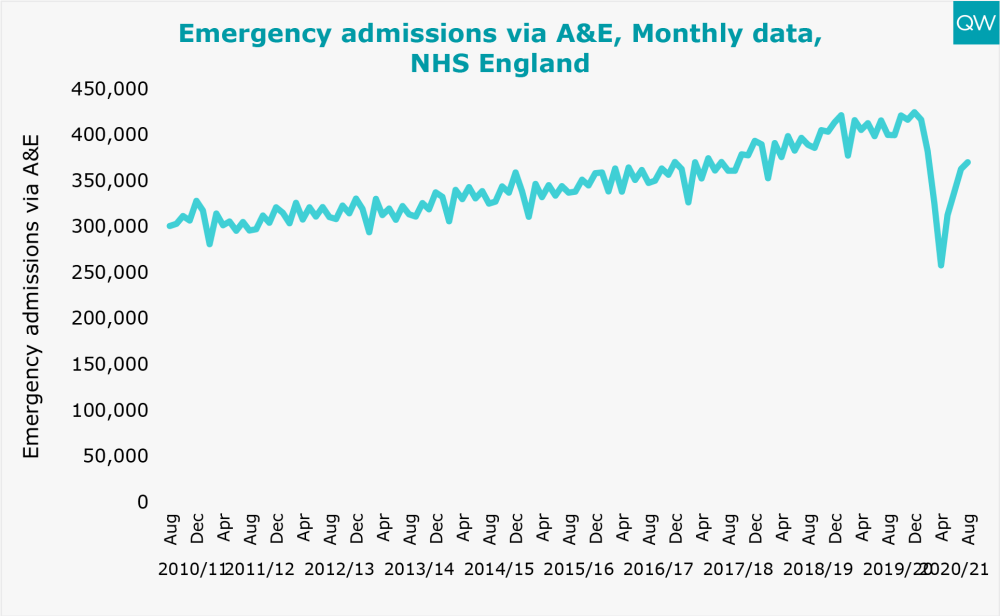
- Emergency admissions via A&E have generally been increasing year-on-year, but fell dramatically in April 2020 to 257,928. In August 2020, there were 370,208 emergency admissions via A&E.
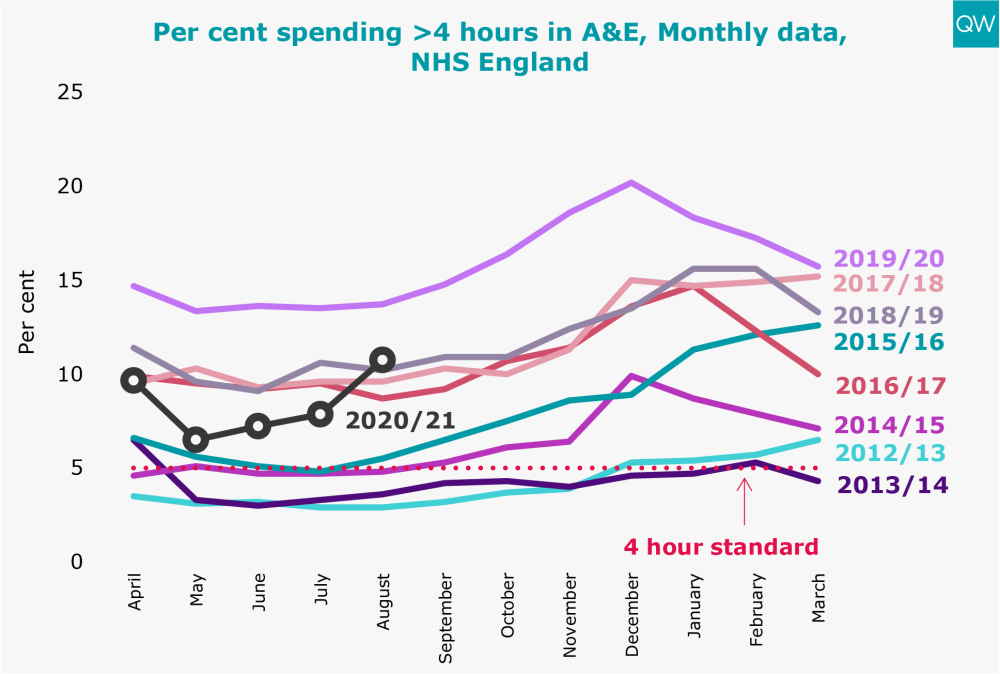
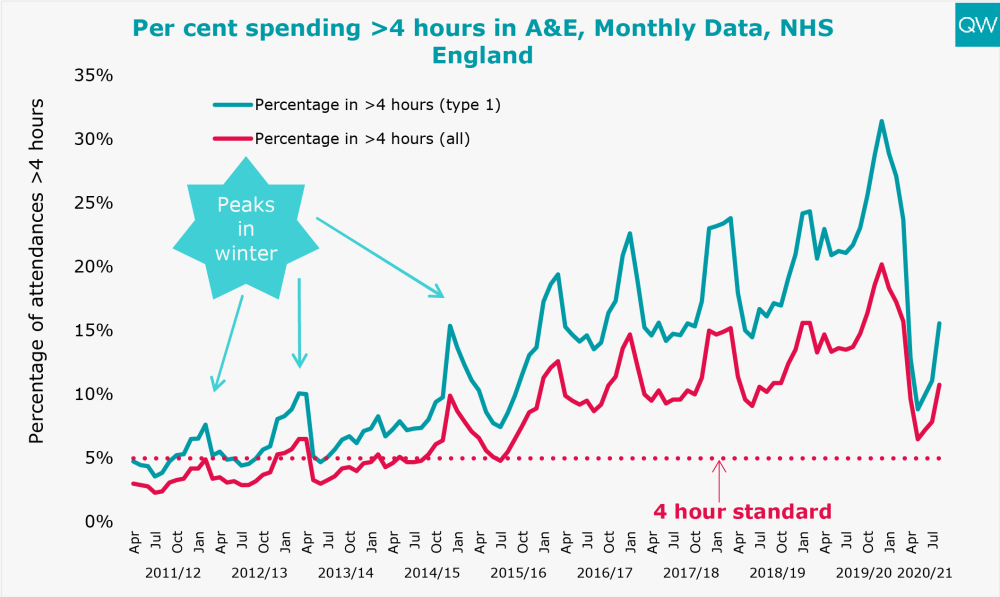
- In August 2020, 10.7% of people attending A&E spent more than four hours from arrival to admission, transfer or discharge, a slight worsening of waiting times compared to July 2020.
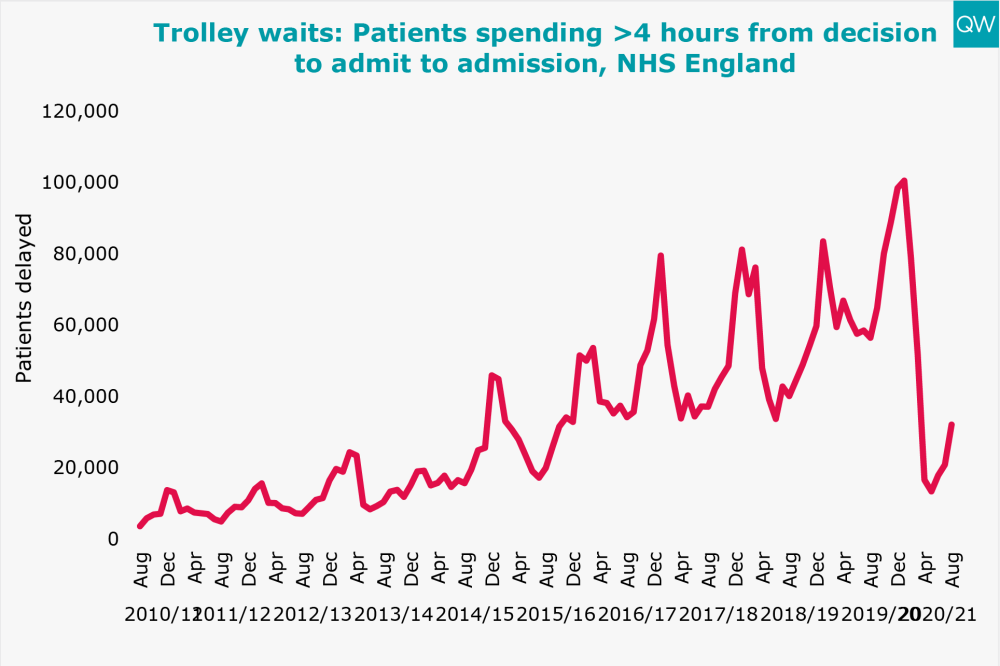
- 32,150 patients spent more than four hours waiting on a trolley from a decision to admit to admission in August 2020 – 43% lower than in August 2019.
For more information, see our A&E waiting times indicator.
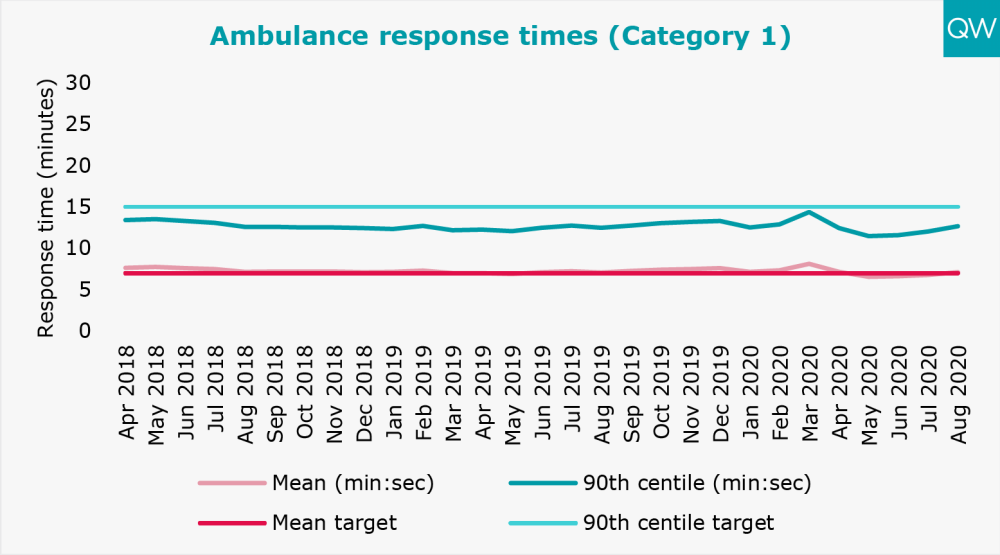
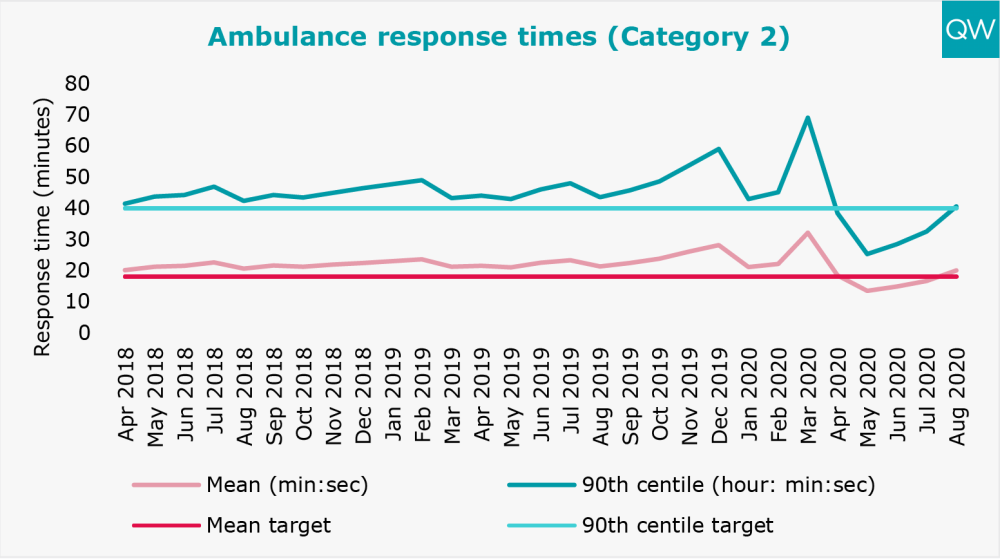
Ambulance response times
- In August 2020, the average response time for Category 1 (life-threatening) calls increased to 7 minutes 6 seconds. This came alongside an 11% increase in the number of Category 1 incidents compared to July 2020.
- The average response time for Category 2 (emergency) calls increased to 20 minutes 3 seconds in August 2020. This corresponds to a 5% increase in Category 2 incidents between July and August.
For more information, see our ambulance response times indicator.
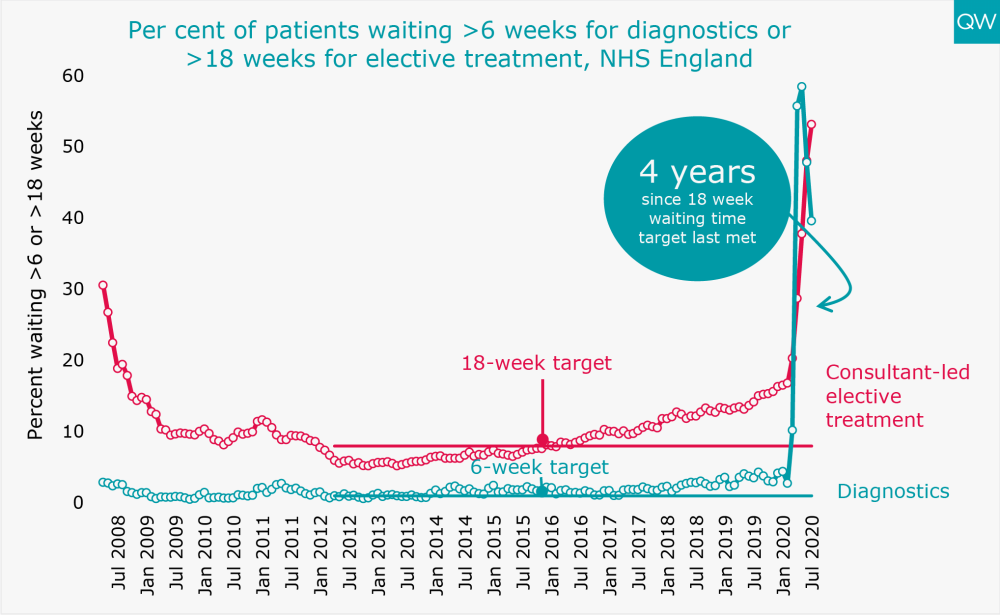
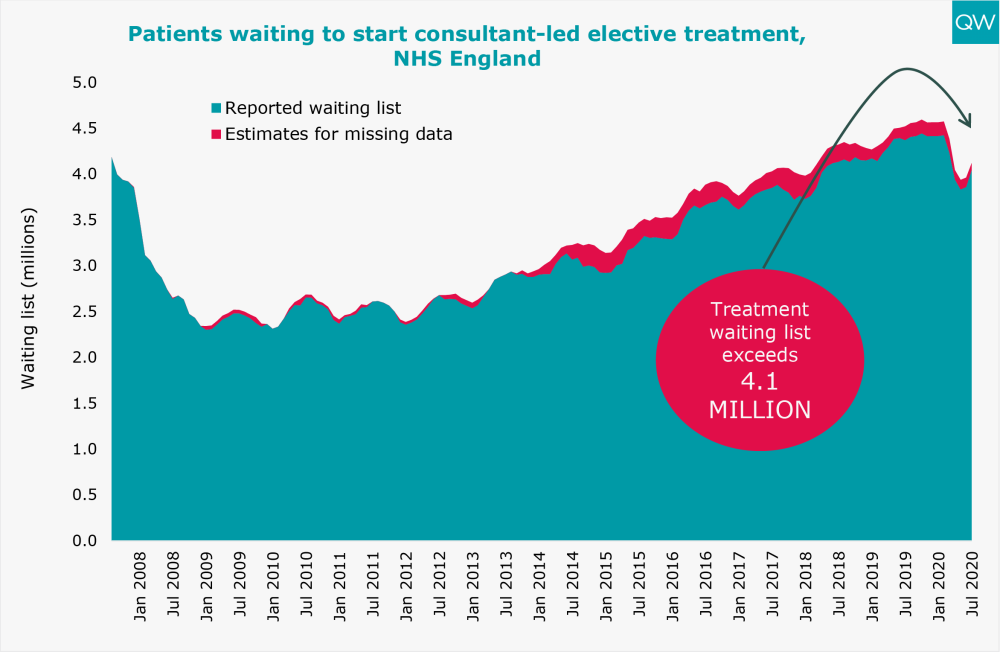
Treatment and diagnostic test waiting times
- In July 2020, over half (53%) of people waiting to start elective treatment had been waiting over 18 weeks. This is the worst performance since records began and the 18-week target has not been met for over four years.
- In July 2020, 40% of patients had been waiting over six weeks for a diagnostic test. The diagnostic waiting time target has not been met for over six and a half years.
- The total number of people waiting to start consultant-led elective treatment increased to over 4.1 million in July 2020 (reported waiting list plus the estimate of missing data). This follows a previous fall from 4.4 million in February 2020.
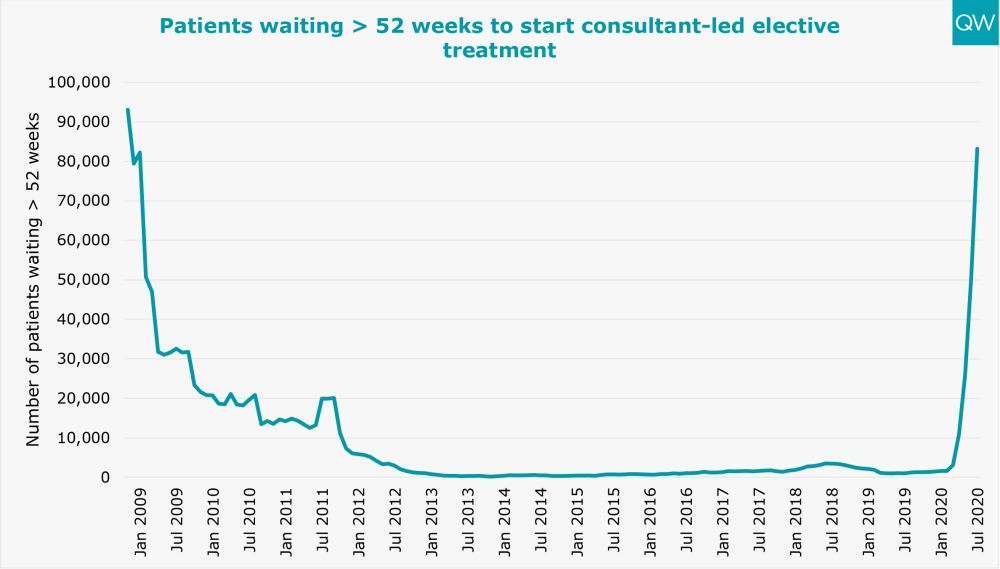
- The number of people waiting over 52 weeks to start consultant-led elective treatment increased to 83,203 in July 2020, the highest level since November 2008.
For more information, see our treatment waiting times and diagnostic test waiting times indicators.
Cancer waiting times
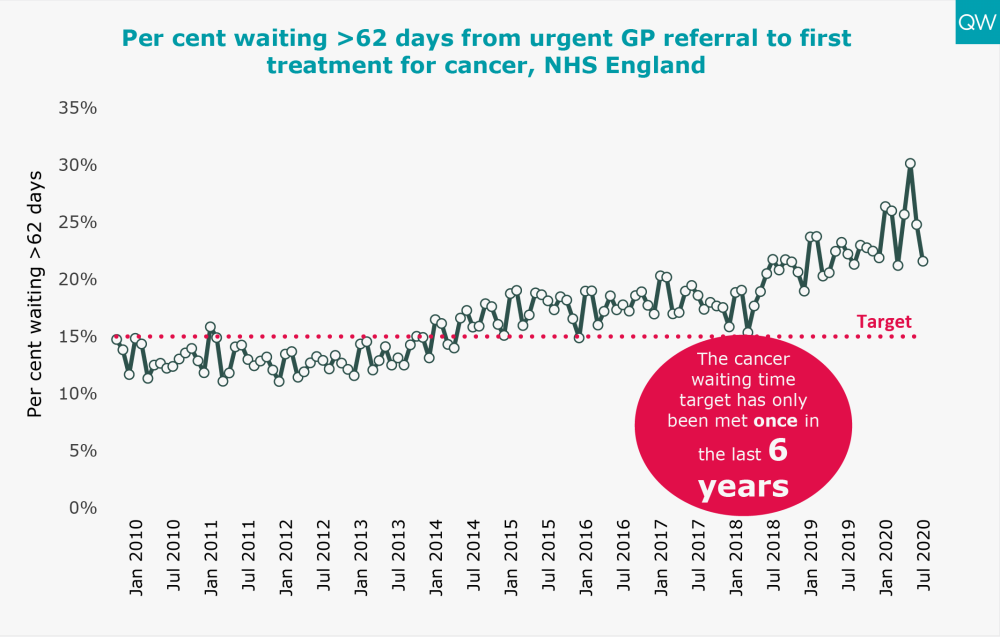
- The percentage of patients who waited longer than two months to start their first treatment for cancer following an urgent GP referral improved slightly to 22% in July 2020. The 62-day cancer target has not been met for over four and a half years.
- In July 2020, 11,742 people started a first treatment for cancer following an urgent GP referral – 21% lower than in July 2019.
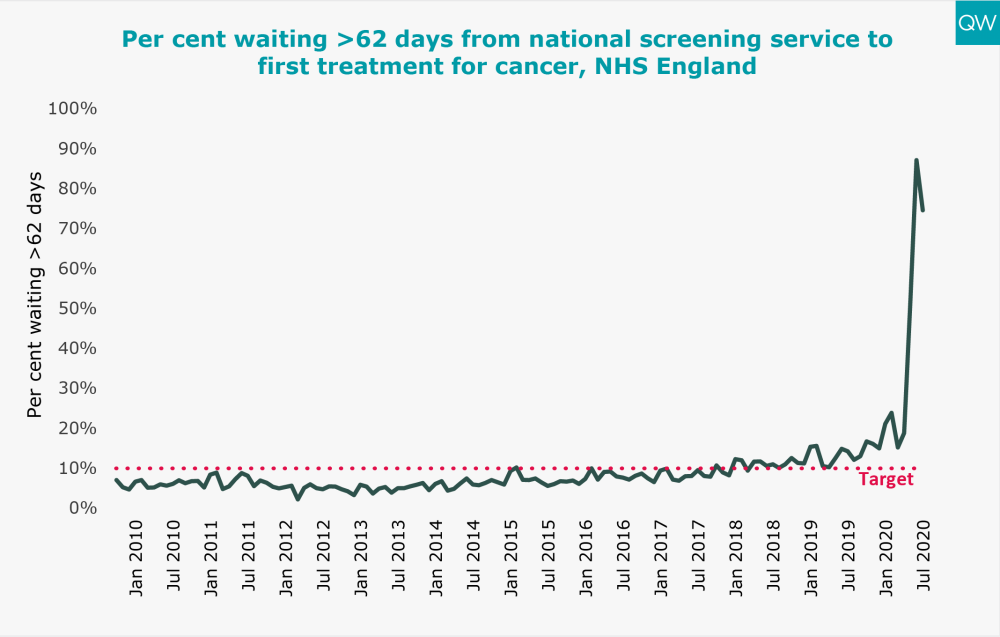
- In July 2020, 75% of patients waited longer than two months to start their first treatment for cancer following a referral from a national screening service. The waiting time target has not been met for over two years.
- 319 people started a first treatment for cancer in July 2020 following a referral from a national screening service – 83% lower than in July 2019.