
Today, NHS England and NHS Digital published the latest data on key activity and performance measures for March and April of this year. Here we show some of these statistics and how they compare with previous trends.
Urgent care
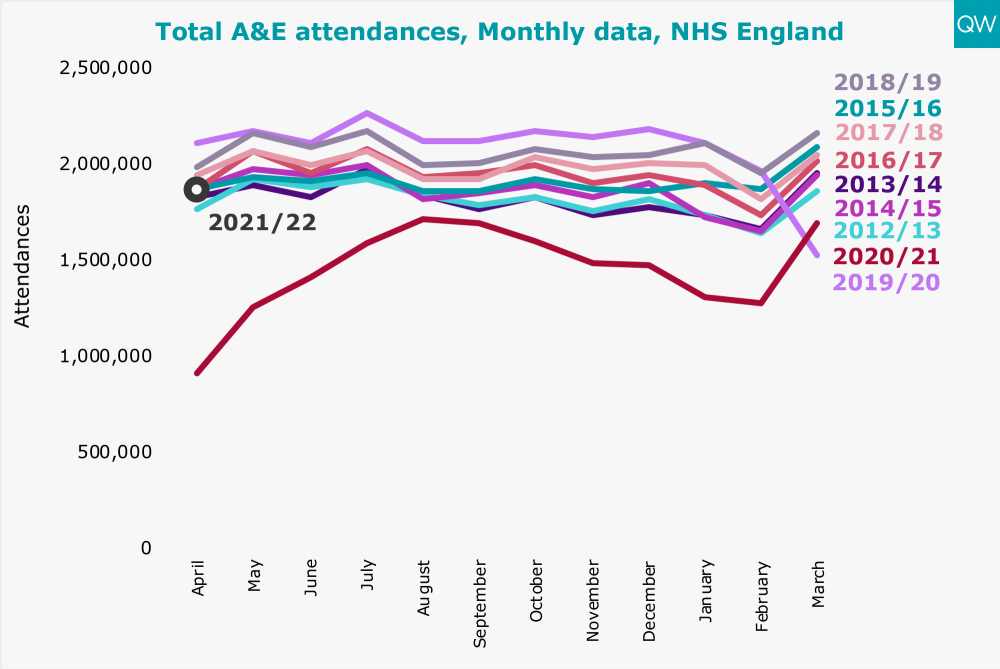
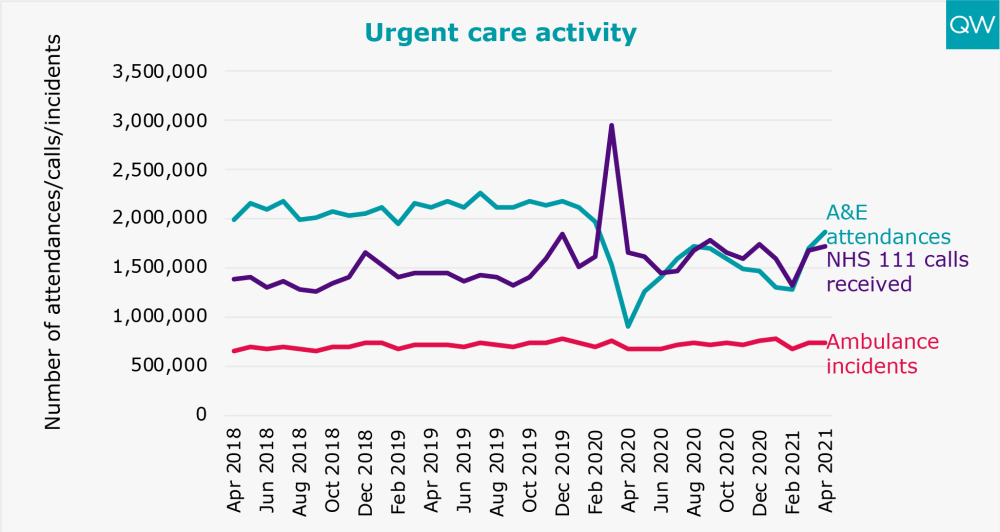
- In April 2021, total A&E attendances increased to almost 1.9 million – double that of April 2020 (after the outbreak of Covid-19 when attendances fell to less than 1 million), but 11% lower than in April 2019.
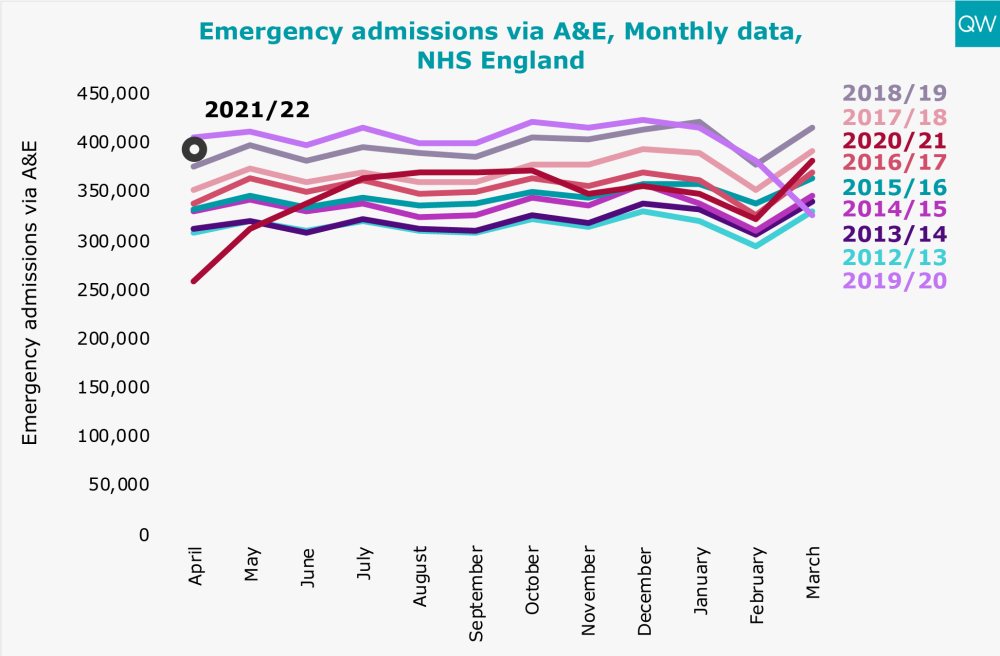
- There were 392,159 emergency admissions via A&E in April 2021 – 52% higher than in April 2020 but 3% lower than in April 2019. Emergency admissions via A&E have generally been increasing year-on-year, but fell dramatically in April 2020 to 257,928.
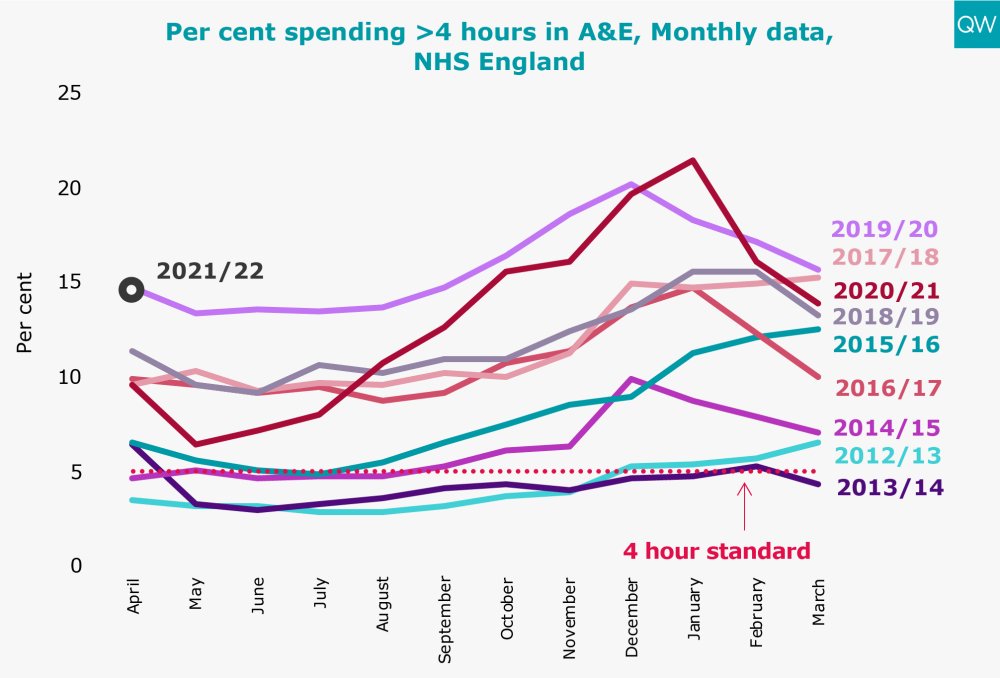
- In April 2021, 15% of people attending A&E spent more than four hours from arrival to admission, transfer or discharge. This is the same as it was in April 2019, but 5 percentage points worse than in April 2020, when waiting times improved while the number of attendances decreased.
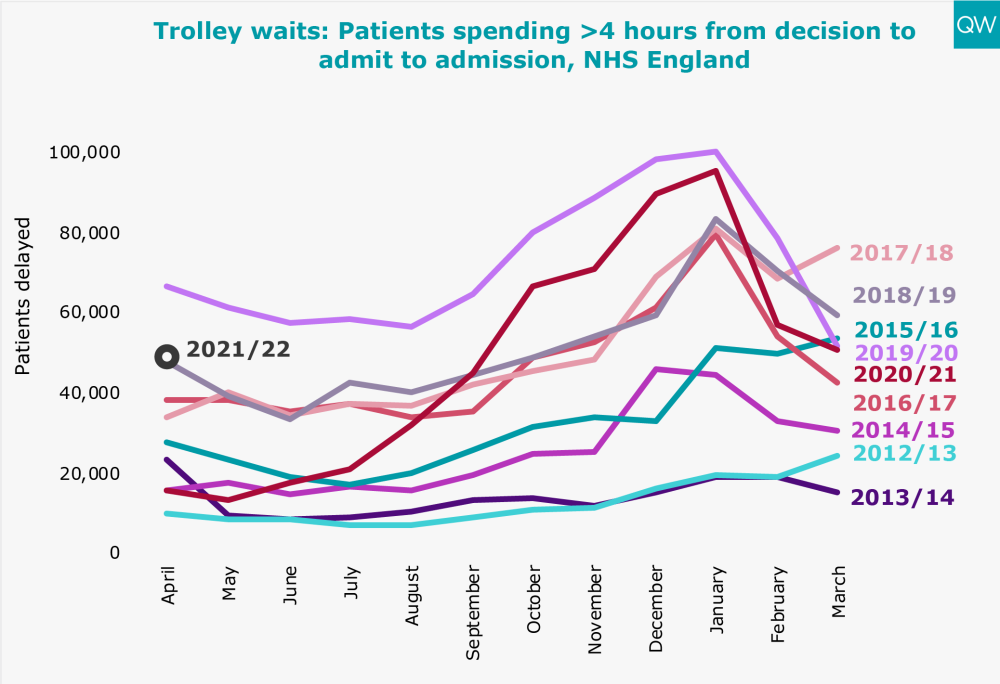
- 48,719 patients spent more than four hours waiting on a trolley from a decision to admit to admission in April 2021. 523 people had a trolley wait of over 12 hours.
- There were over 1.7 million calls made to NHS 111 in April 2021, ~150,000 lower than the number of A&E attendances but more than double the number of ambulance incidents.
For more information, see our A&E waiting times indicator.
Treatment and diagnostic test activity and waiting times
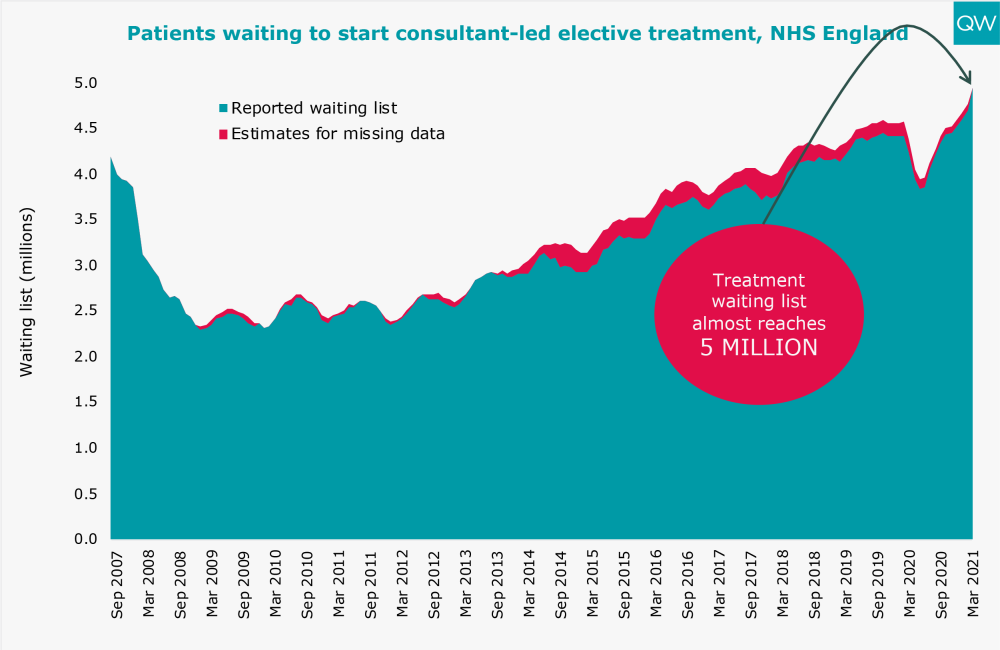
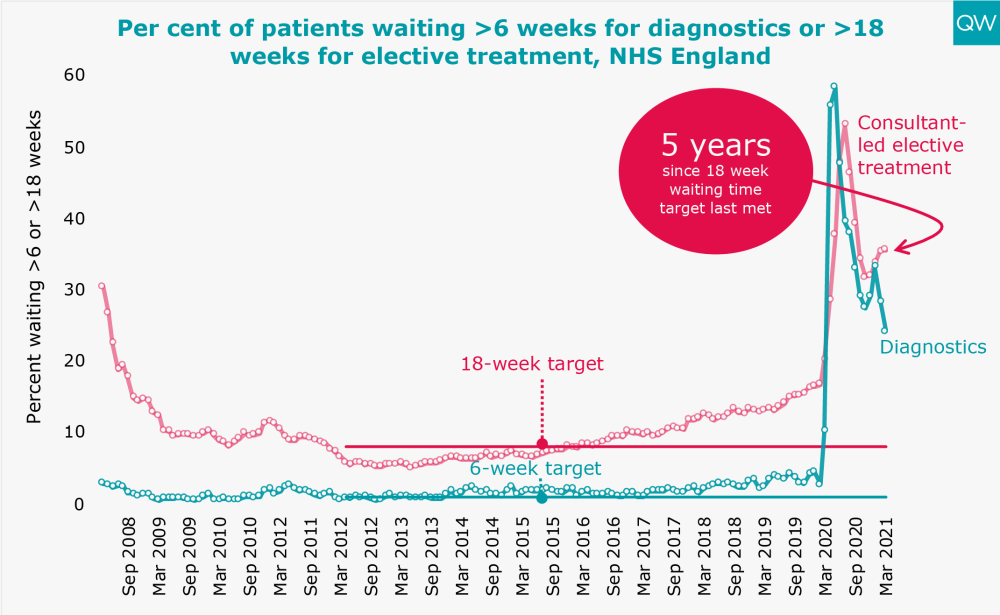
- The total number of people waiting to start consultant-led elective treatment increased to 4.95 million in March 2021, the highest level since records began. This follows a previous fall to 3.94 million in May 2020.
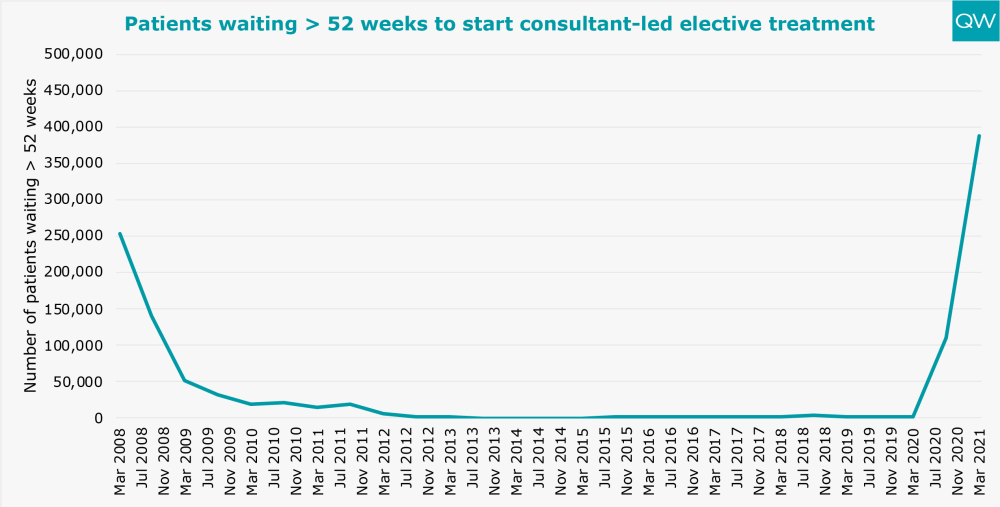
- The number of people waiting over 52 weeks to start consultant-led elective treatment increased to 436,127 in March 2021, the highest level since August 2007.
- In March 2021, 1.8 million people had been waiting over 18 weeks to start elective treatment – double the number waiting over 18 weeks in March 2020.
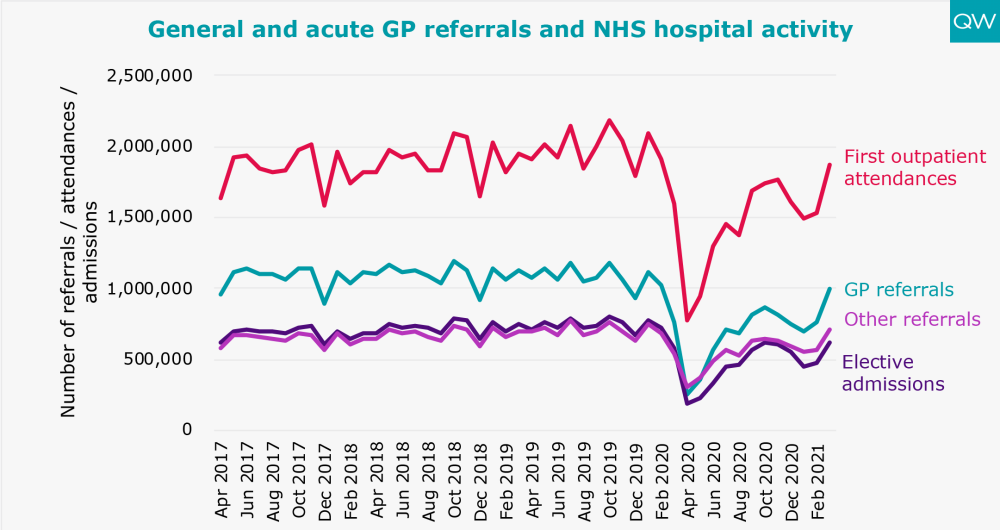
- The number of first outpatient attendances for general and acute specialties increased to over 1.8 million in March 2021, following a fall to around 780,000 in April 2020.
- 24% of patients had been waiting over six weeks for a diagnostic test in March 2021, a 34 percentage point improvement on the peak in May 2020, but still 22 percentage points worse than in March 2019.
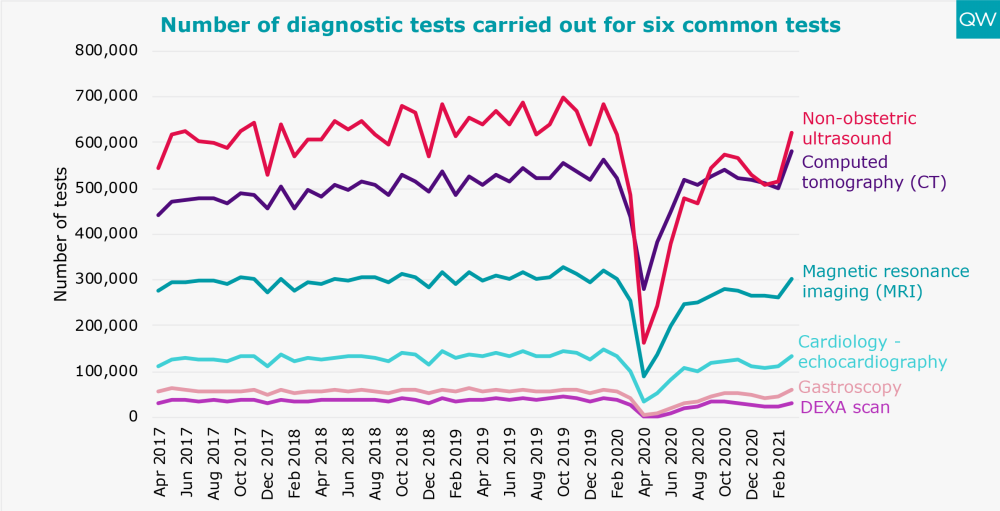
- For fifteen common diagnostic tests, including non-obstetric ultrasound, magnetic resonance imaging (MRI), and computed tomography (CT), there were over 1.9 million tests carried out in March 2021.
For more information, see our treatment waiting times and diagnostic test waiting times indicators.
Cancer waiting times
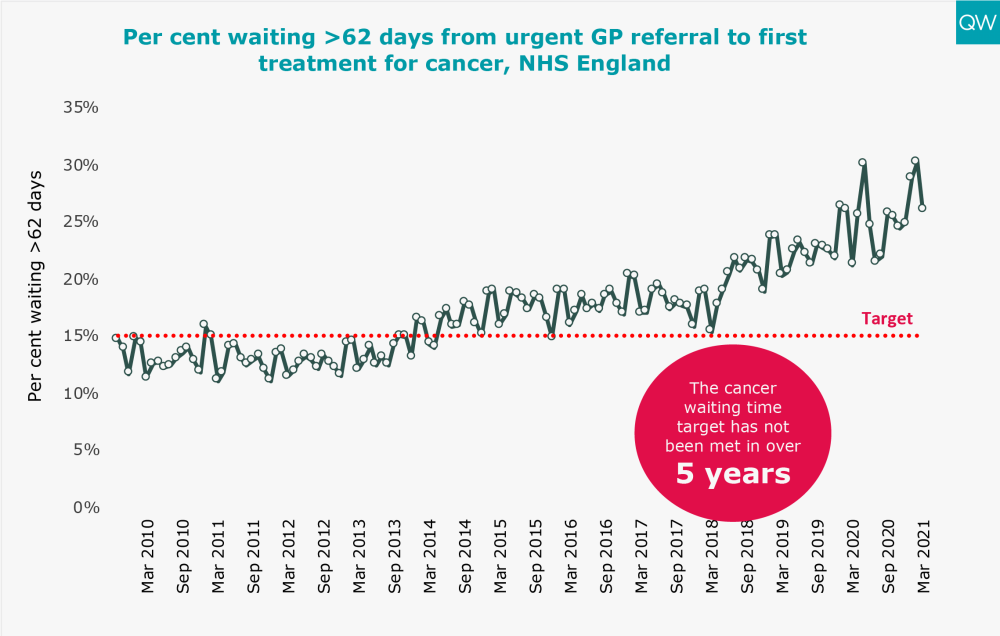
- In March 2021, 26% of patients waited longer than two months to start their first treatment following an urgent GP referral for suspected cancer, 5 percentage points worse than in March 2020. The 62-day cancer target has not been met for over five years.
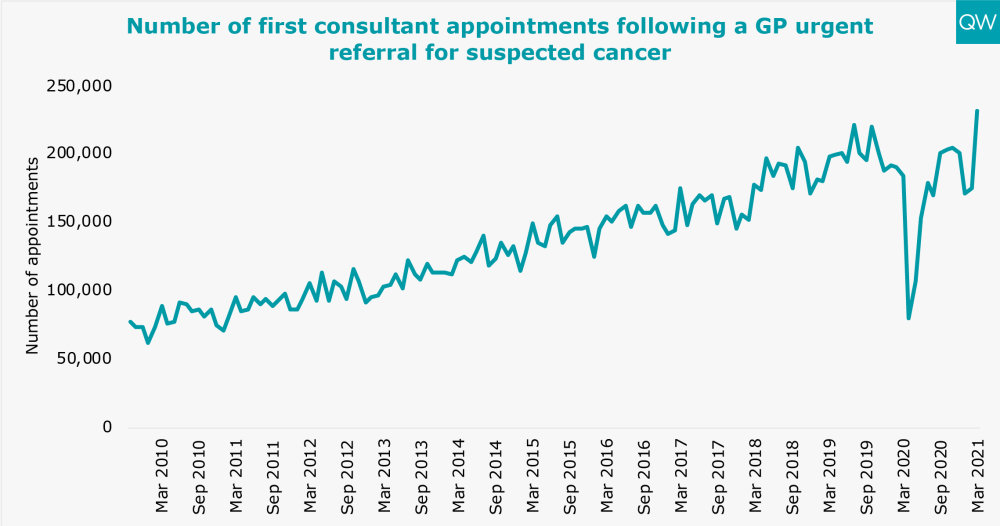
- The number of patients who had a first consultant appointment for suspected cancer reached 232,084 in March 2021. This is almost 50,000 higher than in March 2020, and the highest number since records began.
For more information, see our cancer waiting time targets indicator.
About this data
During this unprecedented time for the health service, QualityWatch continues to provide independent scrutiny of the health and social care system as far as possible. The most recent data published today reflects changes in access and service use as a result of the coronavirus (Covid-19) pandemic. In light of these shifts in activity, we have added new charts and changed the presentation of some of our usual charts, to aid interpretation. It is also worth noting that NHS England have suspended data collection for 2020/21 and Q1 2021/22 for some of their performance statistics, including delayed transfers of care.
In March 2019, the Clinically-Led Review of NHS Access Standards Interim Report was released, proposing some significant changes to many of the targets reported on here. A six-month Progress Report from the NHS Medical Director was also published in October 2019. Field testing of the proposed new standards began in 2019 and NHS England has recently consulted on the recommendations for urgent and emergency care.
For urgent and emergency care, the field test sites have not been submitting four-hour performance data since May 2019. The time series presented here excludes the field testing sites and so is comparable across months and years. For elective care, performance of the field test sites will continue to be included in the national time series, so the data is fully comparable over time.
For interactive charts showing the quality of health and social care over time, please refer to our 200+ indicators.