Today, NHS England and NHS Digital published the latest data on key activity and performance measures for October and November of this year. Urgent and Emergency Care Daily Situation Reports were also published for the first week of December, giving a more up-to-date analysis of how the NHS is coping this winter. Here we show some of these statistics and how they compare with previous trends.
During this unprecedented time for the health service, QualityWatch continues to provide independent scrutiny of the health and social care system as far as possible. The most recent data published today reflects changes in access and service use as a result of the coronavirus (Covid-19) pandemic. In light of these shifts in activity, we have added new charts and changed the presentation of some of our usual charts, to aid interpretation. It is also worth noting that NHS England have suspended data collection for 2020/21 for some of their performance statistics, including delayed transfers of care.
In March 2019, the Clinically-Led Review of NHS Access Standards Interim Report was released, proposing some significant changes to many of the targets reported on here. A six-month Progress Report from the NHS Medical Director was also published in October 2019. Field testing of the proposed new standards began in 2019, however due to the coronavirus (Covid-19) outbreak, the publication of the review’s recommendations has been delayed until later this year.
For urgent and emergency care, the field test sites have not been submitting four-hour performance data since May 2019. The time series presented here excludes the field testing sites and so is comparable across months and years. For elective care, performance of the field test sites will continue to be included in the national time series, so the data is fully comparable over time.
For interactive charts showing the quality of health and social care over time, please refer to our 200+ indicators.
Urgent care
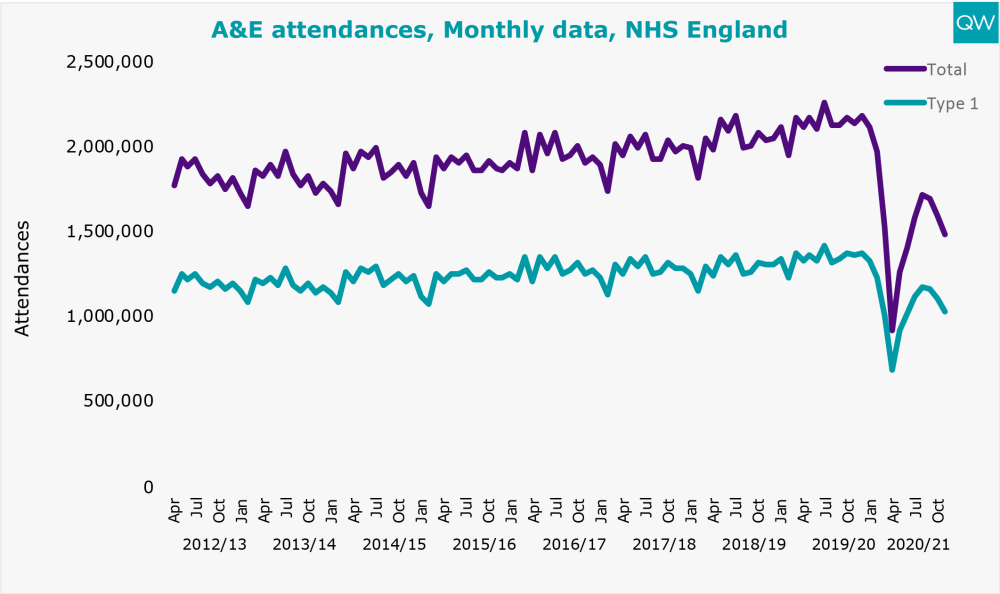
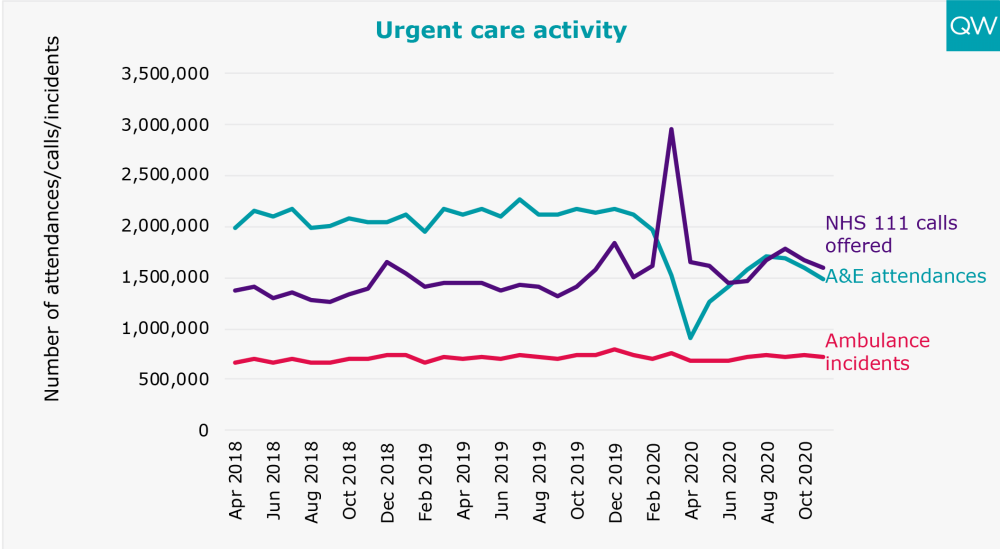
- In November 2020, total A&E attendances fell to just under 1.5 million – 31% lower than in November 2019. This follows a decrease to 916,581 in April 2020 and a subsequent increase to just over 1.7 million in August 2020. Around 1 million attendances in November were to major (type 1) A&E departments.
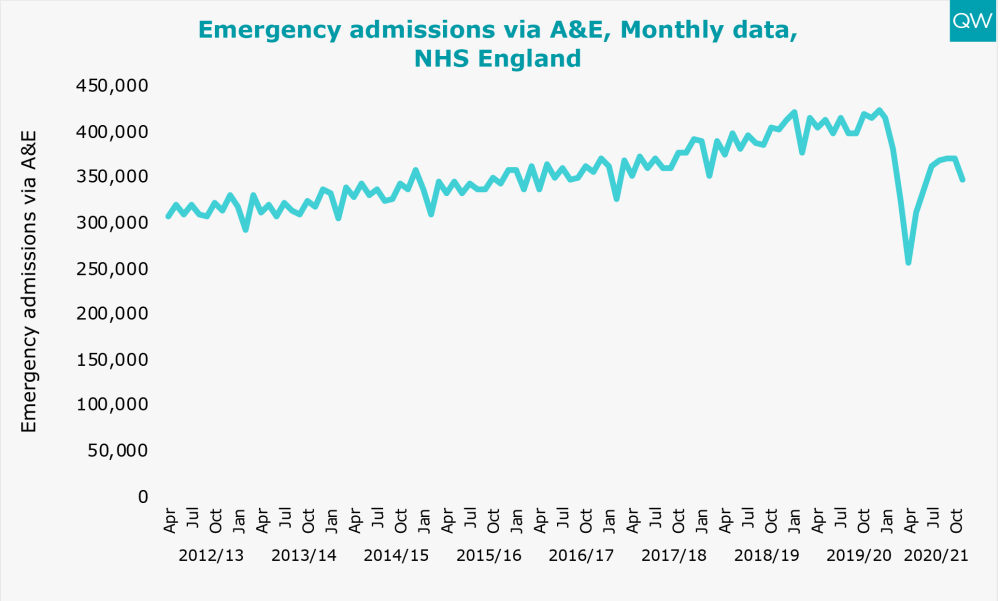
- There were 347,211 emergency admissions via A&E in November 2020 – 17% lower than in November 2019. Emergency admissions via A&E have generally been increasing year-on-year, but fell dramatically in April 2020 to 257,928.
- There were around 1.6 million calls made to NHS 111 in November 2020, slightly more than in November 2019. For the past three consecutive months, there have been more calls made to NHS 111 than A&E attendances.
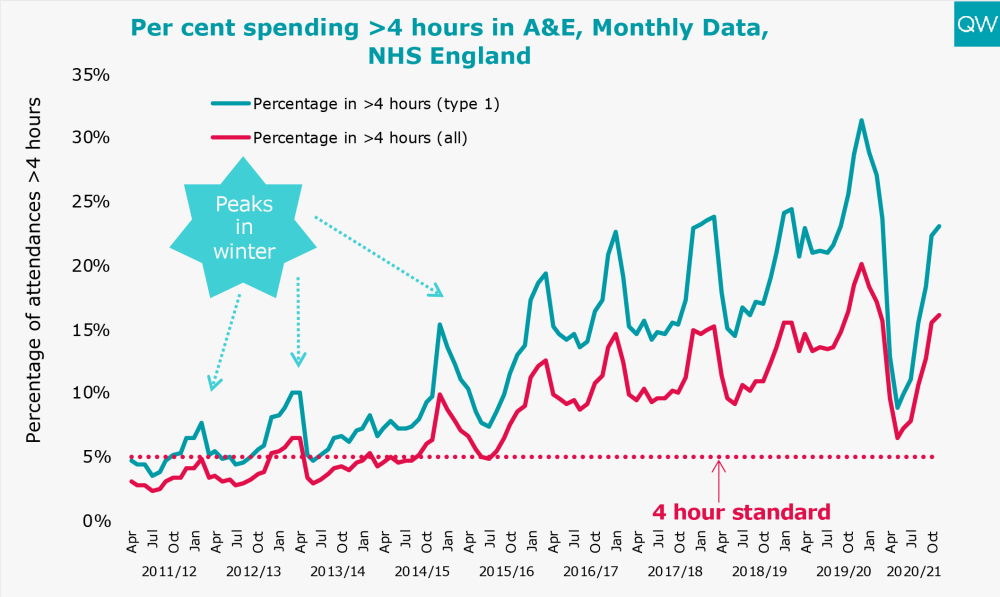
- In November 2020, 16% of people attending A&E spent more than four hours from arrival to admission, transfer or discharge. Waiting times have worsened for the past six consecutive months.
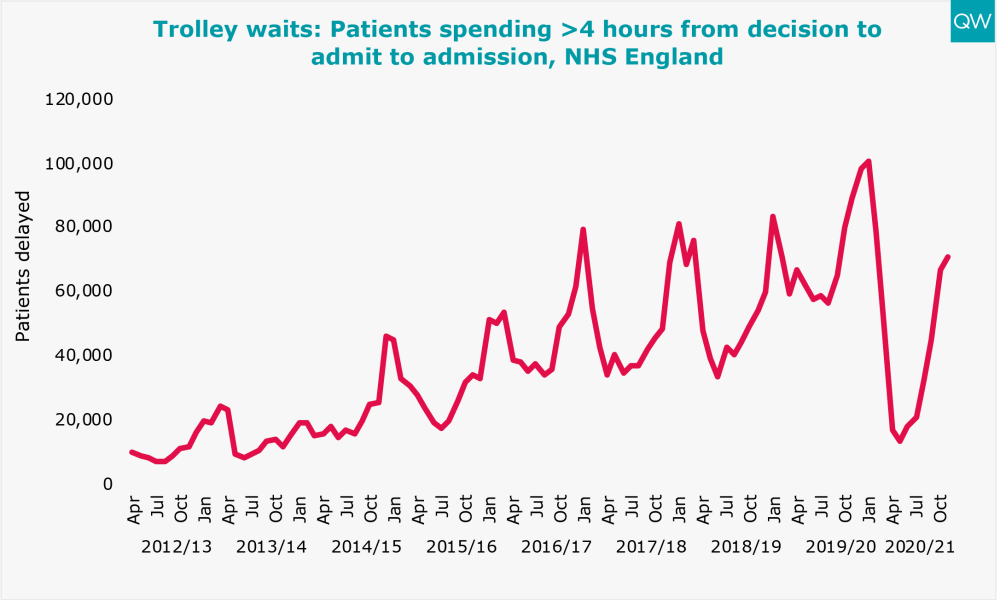
- 71,041 patients spent more than four hours waiting on a trolley from a decision to admit to admission in November 2020 – 20% lower than in November 2019. Trolley waits have been increasing each month since May 2020. 2,141 people had a trolley wait of over 12 hours in November 2020, almost double that in October 2019.
For more information, see our A&E waiting times indicator.
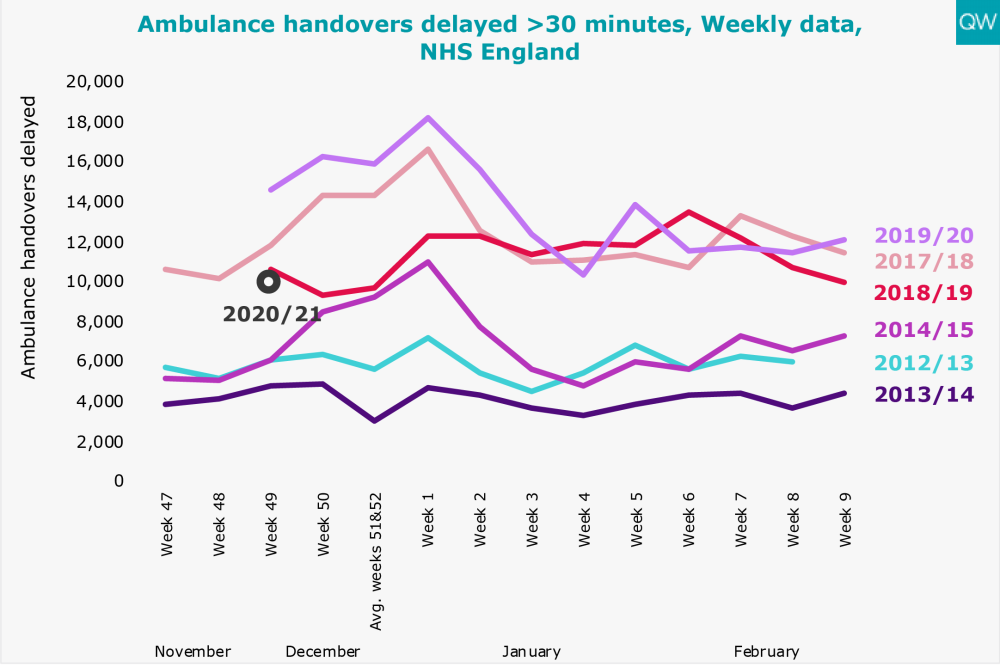
Ambulance handover delays
- In Week 49 of 2020 (commencing 30 November), 9,956 ambulances experienced a handover delay of over 30 minutes. This is a third lower than in Week 49 of 2019.
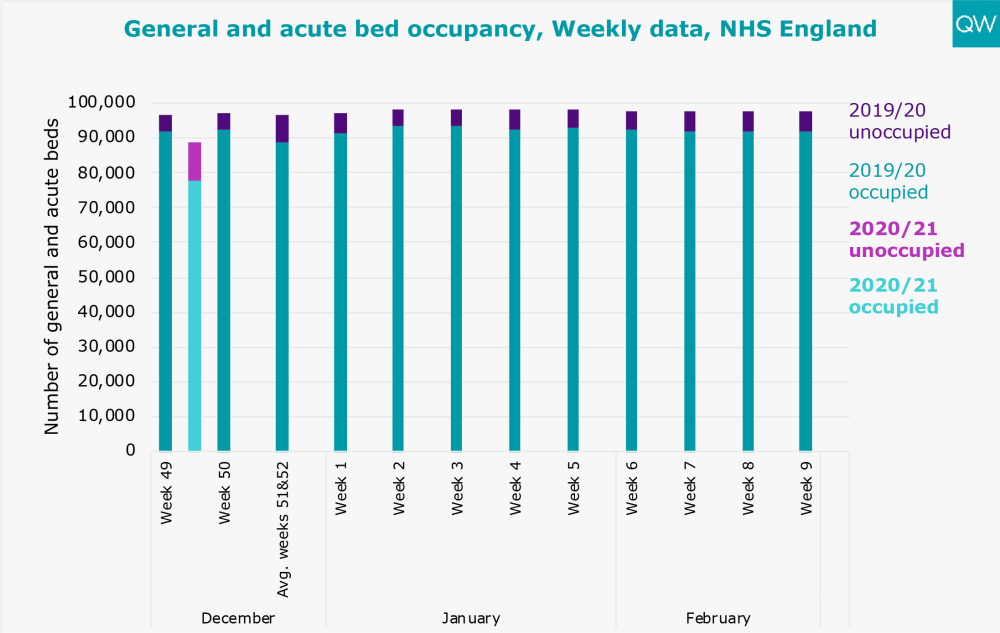
Bed occupancy
- General and acute bed occupancy was 87% in Week 49 of 2020. This compares to 95% occupancy in Week 49 of 2019. There was an average of 88,947 general and acute beds available each day – 8% fewer than in Week 49 of 2019.
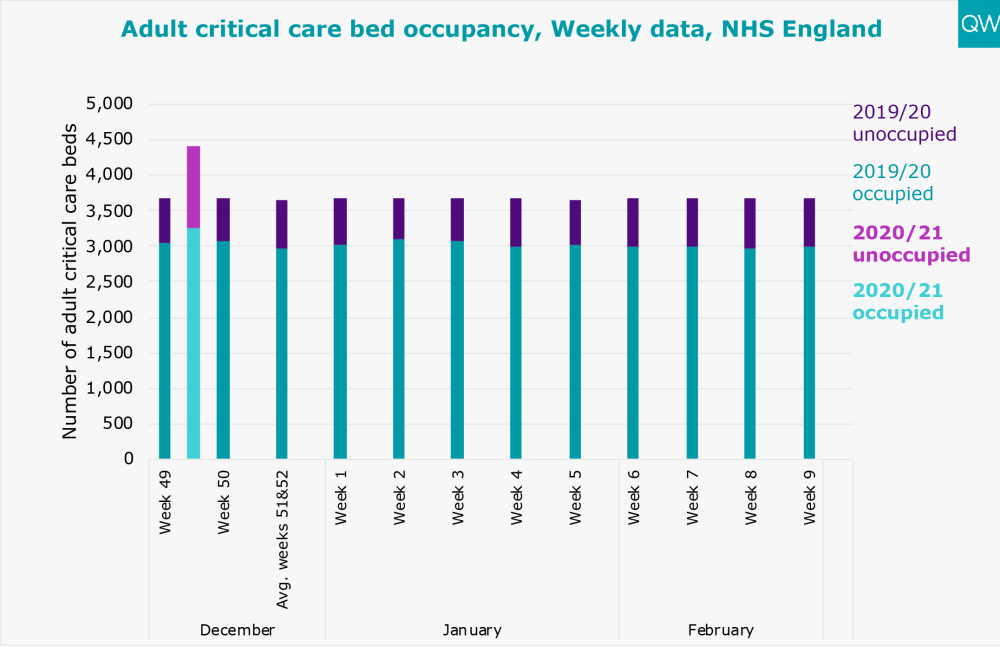
- In Week 49 of 2020, the average number of adult critical care beds available each day was 4,415 – 20% higher than Week 49 of 2019. 74% of adult critical care beds were occupied, compared to 83% in the same week last year.
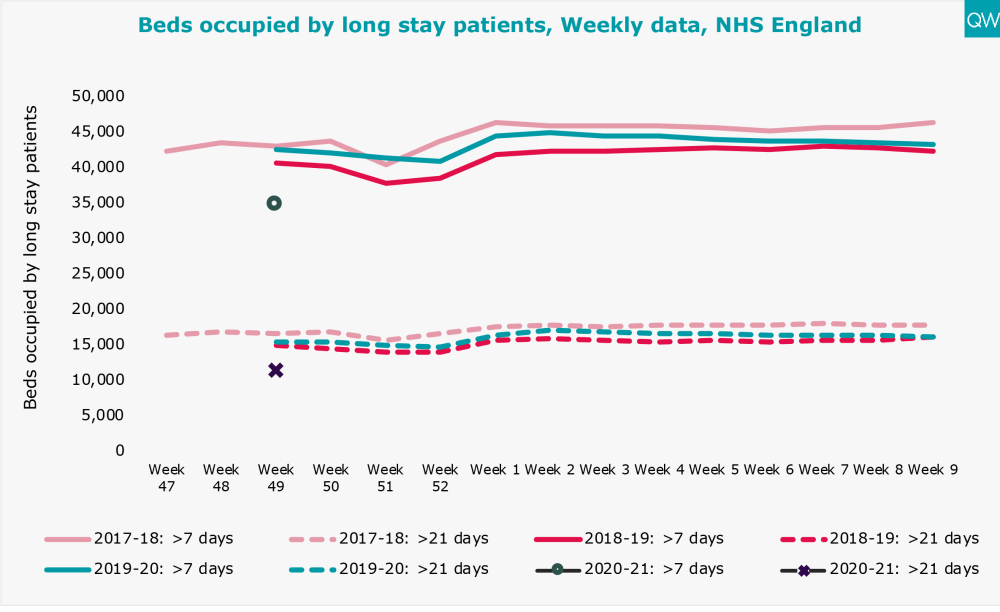
Beds occupied by long stay patients
- There was an average of 11,336 hospital beds occupied by long stay patients (>21 days) in Week 49 of 2020. This is 26% lower than in Week 49 of 2019.
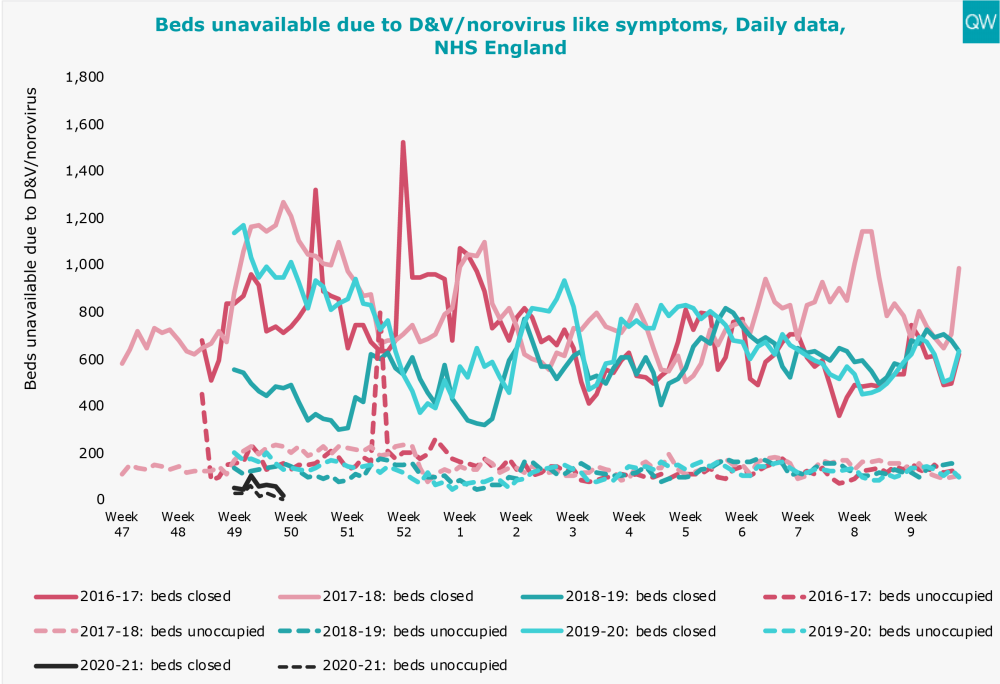
Beds unavailable due to D&V/norovirus like symptoms
- In Week 49 of 2020, an average of 58 hospital beds were closed each day due to diarrhoea and vomiting (D&V)/norovirus like symptoms – almost 18 times lower than the same week last year. Of the closed beds, 26 were unoccupied.
Treatment and diagnostic test activity and waiting times
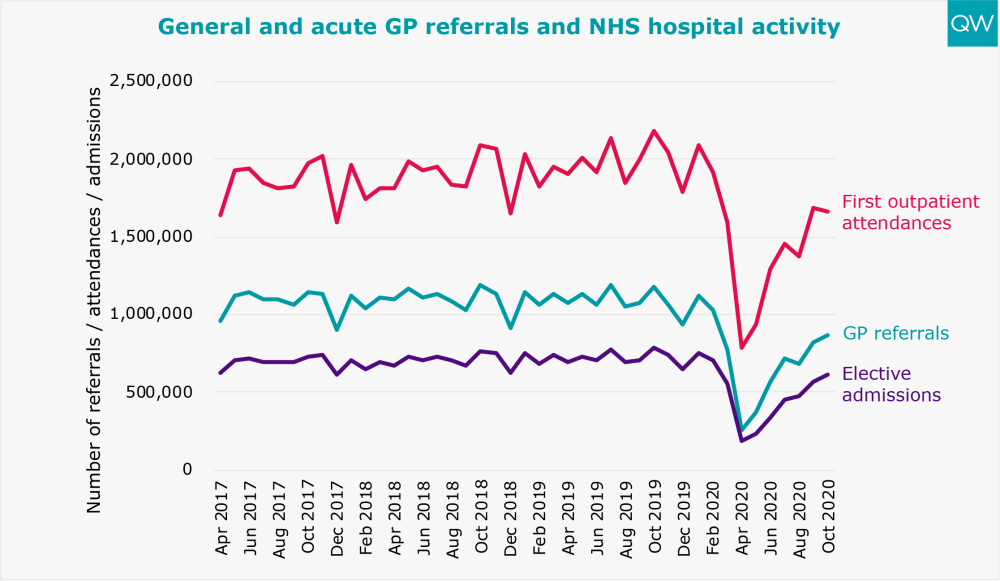
- In October 2020, there were over 1.6 million first outpatient attendances for general and acute specialties – more than double the low of 784,320 in April 2020 but 24% lower than in October 2019. The number of elective admissions increased to 609,298 – 22% lower than in October 2019.
- The number of GP referrals to general and acute specialties increased to 871,643 in October 2020, following the recent fall to 257,850 in April 2020.
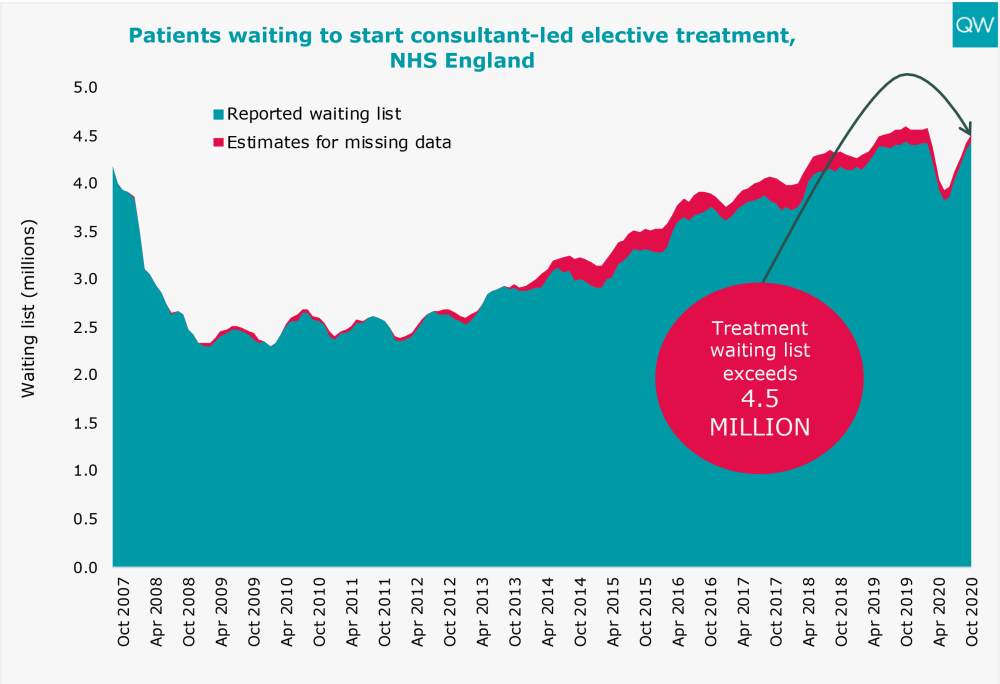
- The total number of people waiting to start consultant-led elective treatment increased to over 4.5 million in October 2020 (reported waiting list plus the estimate of missing data). This follows a previous fall to 3.9 million in May 2020.
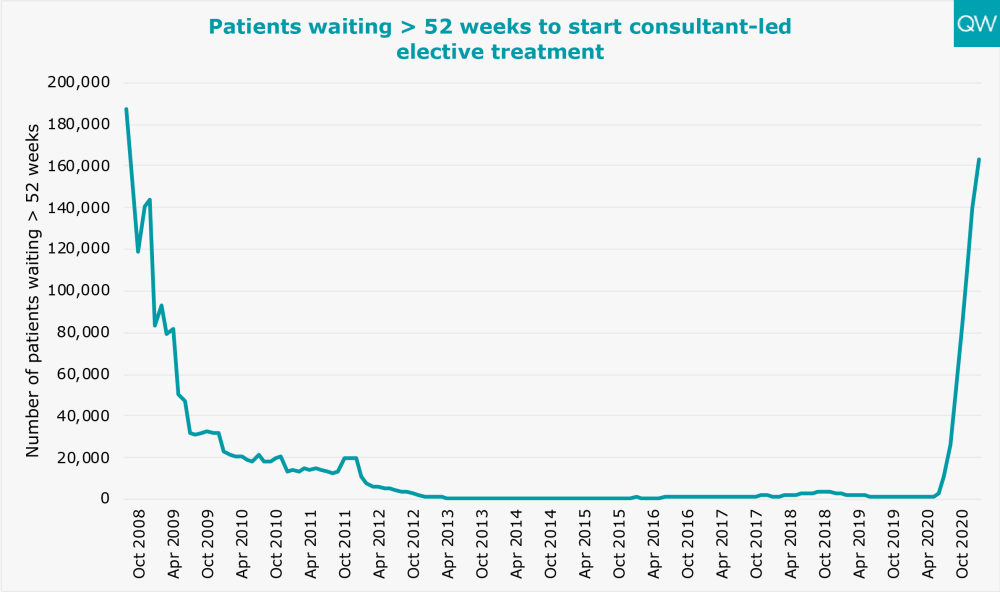
- The number of people waiting over 52 weeks to start consultant-led elective treatment increased to 162,888 in October 2020, the highest level since May 2008.
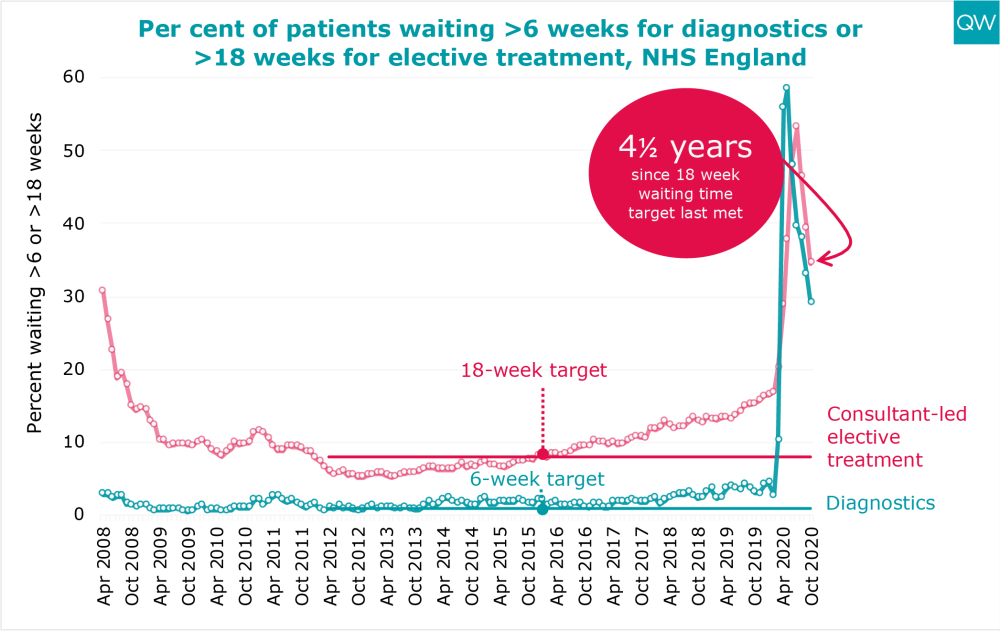
- In October 2020, 35% of people waiting to start elective treatment had been waiting over 18 weeks – a slight improvement compared to September 2020. The 18-week target has not been met for over four and a half years.
- In October 2020, 29% of patients had been waiting over six weeks for a diagnostic test. The diagnostic waiting time target has not been met for over six and a half years.
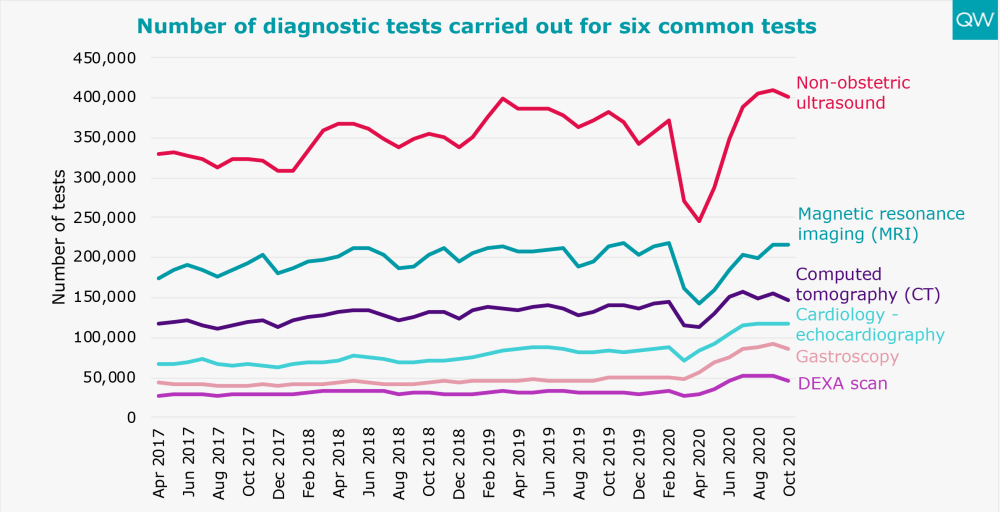
- For fifteen common diagnostic tests, including non-obstetric ultrasound, magnetic resonance imaging (MRI), and computed tomography (CT), there were 1,239,114 tests carried out in October 2020. This is 16% higher than in October 2019, and follows a previous fall to 838,569 in March 2020.
For more information, see our treatment waiting times and diagnostic test waiting times indicators.
Cancer waiting times
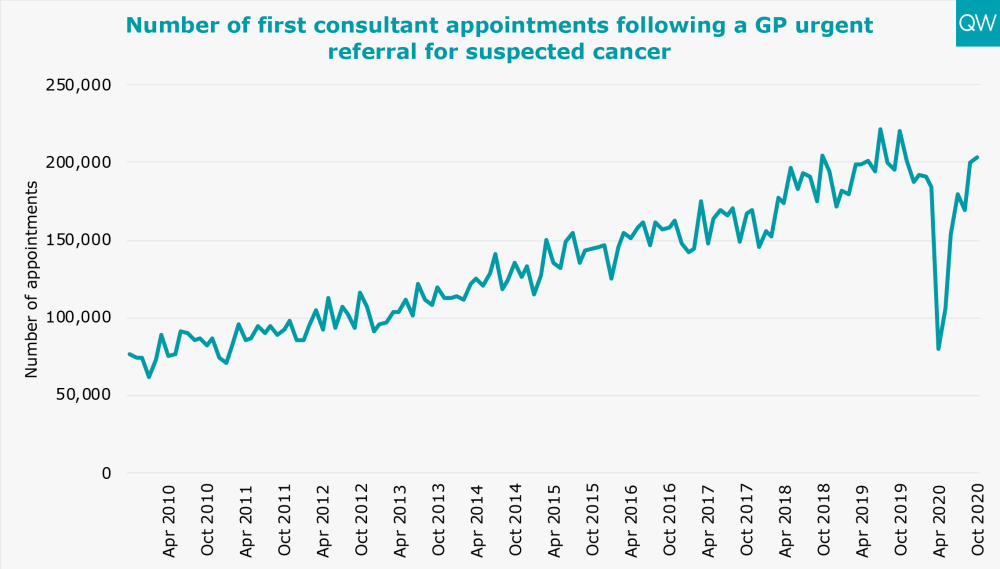
- 203,704 patients had a first consultant appointment for suspected cancer in October 2020 following an urgent GP referral– 8% lower than in October 2019. This follows a substantial drop to less than 80,000 first consultant appointments in April 2020.
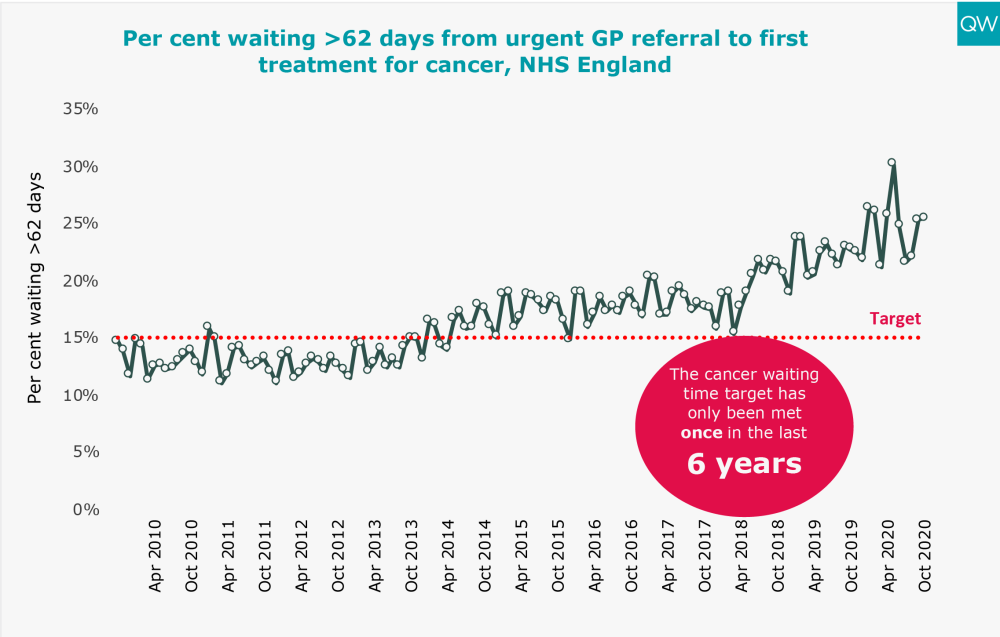
- In October 2020, one in four patients (25%) waited longer than two months to start their first treatment following an urgent GP referral for suspected cancer. The 62-day cancer target has not been met for over four and a half years.
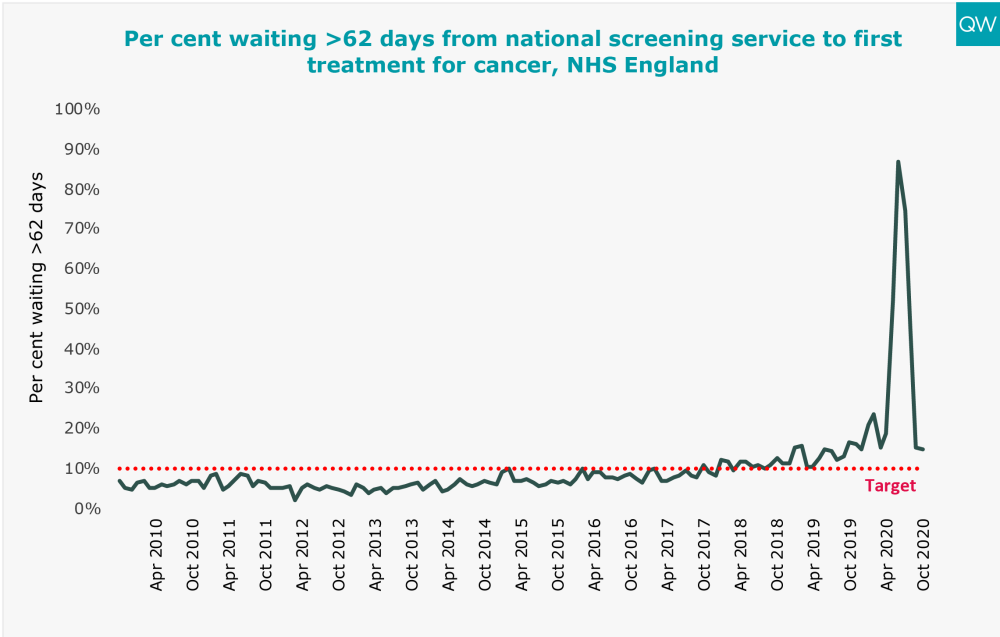
- The percentage of patients who waited longer than two months to start their first treatment for cancer following a referral from a national screening service remained constant at 15% in October 2020, following the recent worsening to 87% in June 2020. The waiting time target has not been met for over two and a half years.
- 1,066 people started a first treatment for cancer in October 2020 following a referral from a national screening service – 47% lower than in October 2019
For more information, see our cancer waiting time targets indicator.