
Headlines
- The waiting list for planned hospital care grew to almost 6 million in October, with over 5% of people waiting for over a year.
- The number of two year waiters for planned care increased to 16,225, further from the target to eliminate them by March 2022.
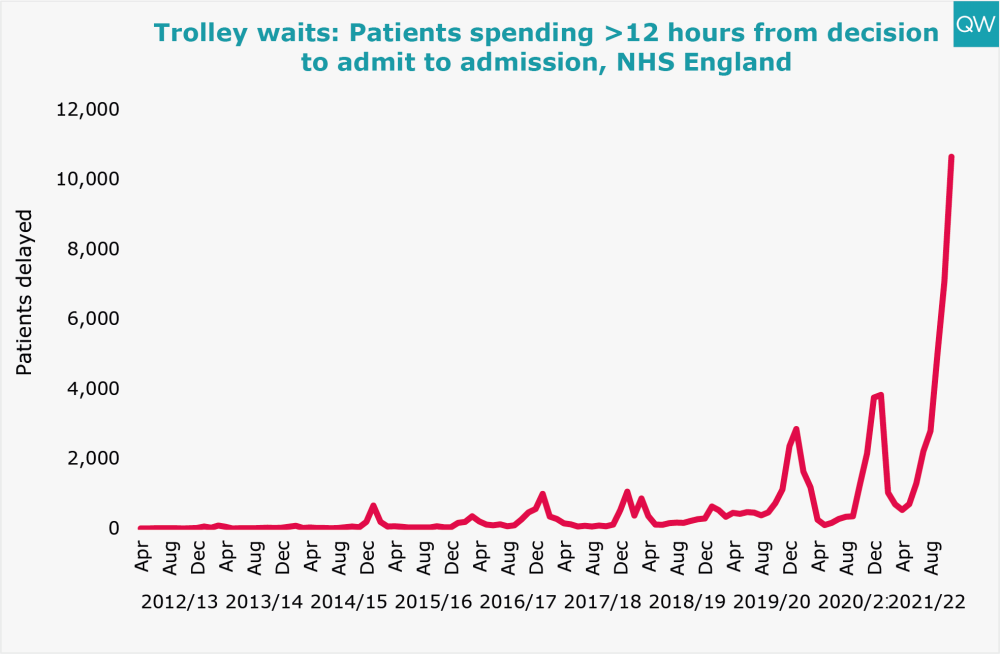
- 10,646 patients spent more than 12 hours waiting on a trolley from a decision to admit to admission in November 2021, five times higher than in November 2020.
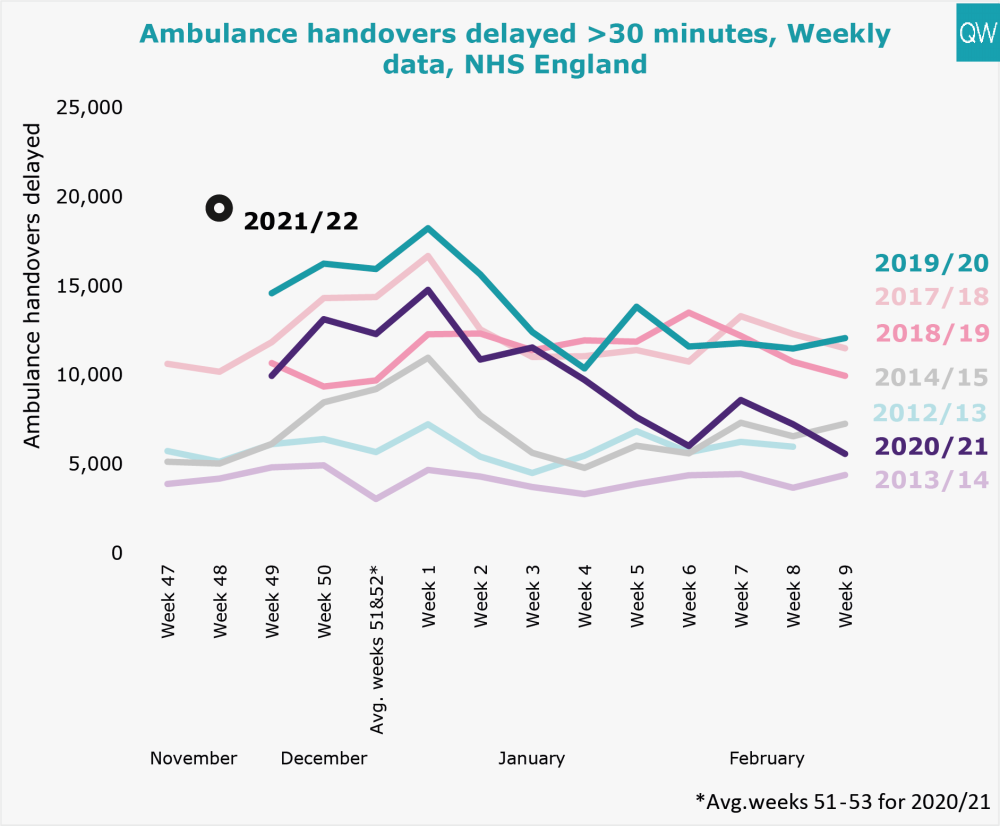
- There were 19,366 ambulance handover delays of over 30 minutes in the week beginning 29 November 2021, the highest for any week reported compared to previous winters.
Today, NHS England published the latest data on key activity and performance measures for October and November of this year. Urgent and Emergency Care Daily Situation Reports were also published for the week beginning 29 November, giving a more up-to-date analysis of how the NHS is coping this winter. Here we show the performance against some key targets, including those set out in the 2021/22 operational planning guidance published in September.
Planned hospital care and diagnostics
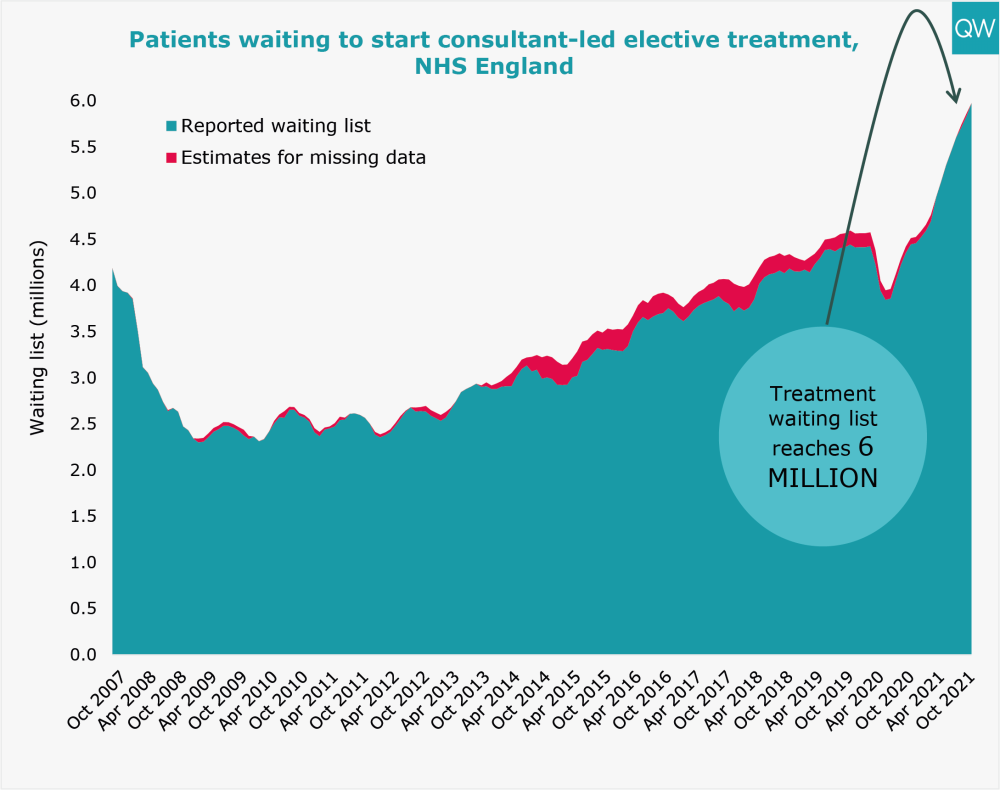
- The total number of people waiting to start consultant-led elective treatment increased to almost 6 million in October 2021, the highest level since records began.
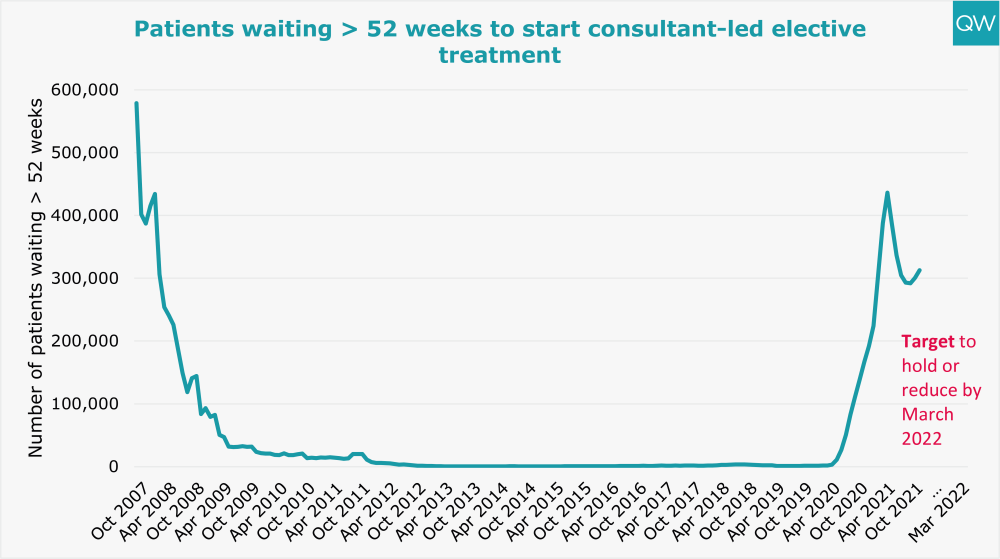
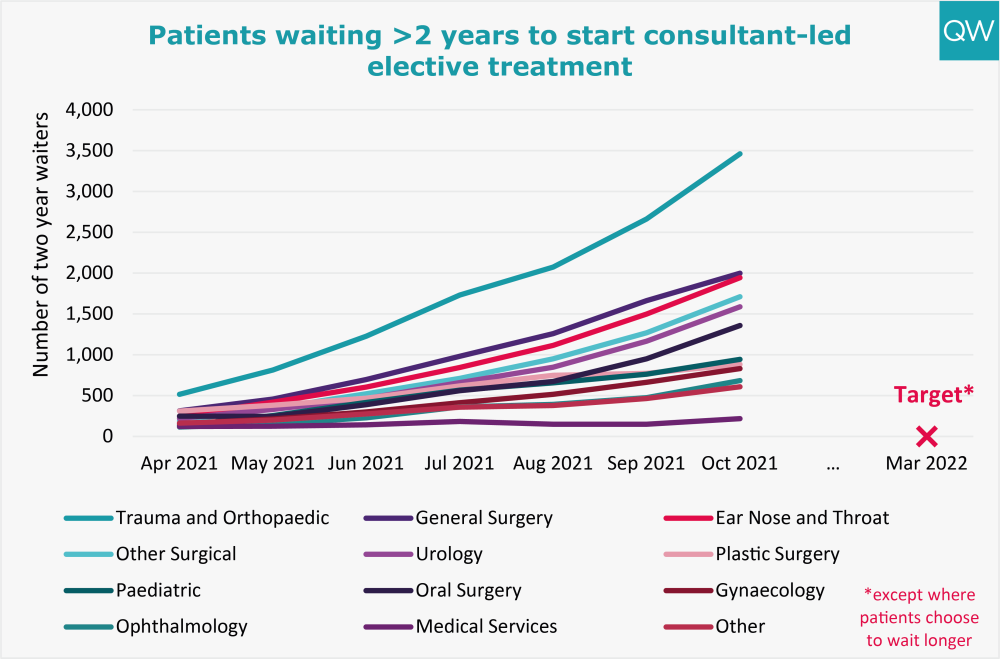
- The number of people waiting over 52 weeks to start elective treatment increased to 312,665 in October 2021, and the number waiting over two-years increased to 16,225.
- The specialties with the highest number of long-waiters were trauma and orthopaedics, general surgery, and ear nose and throat.
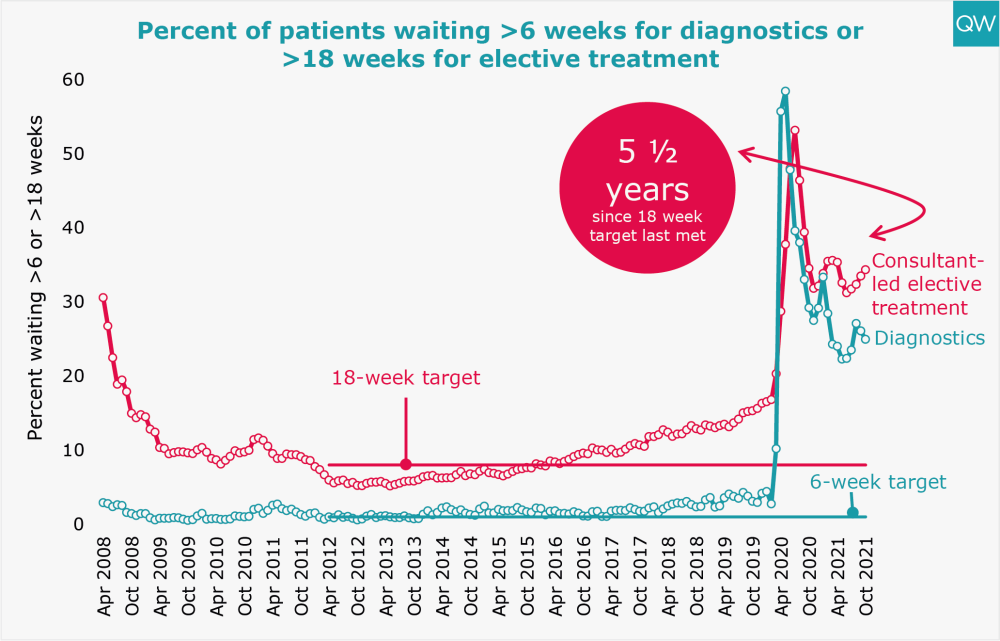
- Over a third of patients (34%) had been waiting over 18 weeks to start elective treatment in October 2021, and one in four patients (25%) had been waiting over six weeks for a diagnostic test.
Planned hospital care and diagnostics
- The total number of people waiting to start consultant-led elective treatment increased to almost 6 million in October 2021, the highest level since records began.
- The number of people waiting over 52 weeks to start elective treatment increased to 312,665 in October 2021, and the number waiting over two-years increased to 16,225.
- The specialties with the highest number of long-waiters were trauma and orthopaedics, general surgery, and ear nose and throat.
- Over a third of patients (34%) had been waiting over 18 weeks to start elective treatment in October 2021, and one in four patients (25%) had been waiting over six weeks for a diagnostic test.
For more information, see our treatment waiting times and diagnostic test waiting times indicators.
Accident and Emergency
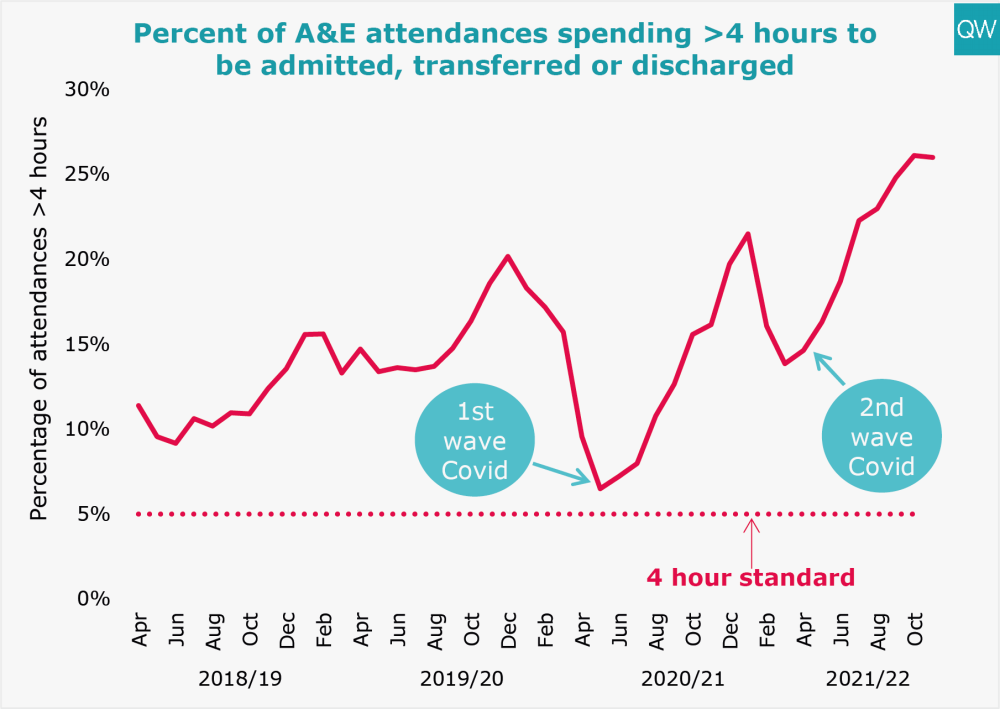
- In November 2021, 26% of people attending A&E spent more than four hours from arrival to admission, transfer or discharge.
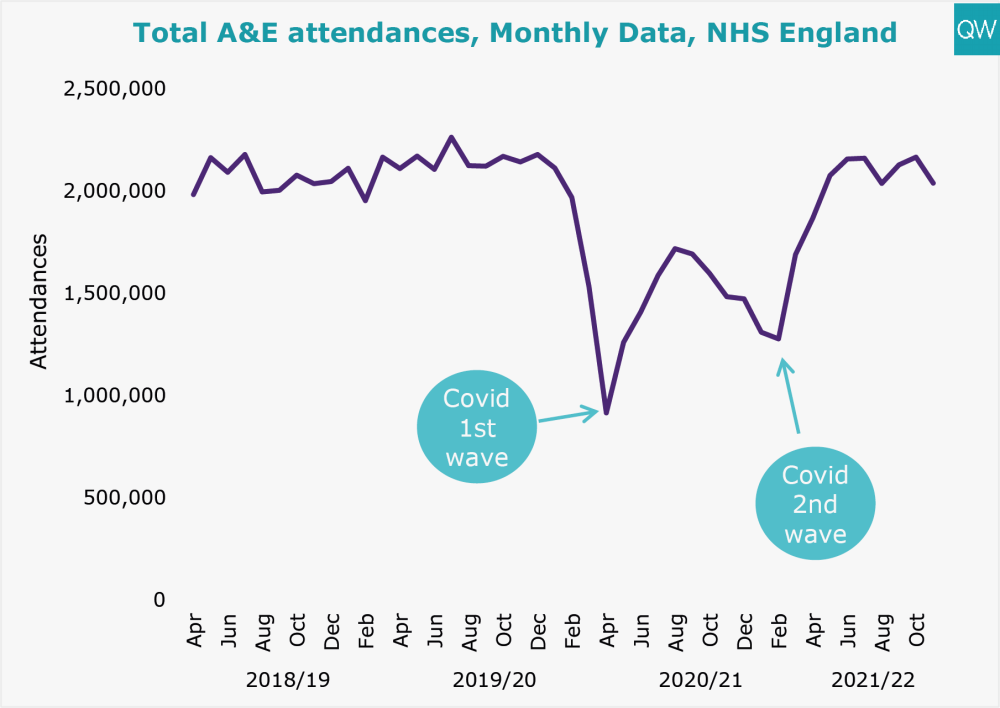
- There were over 2.1 million A&E attendances in November 2021 – 0.2% lower than pre-pandemic levels in November 2019.
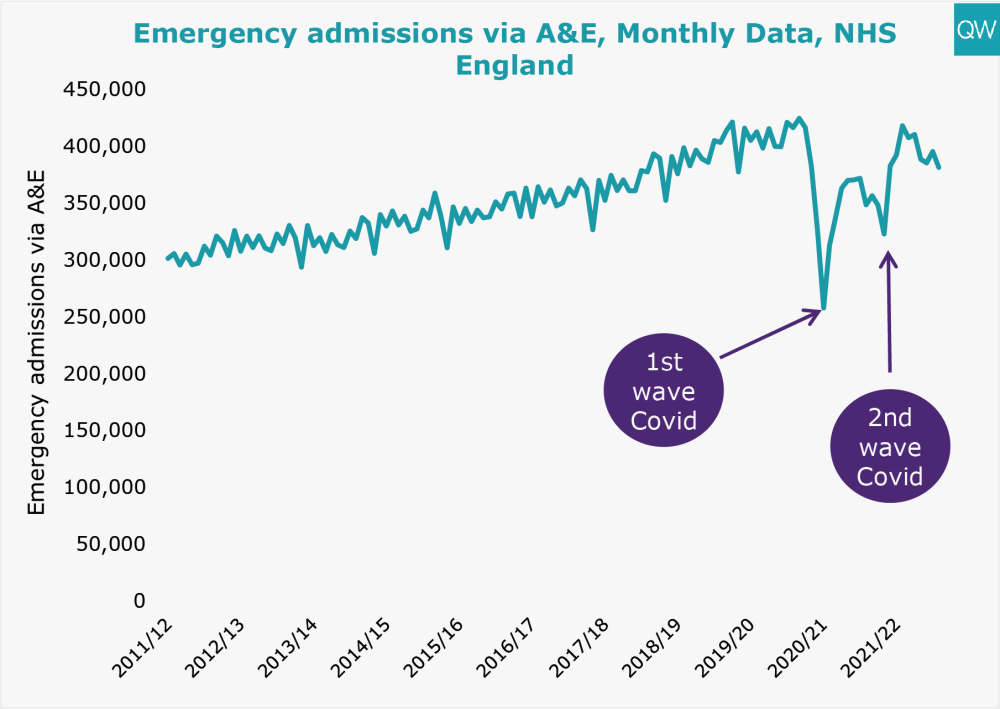
- In November 2021, emergency admissions to hospital via A&E decreased on the previous month to 381,495 – 8% lower than pre-pandemic levels in November 2019.
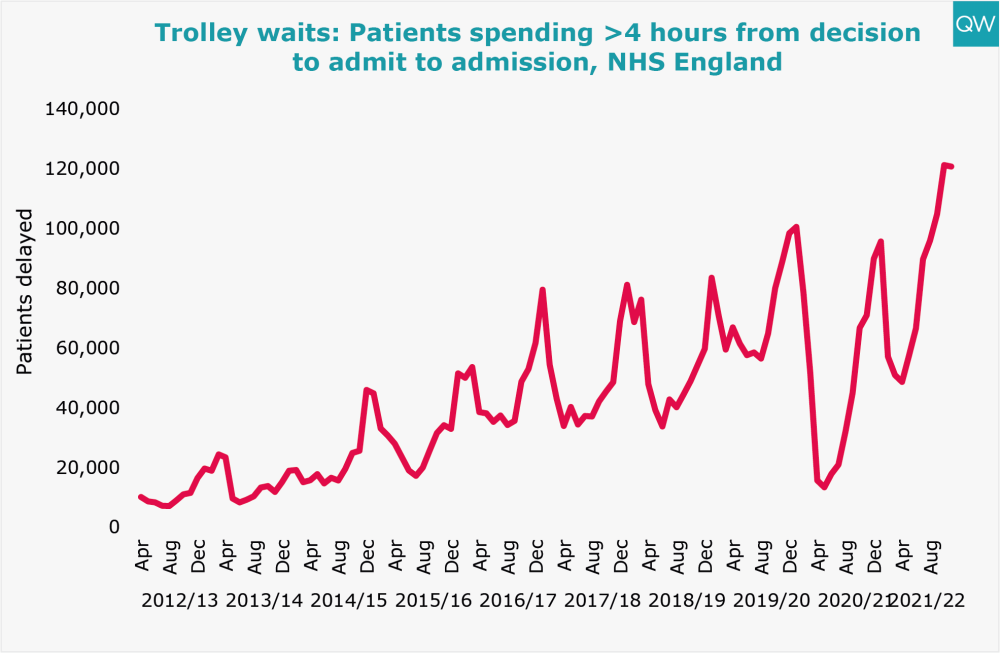
- 120,749 patients spent more than four hours waiting on a trolley from a decision to admit to admission in November 2021, 502 patients less than the previous month but significantly higher than previous years.
- 10,646 patients had a trolley wait of over 12 hours – five times higher than in November 2020 and over nine times higher than in November 2019.
For more information, see our A&E waiting times indicator.
Ambulance handover delays
- In Week 48 of 2021 (commencing 29 November) 19,366 ambulances experienced a handover delay of over 30 minutes, the highest ever on record. Of these, 8,211 ambulances experienced a handover delay of over 60 minutes, which is also the highest number since the data has been published.
Bed occupancy
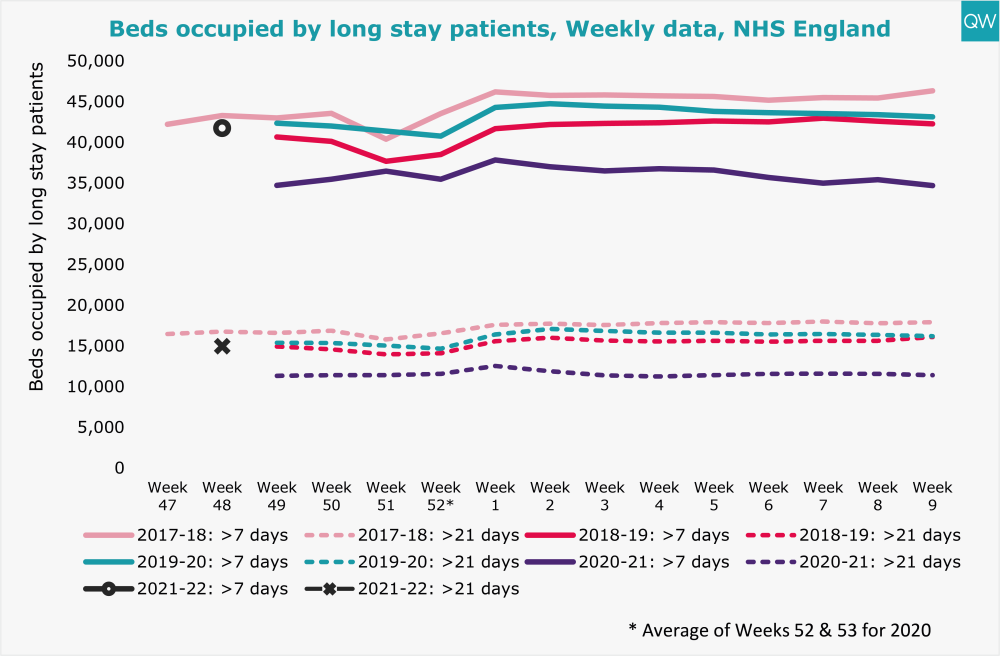
- New data has been published on patients ready for discharge. In Week 48, 45% of patients who meet the NHS’s criteria for being able to leave hospital were discharged, falling to 12% of people who had been in hospital for over 21 days.
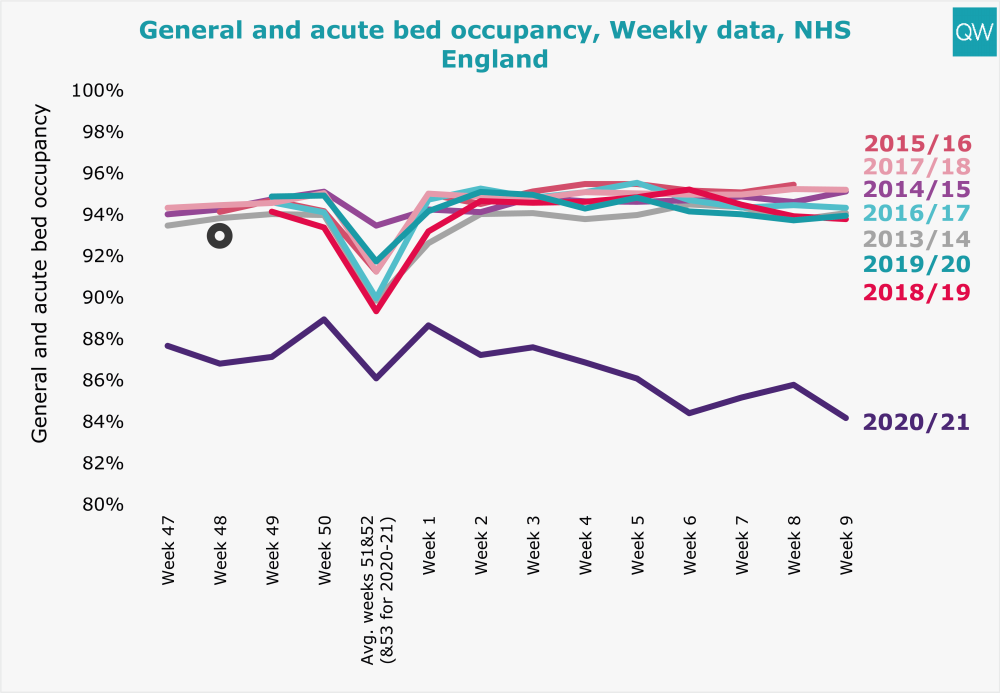
- In week 48 of 2021 (commencing 29 November), 93% of general and acute beds were occupied. There was an average of 94,667 general and acute beds available each day – 6% more than in Week 48 of 2020 but 2% lower than in Week 48 of 2019.
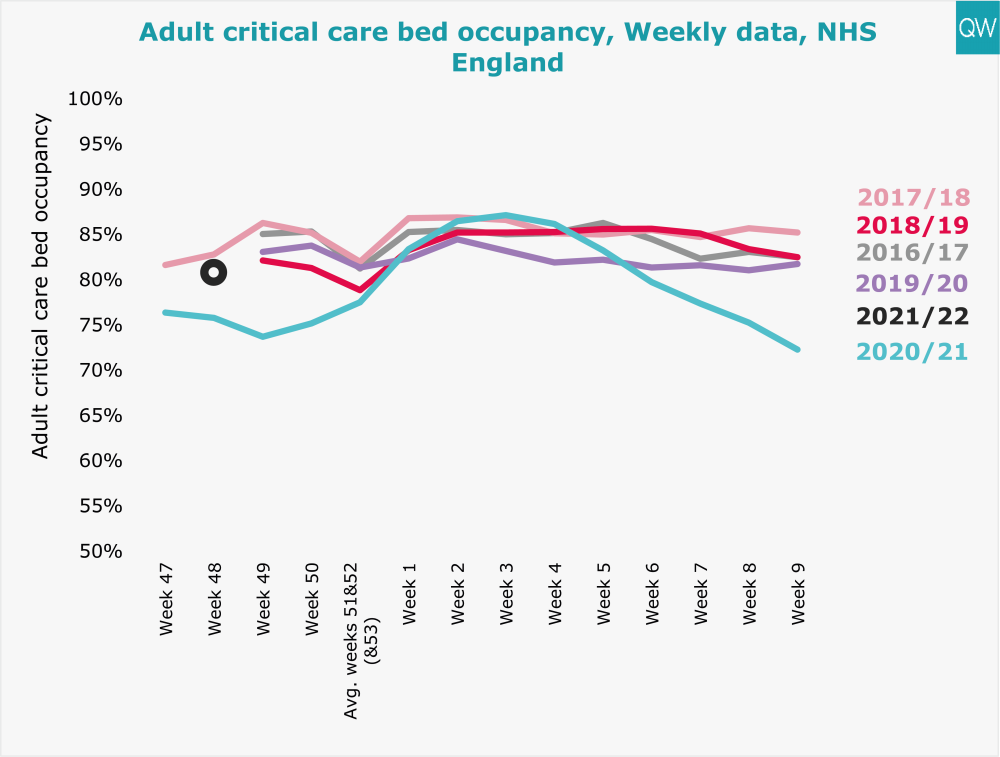
- In Week 48 of 2021, an average of 81% of adult critical care beds were occupied. There was an average of 3,995 critical care beds available each day, 9% fewer than in Week 48 of 2020.
- In Week 48 of 2021, an average of 41,750 beds were occupied by patients who had been in hospital for over 7 days, and 14,958 beds were occupied by patients who had been there for over 21 days.
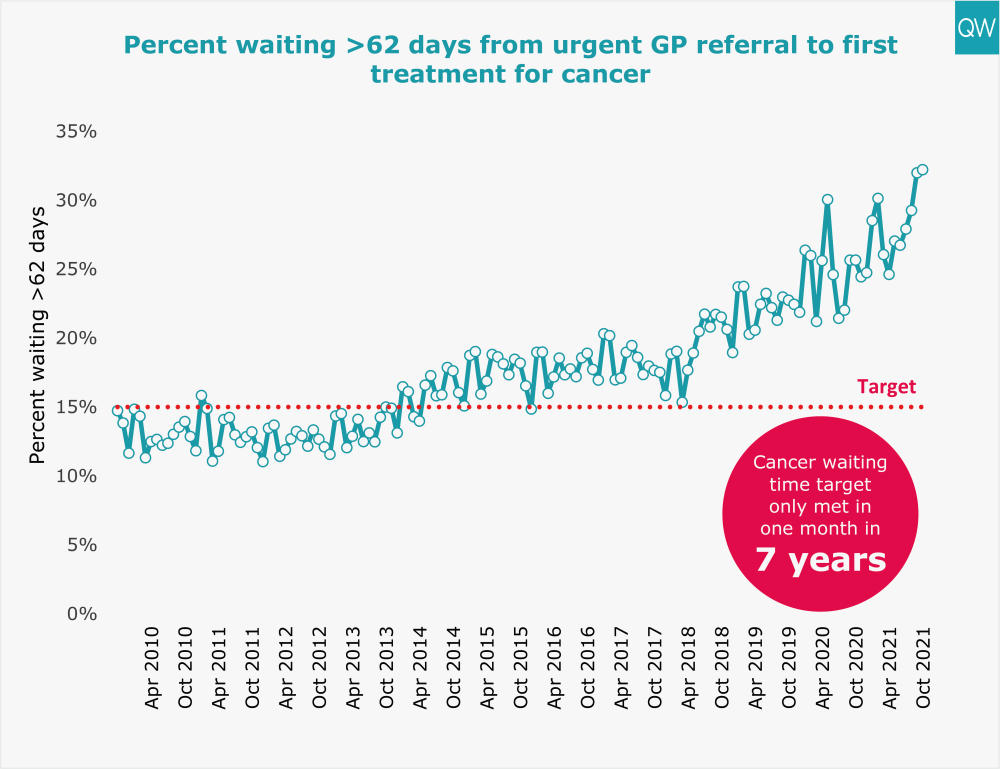
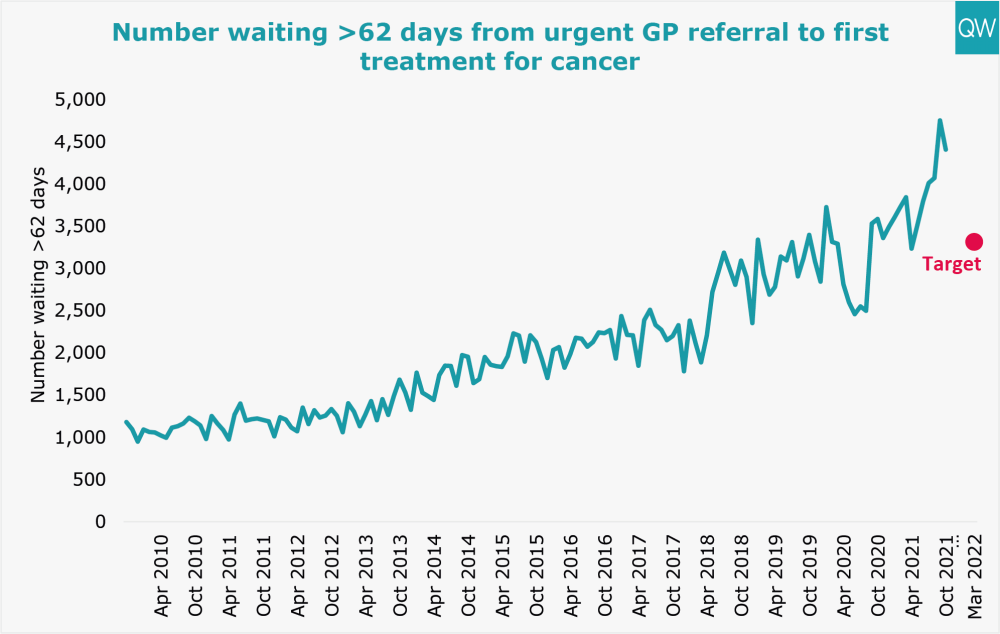
Cancer waiting times
- In October 2021, 4,410 patients (32%) waited longer than two months to start their first treatment for cancer following an urgent GP referral.
For more information, see our cancer waiting time targets indicator.
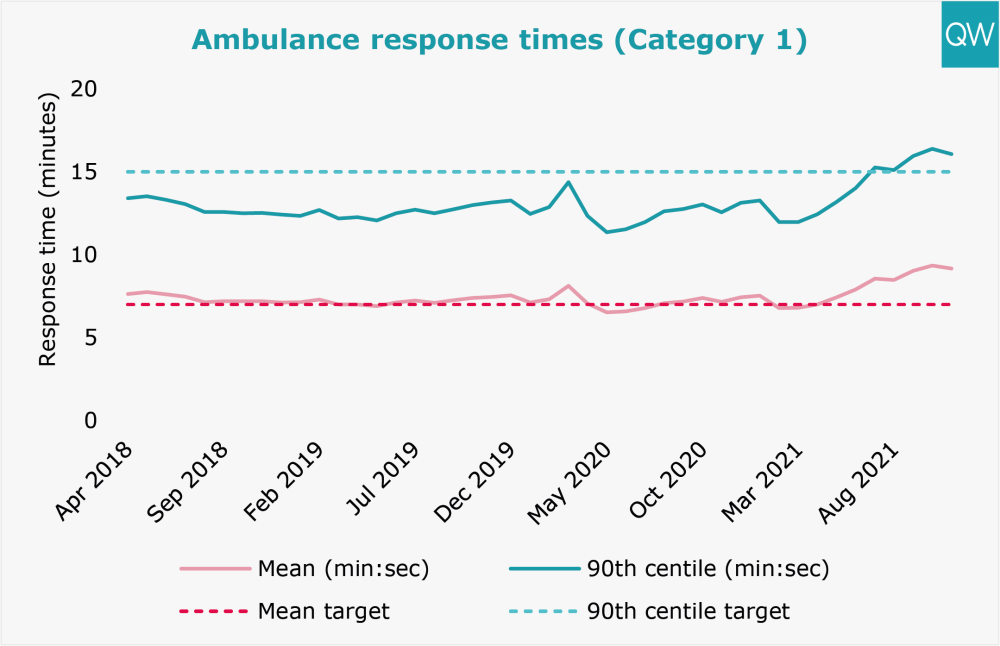
Ambulance response times
- In November 2021, the average response time for Category 1 (life-threatening) ambulance incidents improved slightly to 9 minutes 10 seconds (mean target of 7 minutes).
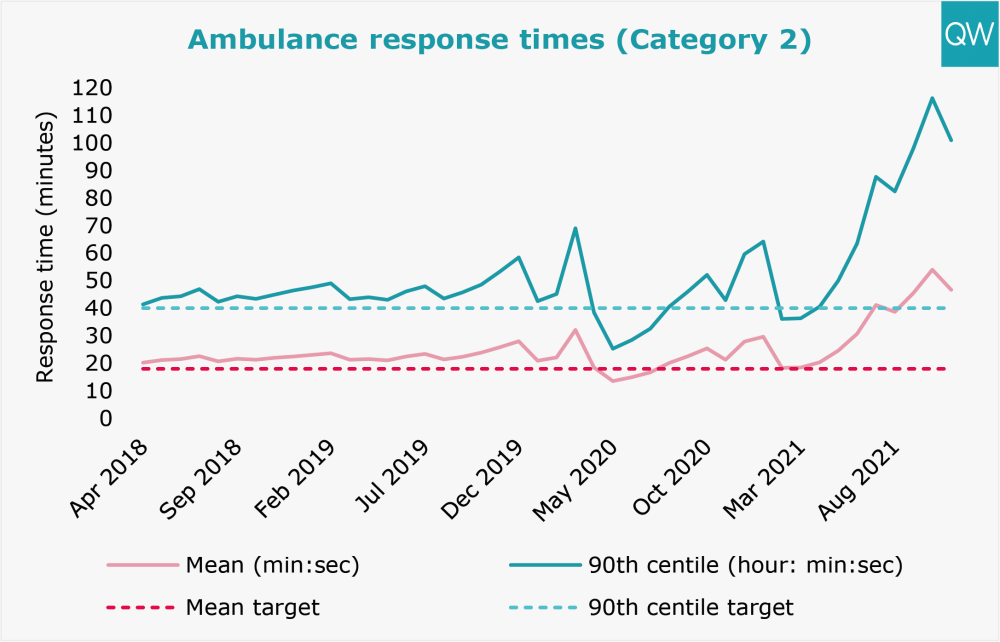
- The average response time for Category 2 (emergency) incidents decreased to 46 minutes 37 seconds in November 2021 (mean target of 18 minutes). The 90th centile reached 1 hour 41 minutes, surpassing the target of 40 minutes.
For more information, see our ambulance response times indicator.
About this data
During this unprecedented time for the health service, QualityWatch continues to provide independent scrutiny of the health and social care system as far as possible. The most recent data published today reflects changes in access and service use as a result of the coronavirus (Covid-19) pandemic. In light of these shifts in activity, we have added new charts and changed the presentation of some of our usual charts, to aid interpretation. It is also worth noting that NHS England have suspended data collection for some of their performance statistics, including delayed transfers of care.
In March 2019, the Clinically-Led Review of NHS Access Standards Interim Report was released, proposing some significant changes to many of the targets reported on here. A six-month Progress Report from the NHS Medical Director was also published in October 2019. Field testing of the proposed new standards began in 2019 and NHS England has recently consulted on the recommendations for urgent and emergency care.
For urgent and emergency care, the field test sites have not been submitting four-hour performance data since May 2019. The time series presented here excludes the field testing sites and so is comparable across months and years. For elective care, performance of the field test sites will continue to be included in the national time series, so the data is fully comparable over time.
For the urgent and emergency care winter sitrep bed occupancy data, 13 acute trusts (trusts without A&E departments) were removed from the totals. This was for comparison purposes as prior to the week ending 20 December 2020 the data did not include these trusts. Further, the general and acute bed occupancy statistics were calculated by totalling the number of adult and paediatric beds, which were published separately. More information can be found on the NHS England website.
For interactive charts showing the quality of health and social care over time, please refer to our 200+ indicators.