Today, NHS England and NHS Digital published the latest data on key activity and performance measures for September and October of this year. Here we show some of these statistics and how they compare with previous trends.
During this unprecedented time for the health service, QualityWatch will continue to provide independent scrutiny of the health and social care system as far as possible. The most recent data published today reflects changes in access and service use as a result of the coronavirus (Covid-19) pandemic. In light of these shifts in activity, we have added new charts and changed the presentation of some of our usual charts, to aid interpretation. It is also worth noting that NHS England have suspended data collection for 2020/21 for some of their performance statistics, including delayed transfers of care and critical care bed capacity.
In March 2019, the Clinically-Led Review of NHS Access Standards Interim Report was released, proposing some significant changes to many of the targets reported on here. A six-month Progress Report from the NHS Medical Director was also published in October 2019. Field testing of the proposed new standards began in 2019, however due to the coronavirus (Covid-19) outbreak, the publication of the review’s recommendations has been delayed until later this year.
For urgent and emergency care, the field test sites have not been submitting four-hour performance data since May 2019. The time series presented here excludes the field testing sites and so is comparable across months and years. For elective care, performance of the field test sites will continue to be included in the national time series, so the data is fully comparable over time.
For interactive charts showing the quality of health and social care over time, please refer to our 200+ indicators.
Urgent care
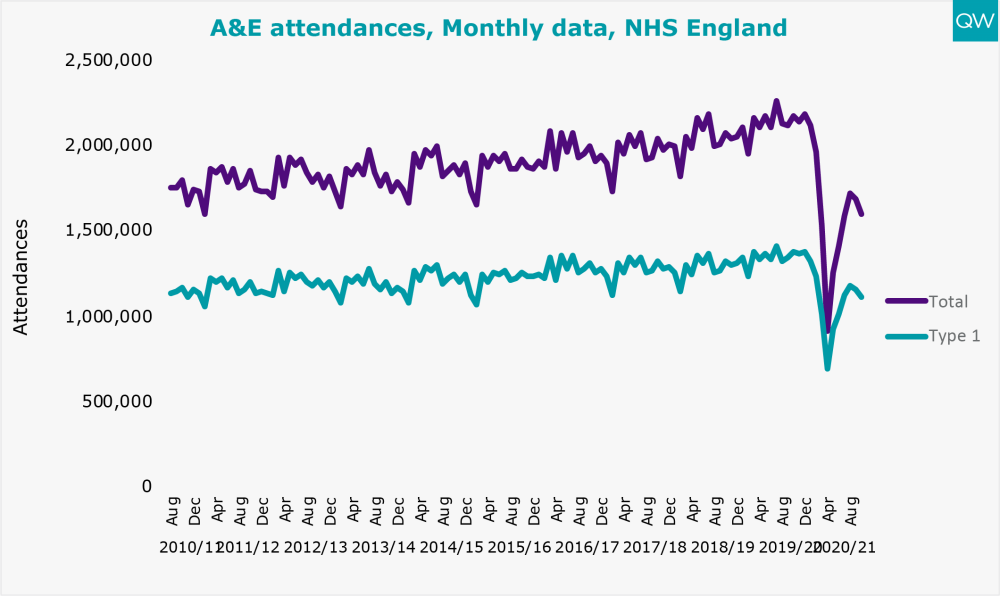
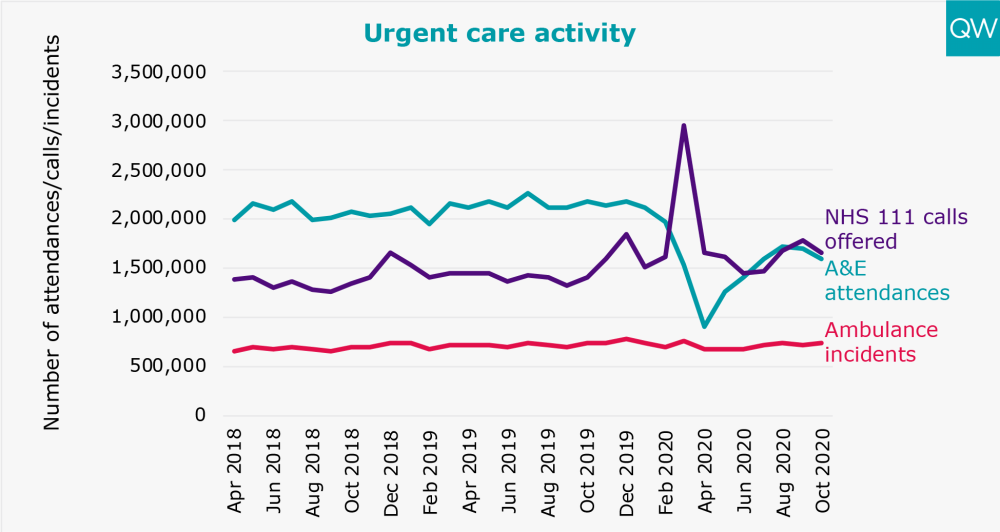
- In October 2020, total A&E attendances fell to just under 1.6 million – 26% lower than in October 2019. This follows a fall to 916,581 in April 2020 and a subsequent increase to just over 1.7 million in August 2020. 1.1 million attendances in October were to major (type 1) departments.
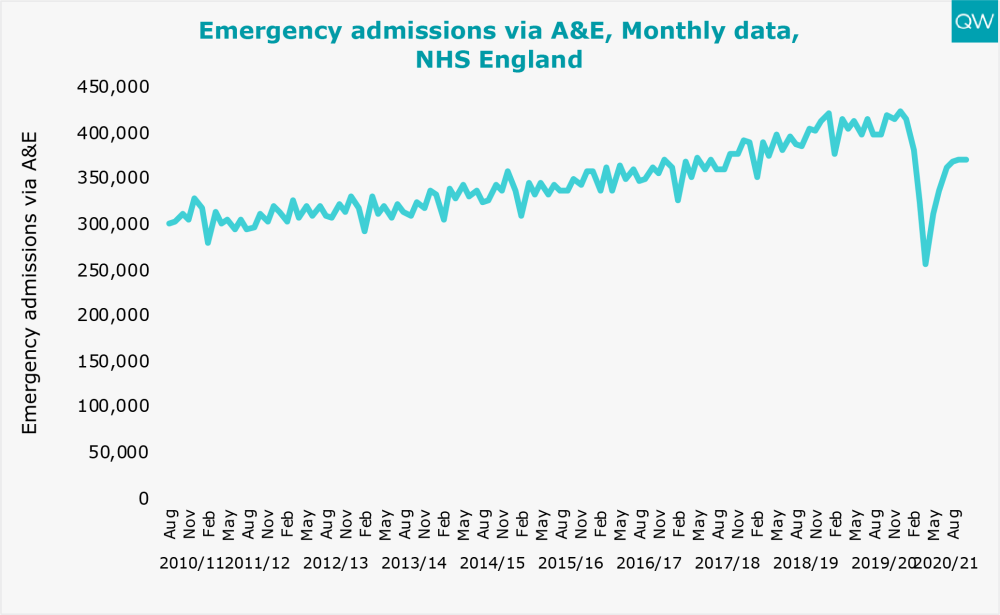
- There were 371,959 emergency admissions via A&E in October 2020. Emergency admissions via A&E have generally been increasing year-on-year, but fell dramatically in April 2020 to 257,928. Since August 2020, emergency admissions have remained roughly constant, despite the slight decrease in A&E attendances over the same time period.
- There were over 1.6 million NHS 111 calls offered in October 2020 – 7% lower than in September 2020. The number of ambulance incidents increased slightly to 745,327.
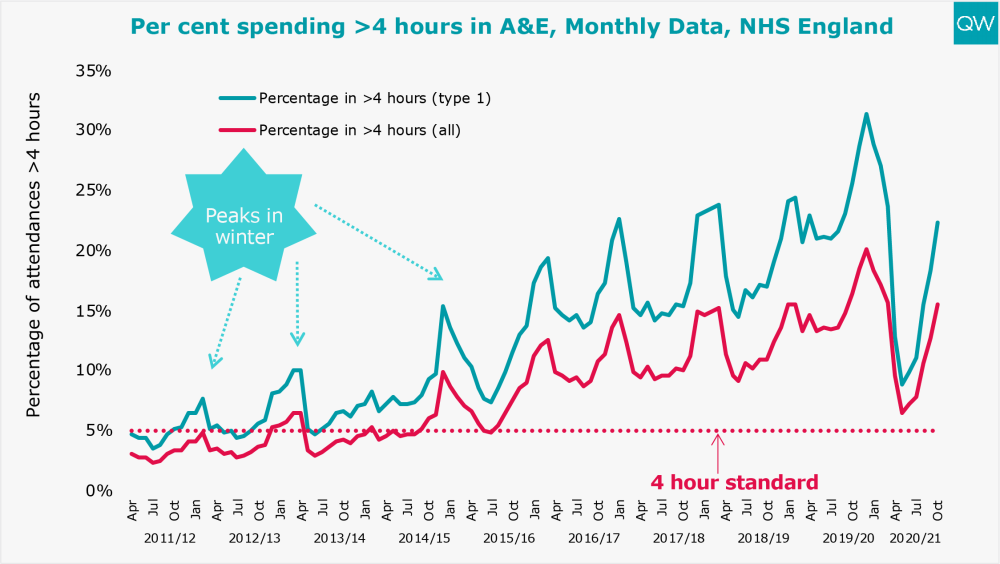
- In October 2020, 16% of people attending A&E spent more than four hours from arrival to admission, transfer or discharge – approximately the same as in October 2019. Waiting times have worsened for the past five consecutive months.
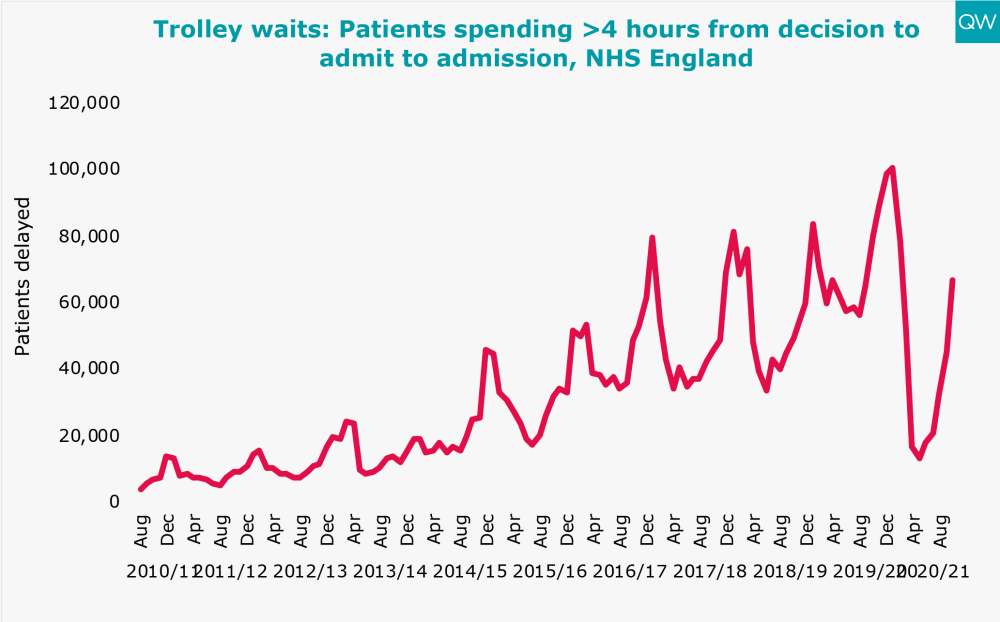
- 66,795 patients spent more than four hours waiting on a trolley from a decision to admit to admission in October 2020 – 17% lower than in October 2019 but 48% higher than in September 2020. 1,267 people had a trolley wait of over 12 hours in October 2020, 75% higher than in October 2019.
- Comparing across urgent care services in the first wave of the Covid-19 pandemic, A&E attendances decreased considerably in March and April while NHS 111 calls peaked at almost 3 million in March. The number of ambulance incidents fluctuated between 650,000 and 800,000.
For more information, see our A&E waiting times indicator.
Treatment and diagnostic test activity and waiting times
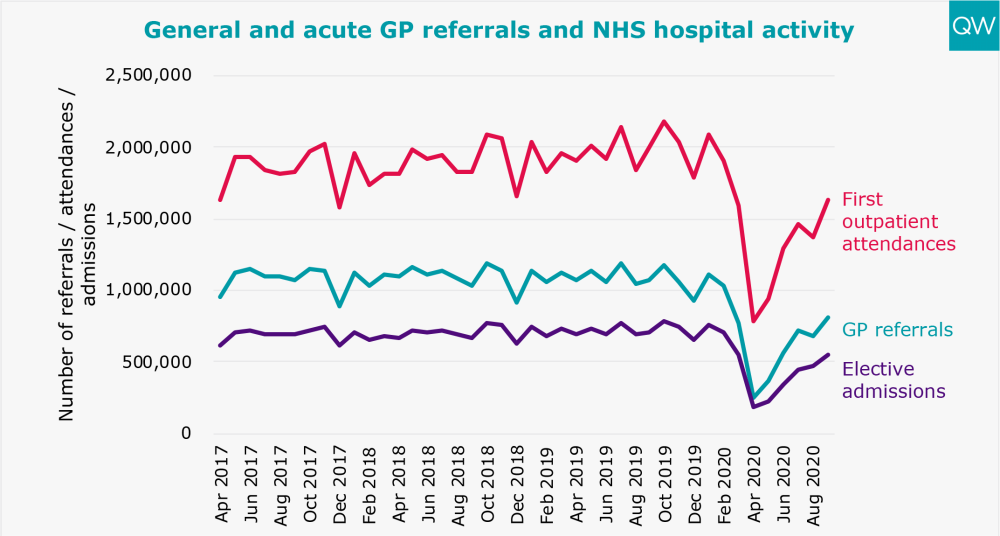
- In September 2020, there were over 1.6 million first outpatient attendances for general and acute specialties – more than double the low of 784,320 in April 2020 but 18% lower than in September 2019. The number of elective admissions increased slightly to 553,933 – 22% lower than in September 2019.
- The number of GP referrals to general and acute specialties increased to 816,700 in September 2020, following the recent fall to 257,850 in April 2020.
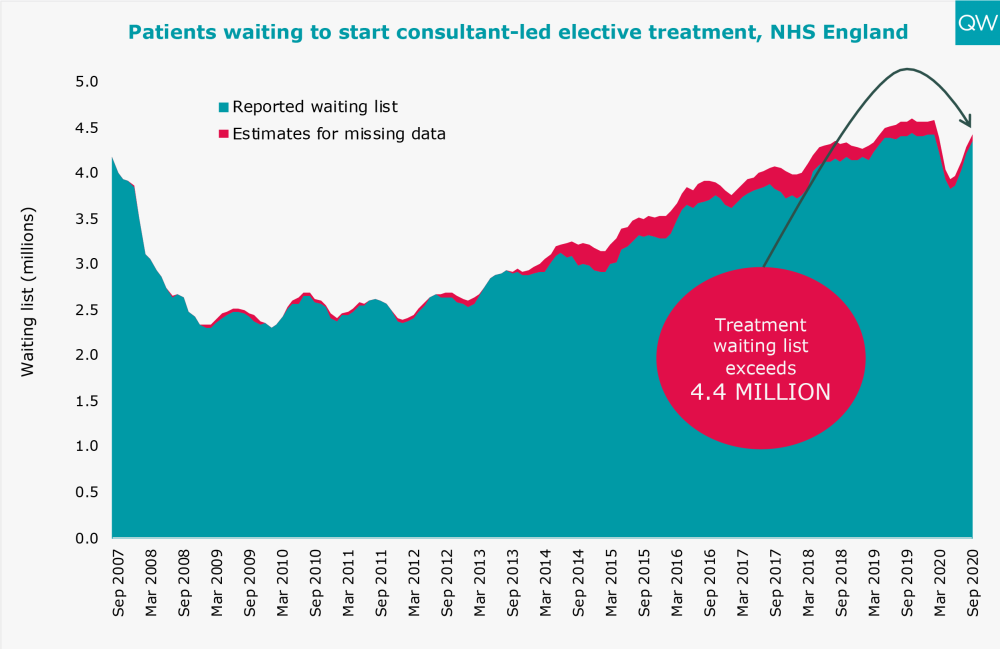
- The total number of people waiting to start consultant-led elective treatment increased to over 4.4 million in September 2020 (reported waiting list plus the estimate of missing data). This follows a previous fall from 4.5 million in February 2020.
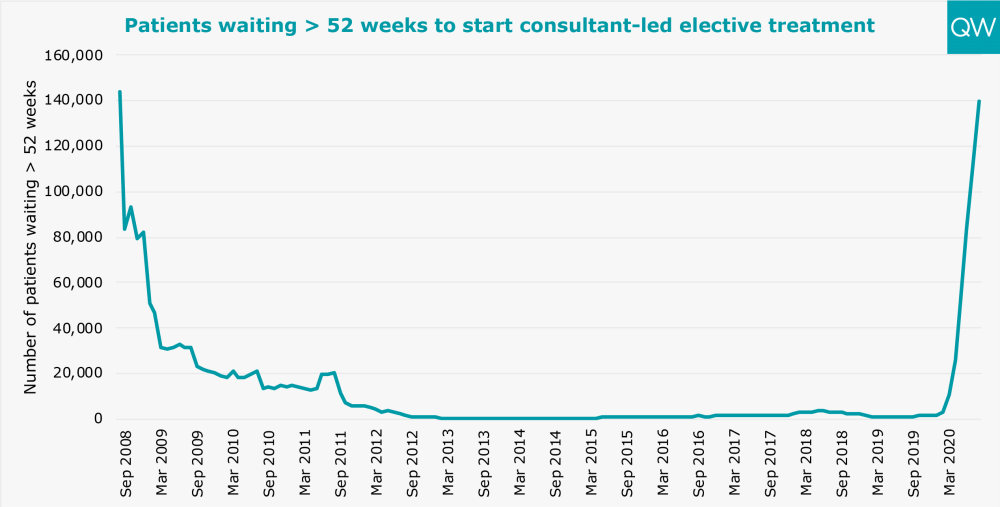
- The number of people waiting over 52 weeks to start consultant-led elective treatment increased to 139,545 in September 2020, the highest level since September 2008.
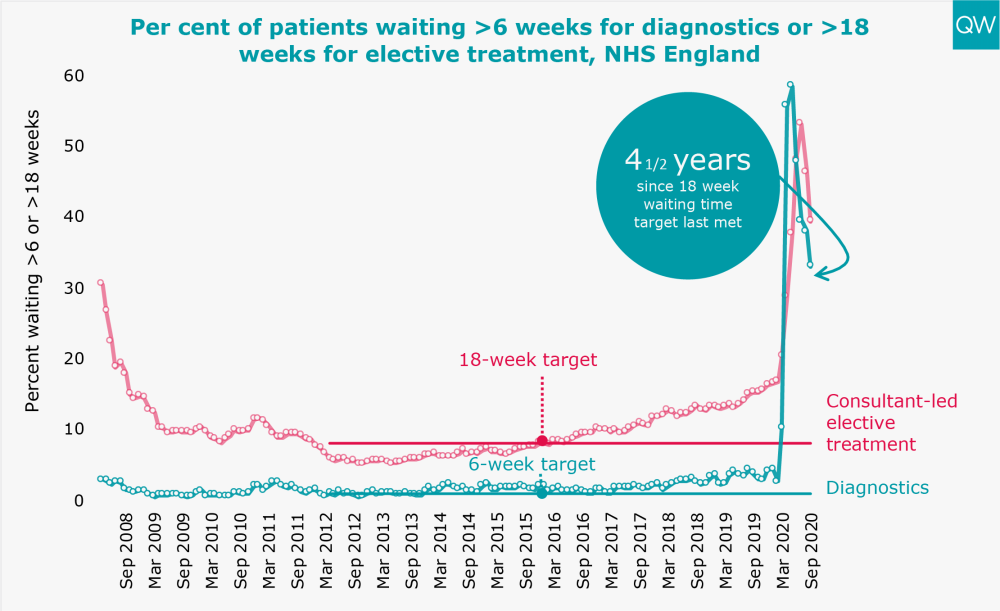
- In September 2020, 39% of people waiting to start elective treatment had been waiting over 18 weeks – a slight improvement of waiting times compared to August 2020. The 18-week target has not been met for over four and a half years.
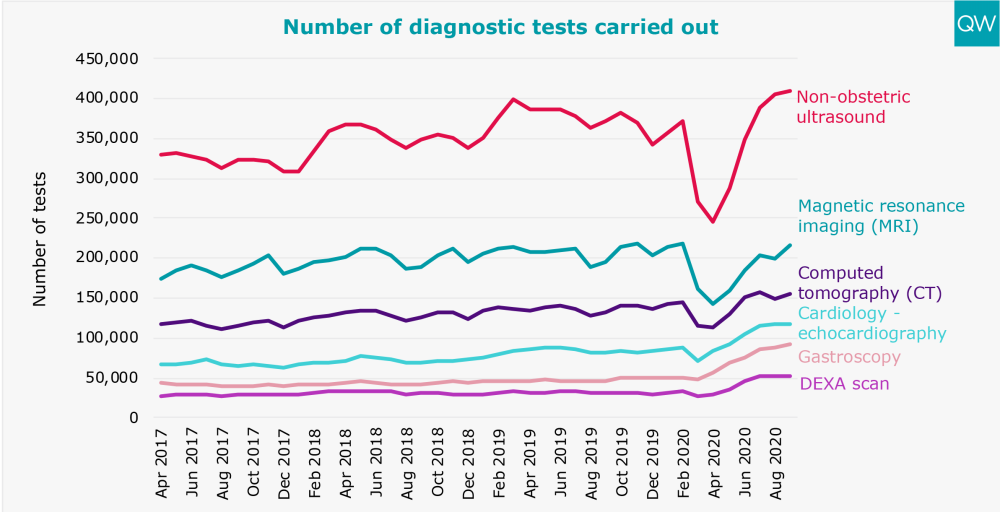
- There were 408,949 non-obstetric ultrasounds carried out in September 2020 (10% higher than in September 2019) and 91,640 gastroscopy tests carried out (almost double the number carried out in September 2019).
- In September 2020, one third (33%) of patients had been waiting over six weeks for a diagnostic test. The diagnostic waiting time target has not been met for over six and a half years.
For more information, see our treatment waiting times and diagnostic test waiting times indicators.
Cancer waiting times
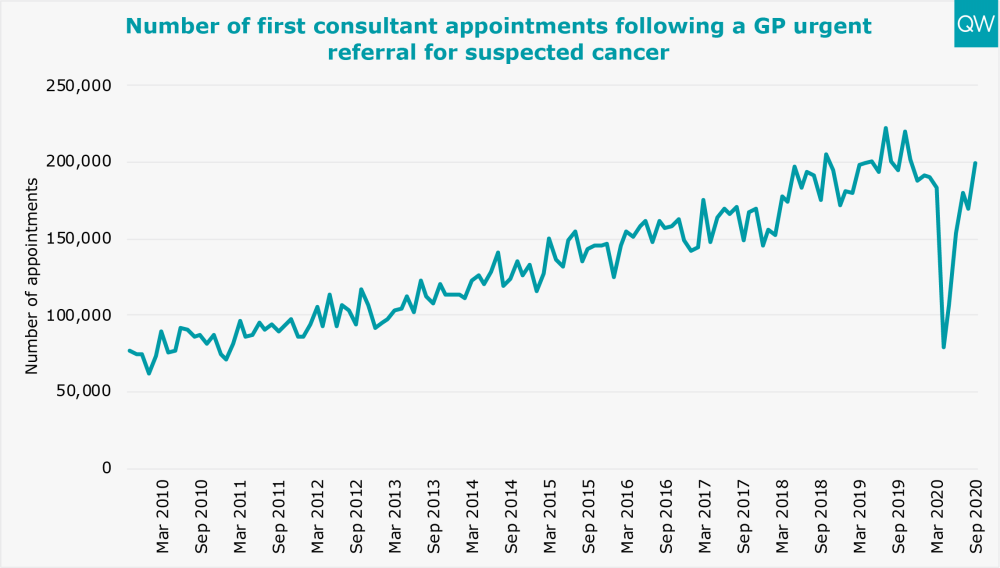
- 199,801 patients had a first consultant appointment in September 2020 following an urgent GP referral for suspected cancer – 2% higher than in September 2019. This follows a substantial drop to less than 80,000 first appointments in April 2020.
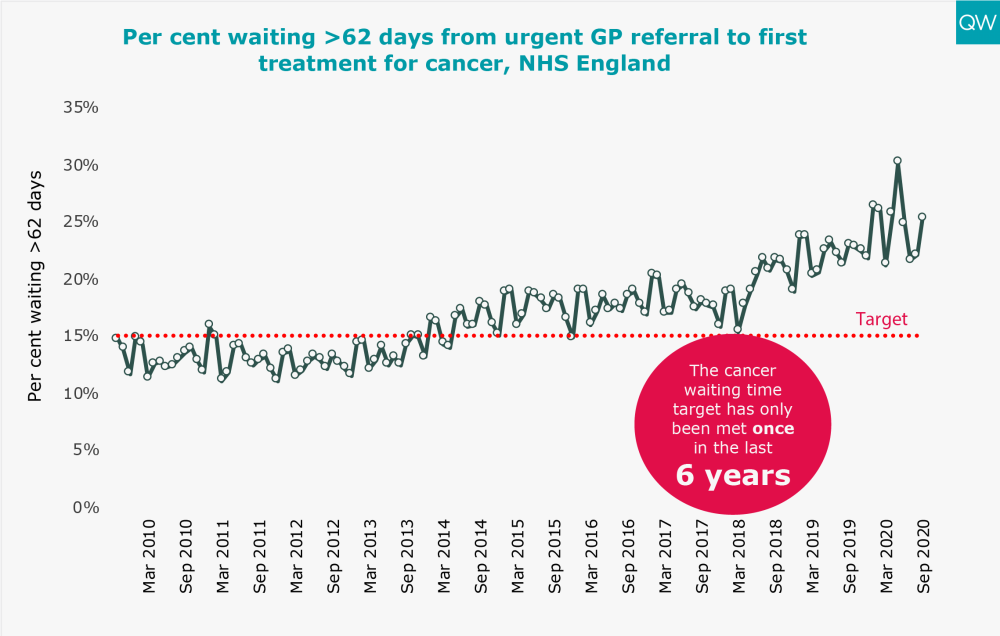
- In September 2020, one in four patients (25%) waited longer than two months to start their first treatment for cancer following an urgent GP referral. The 62-day cancer target has not been met for over four and a half years.
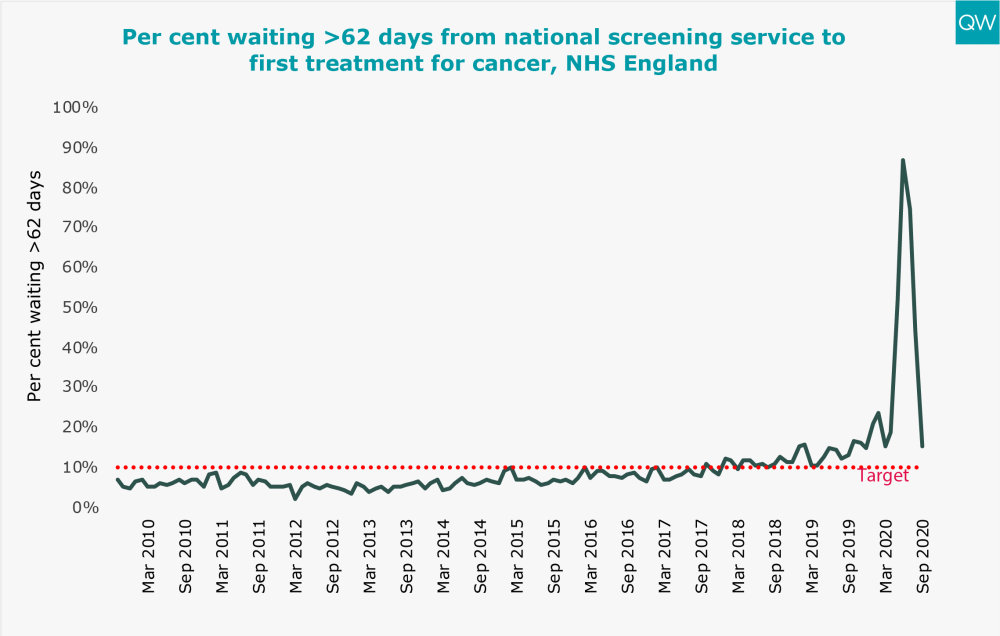
- The percentage of patients who waited longer than two months to start their first treatment for cancer following a referral from a national screening service improved to 15% in September 2020, following the recent decline to 87% in June 2020. The waiting time target has not been met for two and a half years.
- 722 people started a first treatment for cancer in September 2020 following a referral from a national screening service – 61% lower than in September 2019.
For more information, see our cancer waiting time targets indicator.