
NHS staffing levels have become a particularly high profile indicator of the NHS’s capacity to deliver safe and high quality healthcare. These debates have been fuelled by two main drivers in recent years.
First is the “Nicholson Challenge” for the NHS to find £20 billion in savings by 2015 (and more in the future) and as Nuffield Trust research has shown, public sector pay policy is making a significant contribution to delivering this challenge (around 40%).
Many reports have suggested that this has effectively caused job cuts by asking NHS trusts to do more with the same or less, but have also found that productivity has improved.
Second are highly publicised lapses in the quality of the care, such as the Mid Staffordshire NHS Foundation Trust and the subsequent Francis Inquiry resulting in a focus on safe staffing levels in hospitals and a requirement for hospitals to publish the number of staff on wards on a daily basis from April 2014.
Nuffield Trust’s study The Francis Report: one year on found the importance of adequate staffing levels resonated with hospital leaders, but they described how meeting both financial goals and ensuring safe staffing levels in hospitals was very difficult–and would only get harder in the future.
So what is happening to NHS staffing levels?
As part of the Nuffield Trust and The Health Foundation’s QualityWatch programme we use the NHS Workforce Statistics to regularly track and review NHS staffing levels.
We have observed that from 2002 the total numbers of all NHS staff increased steadily, but from 2010 total staffing started to decrease.
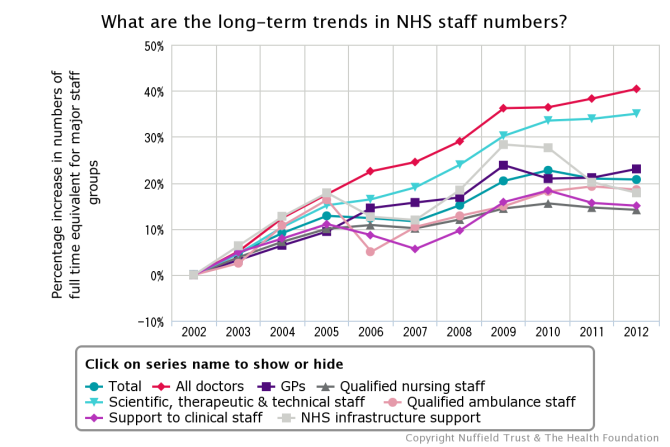
View an interactive version of this chart.
However, the increases are greater for some staff groups and do not all follow the same pattern as the total numbers. For example the numbers of qualified nursing staff increased less overall than the other staff groups, and levelled out between 2010 and 2012–a 15% increase over the decade compared to 40% in all doctors.
You can explore changes in nursing levels in more detail, by using the monthly statistics published since September 2009 to look at the shorter term trends (see the chart below).
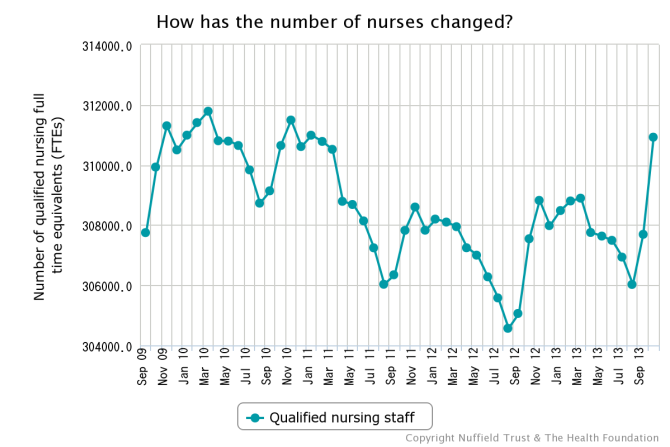
View an interactive version of this chart.
Despite the numbers of nurses not remaining static over the period, overall, between September 2009 and September 2013 there was actually very little change in total number of qualified nurses between the two dates (September 2009 - 307,749 FTEs and September 2013 - 307,692 FTEs).
The good news is that more recently from August 2013, numbers of NHS nurses seem to be increasing again which may be in response to the Francis Report and the subsequent national spotlight on the issue.
However, tracking changes is complicated by the annual fluctuations in qualified nurses, linked with training programmes, so there is a need to be wary of crude month by month comparisons.
This results in peaks in November of each year, starting with an increase in September followed by subsequent decreases, which can drop to levels lower than at the start of the peak. Therefore, further information after this date would be required in order to observe to what extent this is sustained over time.
So what is happening to NHS staffing levels?
Also unpicking the total nurse figures reveals some interesting challenges ahead. We are in an era that is seeking better integration of care to reduce the need for acute care, and investing in preventive and community-based alternatives could be for the best of the patients and possibly cheaper. So it is a surprise that despite this, the number of community-based nurses has actually decreased to 45,943 – a drop of 4.5%.
Similarly in recent years there has also been a commitment to put mental health on a parity with physiological healthcare, yet nurses in non-community psychiatry has fallen from 26,299 in September 2009 to 23,051 in October 2013, a 12.4% decrease over four years.
Of course we have to recognise that good quality care is more than just staffing levels. However, it does seem that though the past year has had some positive impact on overall nursing levels; outside of acute hospitals the numbers of nurses in specific groups seem to suggest a mismatch between the aspirations for better preventive, community and mental health care, and nursing capacity.