
")
Summary
NHS staff are working in a heavily resource-constrained environment and facing increasing demand for care. In this report we examined 15 key indicators of performance of the NHS in England over the most pressured time of year – winter (November to March) – focusing on 2014-2015, as well as looking back over the last five years. At the time of analysis, data for the winter 2015-16 were not yet available. While the winter of 2014–15 was mild, in some areas the performance of the NHS deteriorated, and in others it held up.
- Acute services in the NHS are under strain on several measures. A&E attendances each year are increasing – 7% over the last five years. The number of beds available in hospitals has decreased by a similar percentage over the same period, and bed occupancy is rising each winter. The average daily number of beds closed due to a delayed transfer of care (delays in a person being discharged from hospital) is increasing each winter (nearly 4000 in 2014-15 compared to 2500 in 2011-12). While the numbers of staff in the NHS have increased each year, there is a peak in sickness absence in winter which means a dip in full-time equivalent capacity at times of greatest strain.
- Pressure normally seen during the winter months is increasingly visible at other times of the year. For example, the number of people waiting more than four hours on trolleys in A&E at the end of summer 2015 was higher not just than in any of the previous four summers studied, but also higher than in any of the four winters before 2014–15.
- The performance of the NHS in winter 2014-15 deteriorated in some areas. For example, the number of ambulances queuing outside A&E departments increased to 96,150 during the time period studied, compared to a fairly steady 60,000 in the previous winters. This peaked over the Christmas and New Year period. The proportion of patients waiting longer than four hours in A&E, the number waiting longer than 12 hours for a bed after a decision to admit to a ward, and response times to calls for an ambulance all grew, again particularly during December.
- But some measures of performance in acute care – such as the average length of time patients spend in A&E; the number of cancelled operations; temporary diversion of patients to other A&E departments to provide temporary respite; and unplanned, unilateral closure of an A&E department to admissions – did not deteriorate in 2014–15 compared with the previous four winters.
- While the trend in the number of people attending A&E units each year is increasing, fewer people attend during winter compared to the rest of the year. But of those who do attend there is a larger proportion of older people attending and a larger proportion of people requiring an emergency admission to hospital.
- The pressure on primary and community services in winter is largely unquantifiable at a national level because of a lack of available data.
1. Understanding winter pressures
What are winter pressures?
Starting in early December each year, so-called NHS ‘winter pressures’ make the headlines. Attention tends to be focused on the performance of A&E units. However, winter pressures should be understood more broadly than simply what happens in an A&E unit. The term refers to how hospitals cope with the challenges of maintaining regular service over the winter period.
Winter is a time where additional illnesses (such as ‘flu and norovirus) and colder weather can affect the most vulnerable groups in society. This results in reduced health and wellbeing in these groups, with a greater number of people dying in winter each year (NICE, 2015). Most excess winter deaths and illnesses are not caused by the extremes of cold, but by respiratory and cardiovascular problems during normal winter temperatures, when the mean outdoor temperature drops below 5–8°C. These additional illnesses put further pressure on services that is not experienced during other seasons.
What makes a ‘bad’ winter?
Weather, economics, politics and the broader health agenda can all contribute to how the NHS faces up to the pressures of the winter months.
We might expect particularly cold winters to put additional pressure on health services as the most vulnerable struggle to keep warm and well. Winter weather has a direct effect on the incidence of heart attack, stroke, respiratory disease, ‘flu, falls and injuries and hypothermia (NICE, 2015).
A difficult financial climate can also add to the problems as people struggle to heat their homes. This is especially the case for older people, who are more likely to ration energy use on a limited budget (Department of Energy and Climate Change, 2014).
Over the last few years, the Government has provided the English NHS with funding during winter to help tackle seasonal pressures (Figure 1.1). The largest injection of funding was supplied in November 2014, with £700 million put aside specifically to target ‘seasonal variations’, with the aim of providing more bed space and additional clinical staff (Department of Health, 2014).
Source: ONS, 2015; Met Office, 2015
In this report we explore what effect winter pressures have had on NHS acute care over the last five winters (with 2014–15 being the most recent). The report uses publicly available data to assess winter pressures and their impact. A list of the data sources used is included at the end of the report. All cited references are available as links.
2. Our approach
A vast number of indicators are published throughout the year to monitor the quality of health and social care. The QualityWatch programme tracks the progress of over 300 of these indicators. Combined, they provide an assessment of how the quality of health and care services changes over time and how the services respond to the demands placed upon them.
We tracked 14 of these indicators within the English NHS over the past five years, from the first quarter of the 2010–11 financial year (for data published quarterly) or August 2010 (for data published monthly) to the latest data available.
Following recommendations from Sir Bruce Keogh’s review of waiting time standards to standardise reporting arrangements (NHS England Waiting times standards letter, 2015), as of July 2015 many performance measures are all published on one day each month. These include data covering A&E activity and emergency admissions, ambulances, delayed transfers of care and the NHS 111 minimum data set presented in this report. Data for any given month are published approximately a month and a half after the end of the time period covered. Therefore, at the time that these data sets were accessed and analysed (between 30 November 2015 and 5 January 2016), data were only available for the September/October 2015 period and it was not possible to analyse data for the 2015–16 winter period.
A subset of the 14 indicators described above, as well as some additional ones, are deemed particularly sensitive or pertinent to the winter season. These are collected by NHS England as part of the Winter Daily Situation Reports (Sitreps) from November to February/March. We conducted time series analyses from the 2010–11 winter period to the 2014–15 winter period for 15 of these indicators from this Sitrep data collection.
This subset of data is collected daily – apart from weekend days and bank holidays where the information is aggregated – and published weekly. Because this information is collected to help manage system pressures it requires rapid data collection and does not go through the normal data validation process of other data collections. To make it comparable across the years the data were analysed to a weekly time unit and normalised so that week 1 represented the first full week in a calendar year. Because of the bank holidays it was not possible to disaggregate the period around Christmas and New Year to a weekly unit.
We compared annual trends over time to see absolute differences between winters (using a comparable number of weeks – week 45 to week 6 inclusive). Where there were comparable data outside of the winter months we looked at how the winter of each year varied with the rest of the year. We also looked at the weekly patterns to see whether there were any specific points during the winter months where the system might be under particular strain.
We were also interested in how all the indicators studied related to each other. We split the indicators into broad categories of:
- hospital activity
- capacity and barriers to patient flows
- impact of winter pressures.
This report acknowledges and builds on a recent report by Monitor (2015) on A&E delays.
3. Findings
Hospital activity
A&E attendances
Overall, the number of A&E attendances has increased over the period studied, but in any given year there is a lower number of attendances in the winter months. Although older people have a lower absolute number of A&E attendances compared to younger groups, contrary to the national trend they do have a peak in December each year.
The average daily number of A&E attendances has increased over time. For major (type 1) A&E units it has increased from an average of 36,731 attendances per day in August 2010 to 39,220 in August 2015: a 7 per cent increase (Figure 3.1). Type 2 and 3 units include other and minor A&E units so, as we would expect, they have fewer overall attendances compared with major A&E units. However, they still show a similar relative increase over the time period under review.
Aside from the general trend of an increase over the period studied, there is a defined ‘dip’ in the number of A&E attendances in December/January of each year.
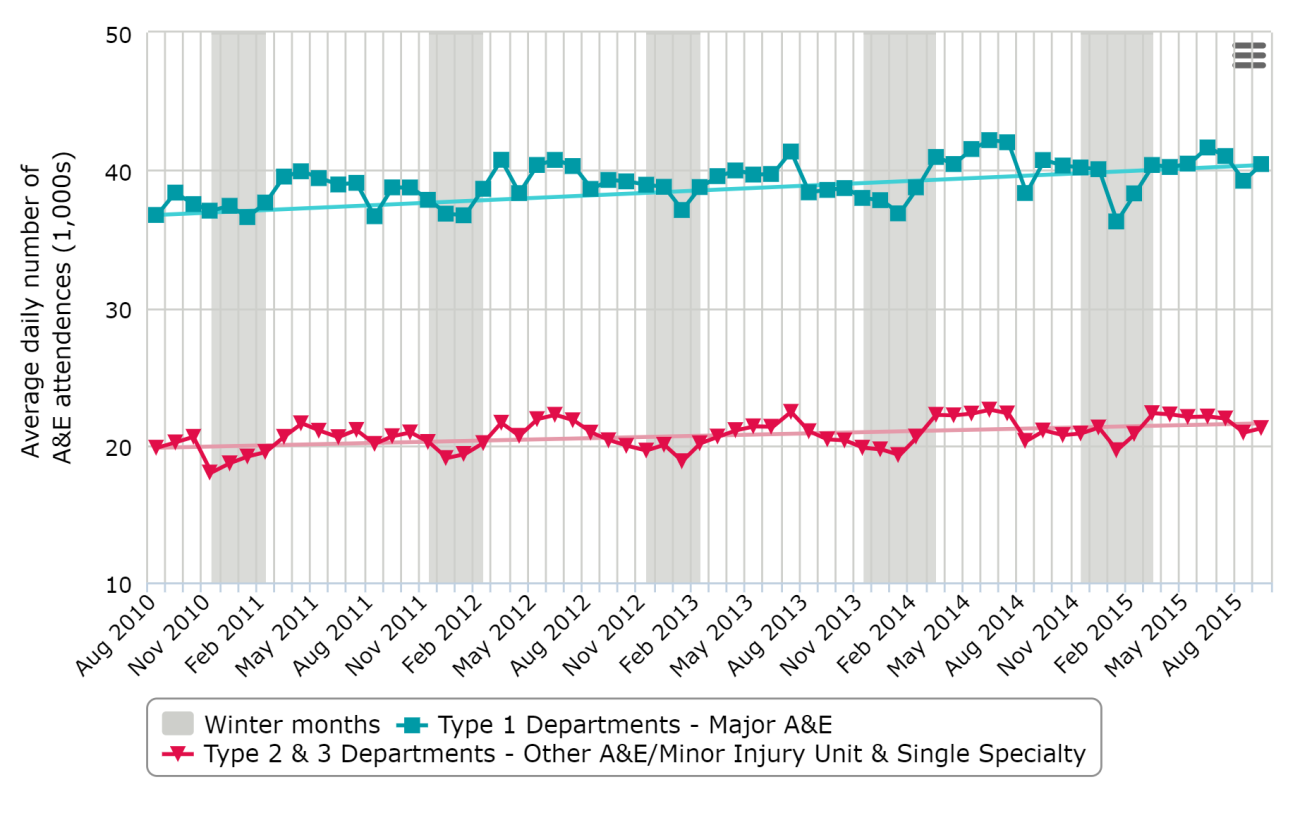
Source: NHS England, 2015a
If we compare A&E attendances by age, younger age groups (those under 60 years old) have a higher number of attendances overall (Figure 3.2), and this is particularly notable in the summer months.
However, if we compare attendances within an age-group population, older people have much higher rates of A&E attendances and stay longer in A&E than younger age groups (Blunt, 2014; House of Commons Library, 2015). Also, contrary to the overall trend, the A&E attendances for those in older age groups (60–79 years and 80+ years) seem to peak in December of each year in contrast with the start and end of the winter period (Figure 3.2).
Source: NHS England, 2015a
Hospital admissions
The number of emergency hospital admissions has increased over the period studied. Around 18 per cent of all A&E attendances result in an emergency admission. There is a small seasonal winter increase in the rate of emergency admissions.
Similar to A&E attendances, the average daily number of total emergency admissions has increased over time, from 13,723 in August 2010 to 14,666 in August 2015 – a 7 per cent increase (Figure 3.3). The number of A&E attendances resulting in an emergency admission (A&E conversion rate1) is relatively consistent and ranges between 16 and 20 per cent. However, there appears to be an annual pattern of a small peak during the middle of winter (December/January), having been consistently increasing since early summer (June/July).
Source: NHS England, 2015a
Capacity and barriers to patient flows
Hospital bed capacity
The number of available hospital beds has decreased over the period studied, and this corresponds with an increase in the percentage of beds occupied. The percentage of beds occupied peaks in the winter of each year. The number of patients whose transfer is delayed drops in December. However, during the winter months delayed transfers cause more beds to be closed than diarrhoea and vomiting (D&V)/norovirus-like symptoms.
One thing that may slow down the process of patients being admitted to hospital and receiving the care they need is bed availability. It is well known that rising bed occupancy rates are associated with worsening A&E performance (Monitor, 2015), so it is important to understand how bed occupancy rates vary over the winter period.
The number of overnight general and acute beds available has decreased nationally over time, from 110,568 in quarter 1 of 2010–11 to 102,330 in quarter 2 (May to July) of 2015–16: a 7.5 per cent reduction, equivalent to 8,000 beds (Figure 3.4). Over the winter months, there are peaks in the number of overnight beds available in quarter 4 of each year; however, this is matched by an increase in the number of beds occupied. This results in the percentage of occupied beds being higher in the winter period: 1–2 percentage points higher on average than the previous quarter in each year (Figure 3.4). As well as the seasonal peaks, the percentage of beds occupied has also increased over the period studied.
Figure 3.4: Quarterly patterns of the average daily number of overnight general and acute beds and percentage occupied
Chart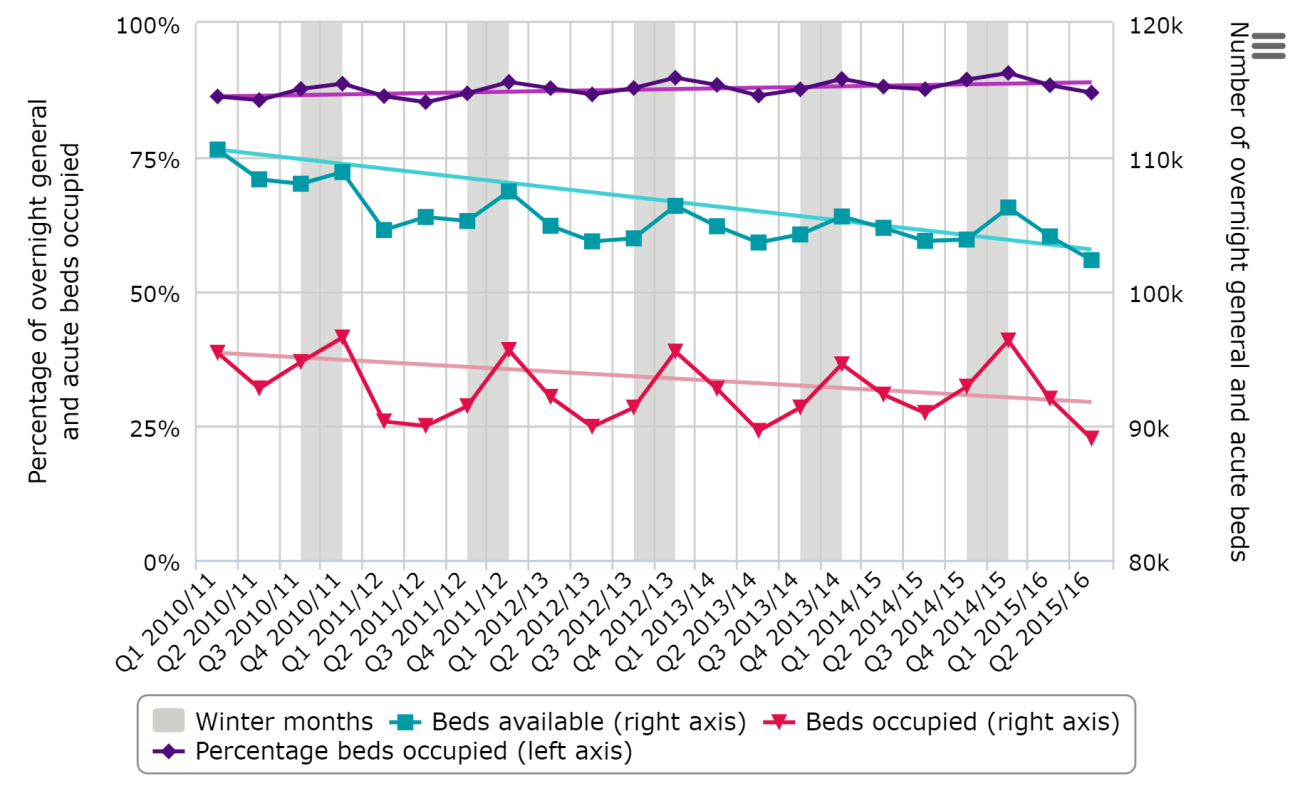
Source: NHS England, 2015b
Information from the Sitreps shows that the average daily percentage of acute and general beds occupied across the five years reviewed is around 94–95 per cent (NHS England, 2015c). This is higher than reported in a similar period under the quarterly return (Figure 3.4), which may be down to differences in how the two collections are carried out. The Sitreps involve rapid data collection and are not subjected to the normal data validation process of other data collections. Furthermore, the quarterly bed data is a snapshot of the situation at midnight, whereas the Sitreps are a snapshot at 8am or 9am, which may produce a different outcome.
As well as overall bed occupancy, certain events or outbreaks in the hospital can also lead to a reduction in bed availability. During the winter months, the number of beds that are closed due to diarrhoea and vomiting (D&V)/norovirus-like symptoms or because of a delayed transfer of care is tracked in the Sitreps.
When looking over comparable winter weeks between 2010–11 and 2014–15, the most common pattern for beds closed due to D&V/norovirus-like symptoms is an increase around the second half of November, reaching a peak at the start of December where it then either levels out or decreases. However, in 2011–12, once the point at which the peak normally occurs was reached, the number of beds closed continued to increase well into the next calendar year. In that financial year officials from the Health Protection Agency (now part of Public Health England) are reported to have claimed that levels of norovirus remained below what would normally be expected. So, if we use the number of beds closed as a proxy for infection occurrence in hospitals, the pattern observed in 2011–12 could suggest there was an inability to effectively manage the outbreaks in hospitals once they occurred, resulting in more beds subsequently being closed as the infection continued to spread. Also, in 2012–13, the number of beds closed began to increase well in advance of the normal pattern, and coincided with widely reported early outbreaks of norovirus that year (NHS Choices, 2012).
The annual daily average number of beds closed due to D&V/norovirus-like symptoms has decreased from 1,133 in 2010–11 to 920 in 2014–15.
Source: NHS England, 2015c
For most people, hospital treatment is successful and they are able to return home. However, some need to be transferred to other forms of care. Effective discharges in these cases require joined-up working, otherwise delays in the transfer of care can occur. If delays occur, the cause can be attributed to the NHS, social care or both.
During the period reviewed, the number of patients experiencing a delayed transfer2 of care initially dipped from around 4,940 delays in August 2010 to just under 3,500 in December 2012 (Figure 3.6). Since then, that number has been increasing and was at 5,328 in October 2015: a 7.9 per cent increase since August 2010. There are defined ‘dips’ in the number of delayed transfers of care in December each year, but this may be due to people not being scheduled for discharge in this period, making a reduction in the pool of delays possible. The number of delayed transfers of care that are reported to be the responsibility of the NHS is greater than the number where social care is responsible.3 The NHS total has increased over time, whereas social care delays and those that are the responsibility of both have broadly remained the same (Figure 3.6).
Figure 3.6: Snapshot of the number of patients delayed by the responsible organisation by month
Chart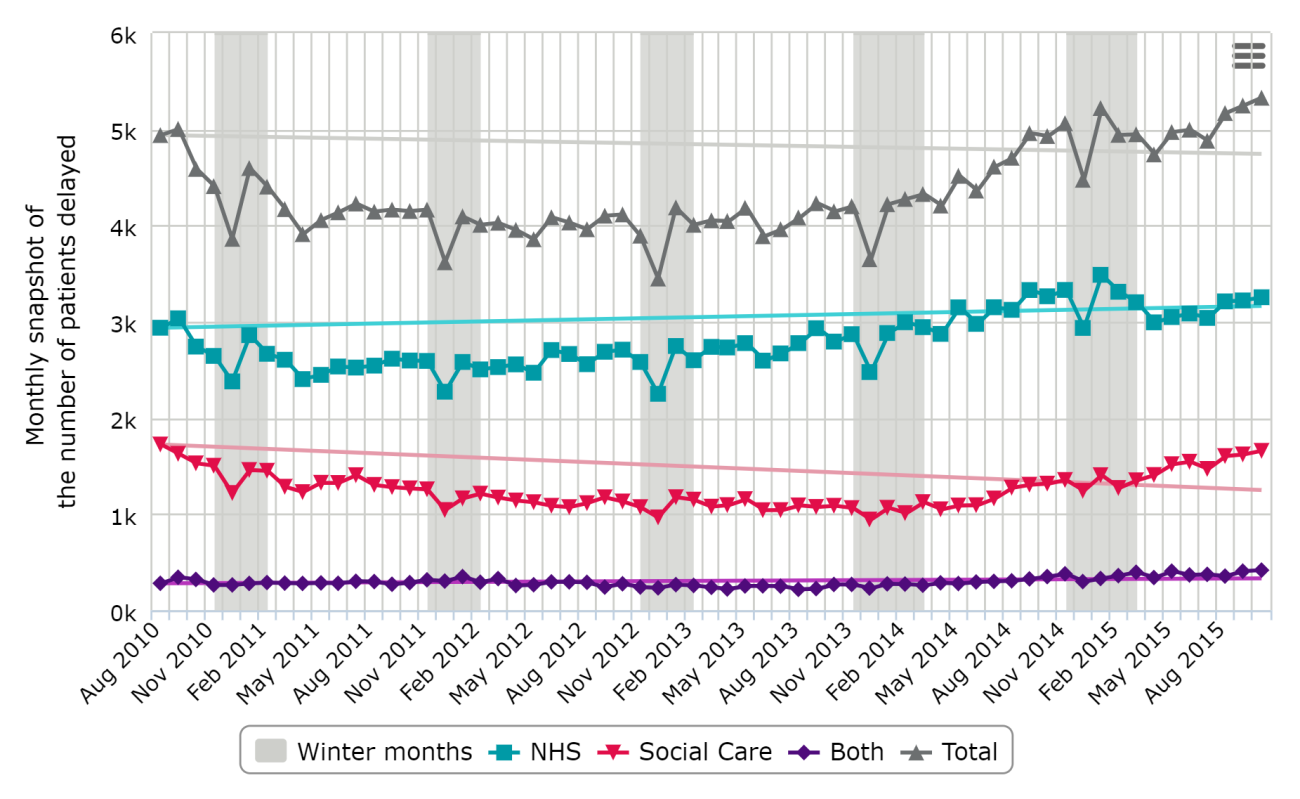
Source: NHS England, 2015d
In addition to the number of patients being delayed, the total number of days that patients are delayed per month has also increased over time (data not shown). In August 2010, the number of delayed days was 109,918; this has risen to 160,094 in October 2015 (a 46 per cent increase). As with the number of patients delayed, the NHS is reported to be responsible for the majority of days delayed. In October 2015, some 61 per cent of the total number of days delayed was attributable to the NHS, compared with 31 per cent attributable to social care and 7 per cent attributable to both (data not shown). However, the number of delayed days does not follow the same seasonal pattern as the number of patients delayed, and patients are not waiting longer during the winter months beyond normal fluctuations (data not shown).
Delayed transfers of care can lead to beds being closed while a person waits to leave hospital. As with the monthly snapshot of the number of patients experiencing a delay, the average daily number of beds closed due to a delayed transfer of care has increased over time when looking at the winter periods, and was at a high of nearly 4,000 in 2014–15 (Figure 3.7). The weekly winter pattern shows a clear dip in the number of beds closed in the Christmas and New Year period. This is often followed by a peak in the weeks just after.
Source: NHS England, 2015c
Staffing
The number of full-time equivalent staff has generally increased over the period studied, and there are clear seasonal trends, with broad peaks in the winter months. However, when taking into account sickness absence rates, which are much higher in the winter, these peaks are much less pronounced.
In addition to bed availability, staff numbers contribute to the overall capacity of hospitals to deal with additional pressures in the winter.
The number of full-time equivalent (FTE) doctors has increased over time, from 99,537 in August 2010 to 107,373 in August 2015 – a 7.8 per cent increase (Figure 3.8). There is an annual pattern, with a trough each August followed by a rise as newly qualified staff members join the workforce. A peak in numbers of doctors is then reached at the start of winter, followed by a decline as doctors leave the workforce. The average number of doctors in the winter months is around 1.5 per cent higher than the average of the pre-winter months of that year.
Source: Health and Social Care Information Centre, 2015a
Since mid-2010, the number of FTE qualified nursing, midwifery and health visiting staff has remained steady over time and was at 317,227 in December 2014 (Figure 3.9). It follows the same annual patterns as the number of doctors.
Between November and February each year there is a broad peak in the number of FTE qualified nursing, midwifery and health visiting staff. A small dip occurs in December. However, the peaks we see in the winter of each year may be giving a false sense of capacity, as sickness absence rates are also higher in winter. If we apply the rate of sickness absence for nurses, midwives and health visitors to the number of FTEs, we actually see dips in capacity in December and January of each year (Figure 3.9).
Source: Health and Social Care Information Centre, 2015a; Health and Social Care Information Centre, 2015b
During the period reviewed, for all staff groups we see a peak of sickness absence rates in the winter months of every year (Figure 3.10). For England as a whole, these peaks are between 4.4 and 5 per cent across the five years. Although this does not seem like a large proportion, it should be understood in the context of lower national average sickness absence rates across the whole of the UK labour market (ONS, 2014). However, we do not know how much of total sickness absence is covered by the use of bank and agency staff.
A particularly large spike in sickness absences occurred in 2010–11, which corresponds to a time when the UK had its first ‘flu season following the H1N1 influenza pandemic and was experiencing ‘intense influenza activity’ (Health Protection Agency, 2011). Acute trusts’ uptake of the ‘flu vaccine was only 40 per cent at this time (Public Health England, 2015).
Although we would expect a similar pattern for FTE doctors, no sickness absence rates for this specific staff group are available. It was therefore not possible to see the impact sickness rates have on doctors’ capacity.
Ambulance staff generally have higher sickness absence rates than other NHS staffing groups. This is also more pronounced in the winter months, reaching highs of 7.8 per cent in December 2012 and 7.7 per cent in December 2014. However, it is worth noting that the ambulance workforce is relatively small, which makes these rates more volatile for this group.
Source: Health and Social Care Information Centre, 2015b
Impact of winter pressures
Impact on ambulance services
In 2014–15, the number of ambulances queuing over the winter period was high compared to other winters investigated. During each winter there is a specific increase in the number of ambulances queuing over the Christmas and New Year period. During the last three winters the performance of the ambulance service, as measured by their response times to category A calls, is reduced during the month of December.
Looking at the Sitreps (NHS England, 2015c), the number of ambulances queuing during the winter period has remained fairly steady year on year up to 2013–14 (around 60,000 for week 45 to week 6 inclusive). In 2014–15 this increased considerably to 96,150.
Assessing weekly patterns in each year, the numbers of ambulances queuing begins to increase at week 48, peaking between week 50 and week 1, which corresponds to the Christmas and New Year period – at which point it begins to decrease again.
It is not known whether the number of ambulances queuing is particularly high during the winter months compared with other months. This is due to the fact that this information is only collected during winter as part of the Sitreps.
However, the proportion of Category A (red 1 and red 2) calls attended within eight minutes shows a corresponding drop across the last three winters during the month of December compared with the rest of the year (Figure 3.11). Furthermore, performance across the 2014–15 period was substantially worse than in the previous three years and there is a large decrease in the proportion of trusts that responded within eight minutes in the 2014–15 period.
Source: NHS England, 2015e
Impact within A&E
Performance against the four-hour A&E target drops in the winter of each year, and this has been getting worse over the period studied. Performance in dealing with people requiring an admission to hospital following an A&E visit is also poorer in the winter months.
The maximum four-hour wait in A&E remains a key NHS commitment: in July 2010 a target was set aiming for a minimum of 95 per cent of patients attending A&E departments to be admitted, transferred or discharged within four hours.
Our research indicates that there is a general trend for performance against this target to be higher in the summer (Figure 3.12), despite the fact that A&E has the highest numbers of attendees at this time. In major (type 1) A&E units, drops in performance are normally observed from November in any given year; however, what happens subsequently seems to vary in different years. On the whole (apart from between 2012–13 and 2013–14), there is a year-on-year decrease in the proportion of patients seen within four hours (Figure 3.12). It is notable that the winter of 2015–16 begins with a particularly low level of performance, with only 90 per cent of patients seen within four hours in September 2015. For type 2 and 3 A&E units, the percentage of patients either admitted, transferred or discharged within four hours from arrival is consistently above 99 per cent (NHS England, 2015f).
The four-hour target receives by far the most scrutiny as a measure of A&E performance. However, there are several other useful measures of how long patients wait in A&E units. The QualityWatch programme also looks at the median number of minutes spent in A&E by all patients as well as the time to treatment (in whatever form that takes).
Overall, the average time spent in A&E has remained fairly stable – around 130 minutes – but increased notably in the second half of 2014, reaching a high of 145 minutes in December 2014. The median average experience of time waited until treatment has changed little since 2011 and stands at around 50 minutes. Unlike the four-hour target, however, these measures do not seem to be influenced by the seasons in the same way.
Source: NHS England, 2015f
For patients that require admission to a hospital ward for further care, the time they wait between a decision to admit in A&E and arriving on the ward is very important for ensuring ongoing timely and appropriate treatment. The percentage of people waiting more than four hours to be admitted after a decision to admit is highest in the winter months, and has increased substantially since 2010 (Figure 3.13). In 2014–15, the number of people who waited more than four hours reached a peak of over 45,000 patients in December 2014, which is 9 per cent of all patients where there was a decision to admit and 2 per cent of all A&E attendees.
In September 2014, before going into winter, the number of patients waiting longer than four hours already surpassed the levels seen in previous winters. The figures for August 2015 are even higher, with more than 25,000 people waiting more than four hours for admission.
Source: NHS England, 2015f
The large peak in the number of patients waiting over four hours in winter 2014–15 also corresponded to a high number of people waiting a very long time (over 12 hours) (Figure 3.14). In the first week of 2015, a peak of 270 people waited over 12 hours from decision to admission. There was a slight recovery in week 2 but this rose again to around 115 people consistently in weeks 3–5. While this is a very small number in comparison with the total number of people using A&E, it is clear that a growing number of patients are waiting an extremely long time (Figure 3.14).
Source: NHS England, 2015c
Impact on inpatient services
The total number of cancelled operations has been increasing over the period studied and there is a higher number in the winter months. Furthermore, the number of non-clinical critical care transfers out of an approved group4 during the winter months has been maintained over the last five years. However, there was a dramatic increase in the number of non-clinical critical care transfers within an approved group in 2014–15.
There are a number of non-clinical reasons why operations may be cancelled, but cancellations are likely to be an indicator of a lack of capacity – for example, insufficient supply of facilities, equipment and/or appropriate personnel. During winter pressures, cancelling operations may be used to manage the capacity flow.
The total number of cancelled urgent operations fluctuates over time (Figure 3.15), but there tends to be a bigger peak in the winter of each year. Over successive years, however, there has been a slight increase in the number of cancelled urgent operations, from 172 cancelled operations in August 2010 to 274 in August 2015.
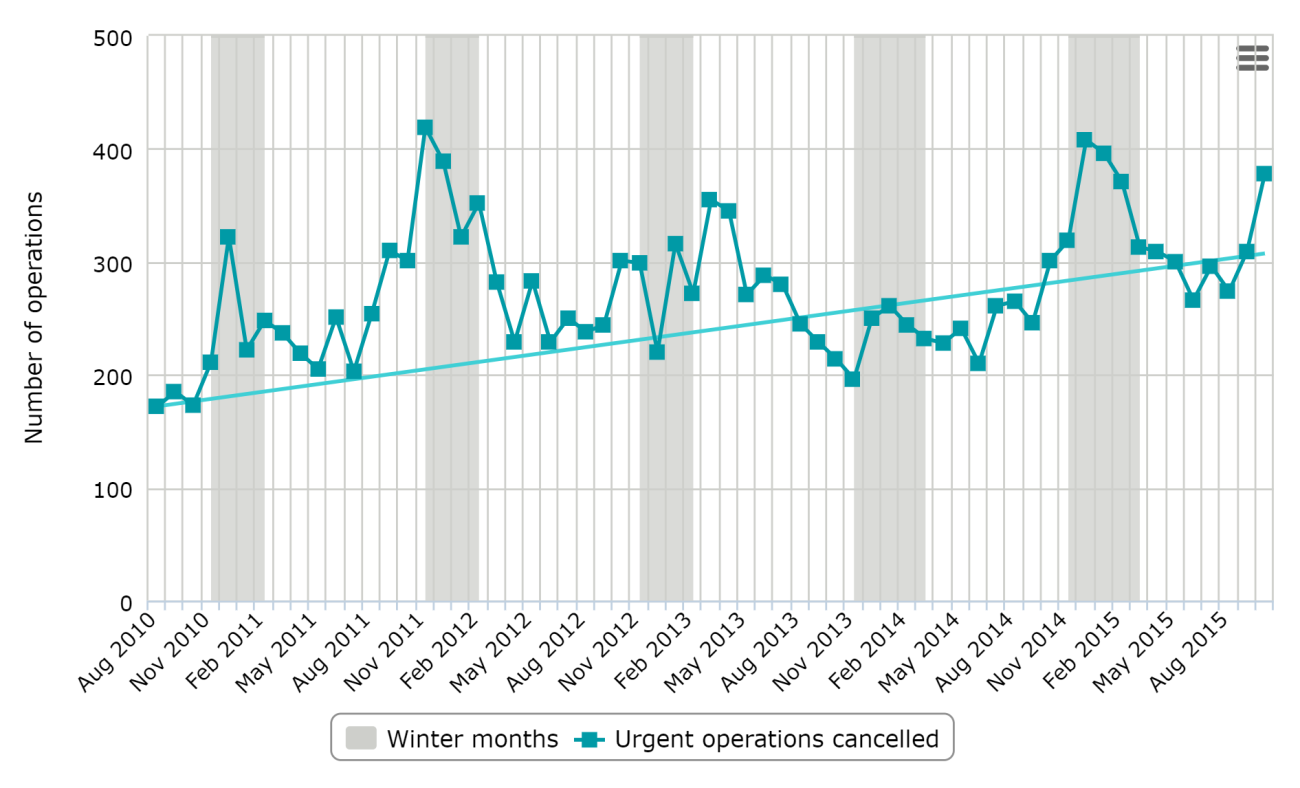
Source: NHS England, 2015g
Cancelled operations are not desirable for patients, and having an operation cancelled multiple times can have a huge negative impact on people. The number of urgent operations cancelled two or more times in the winter months (week 45 to week 6 inclusive) initially decreased from a high of 129 in 2010–11 to around 37 in 2013–14. This has since increased to 84 in 2014–15 (NHS England, 2015c).
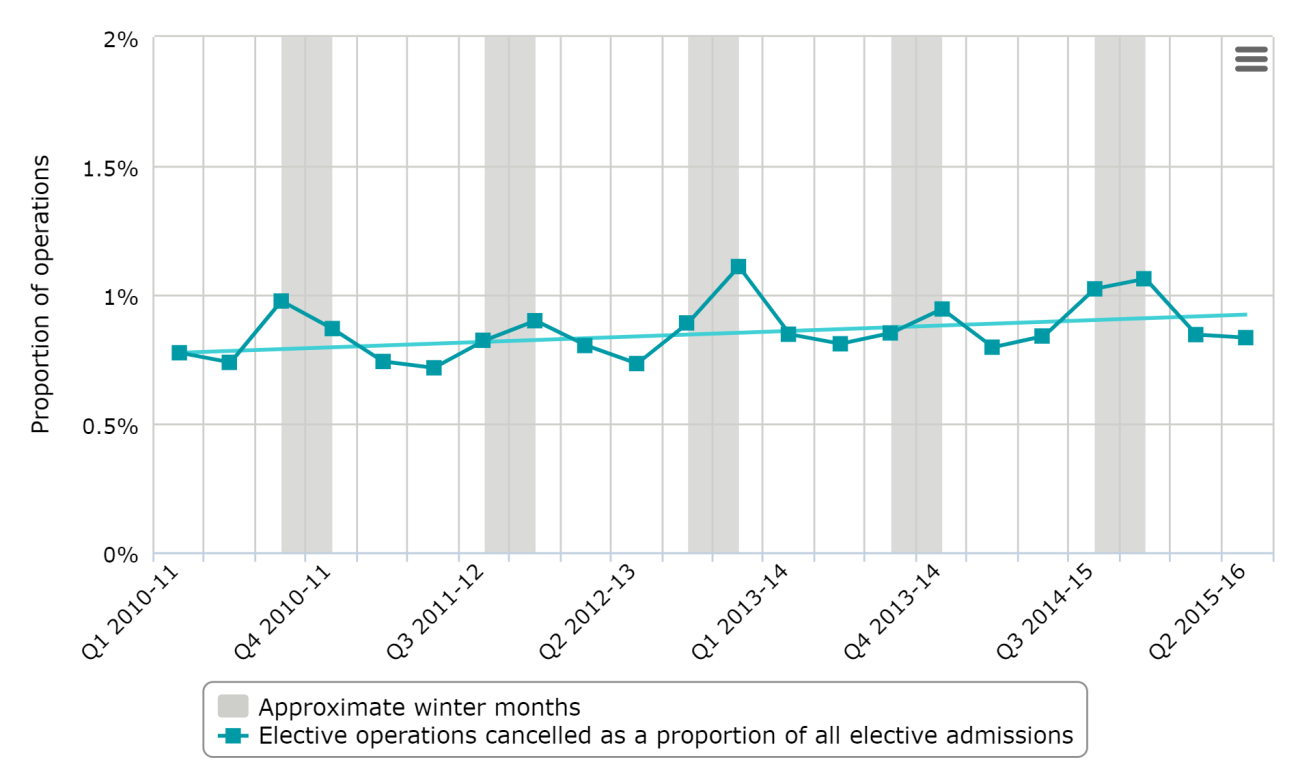
While the number of urgent cancelled operations has been rising steadily over time, so too has the number of elective admissions (NHS England, 2015g). Cancelled elective operations as a proportion of all elective admissions have increased slightly over this time (Figure 3.16), rising above 1 per cent in quarter 3 and quarter 4 2014–15. The proportion of cancelled operations rises notably in quarter 4 of each year and follows the pattern of cancelled urgent operations discussed above.
Source: NHS England, 2015g
The transfer of a critical care patient out of a particular critical care unit should only be considered for essential clinical reasons or for repatriation of a patient to their local hospital. It should only be considered if it is in the best interests of the patient and where risk for patients and staff is kept to a minimum. However, non-clinical critical care transfers can be used to manage capacity within intensive care units.
Investigating the monthly patterns of the number of non-medical critical care transfers, there is an increase during the winter months (data not shown) (NHS England, 2015h).
The number of non-clinical critical care transfers out of an approved group has been maintained at a similar level as previous winters (Figure 3.17). However, in 2014–15 there was a dramatic increase in the number of non-clinical critical care transfers within an approved group after a sustained period of decrease from 2011–12. Considering the weekly pattern, the 2014–15 increase mainly seems to be driven by an increase to 100 transfers in week 49, which was due to a large number of transfers at two trusts (data not shown) (NHS England, 2015c).
Source: NHS England, 2015c
Impact on the system as a whole
Pressures on the acute system as a whole can lead to a temporary diversion from an A&E unit, or, in the extreme, an A&E unit closure.5
The number of A&E diverts has remained fairly steady over the last five years, at around 250 per winter (Figure 3.18). Even in the most extreme circumstances the number of A&E units closing is very low: between three and six since 2010–11.
Source: NHS England, 2015c
As one element of the Sitreps, trusts are asked whether they are experiencing ‘serious operational problems’6. Looking at the data, the first week of January seems to be the time trusts report having more problems (Figure 3.19). However, it appears that it is a small subset of trusts that drive this peak. For example, when looking at the trust-level detail in 2014–15, during that week in January there were 20 trusts that reported operational problems on every day of the week.
Trusts reported more operational problems in 2010–11 than in the other years analysed. However, the number of problems reported in 2014–15 doubled compared with 2013–14. Prior to this, there had been a year-on-year decrease in reported problems (Figure 3.19).
Source: NHS England, 2015c
4. What do these findings mean?
The pressures on acute hospitals in winter come from many sources and are often a symptom of wider issues in the local health and social care system.
Over the period reviewed in this report, the percentage of people waiting more than four hours to be admitted, transferred or discharged in an A&E department is greater in the winter months (November to March). This has been worsening over the last five years and the latest 2015–16 data shows no change in this trend. Nationally, the four-hour A&E target has not been met for the last 27 months, and 90 per cent of patients spent less than four hours in A&E in October 2015 – five percentage points below the national target of 95 per cent.
Not everyone in A&E is waiting longer. The fact that there is no corresponding change in the median length of time patients have to wait in A&E means that during the winter months some patients are waiting ‘extreme’ lengths of time.
The reasons for this cannot simply be put down to more patients attending A&E. First, previous work from the QualityWatch programme has showed that although greater crowding in A&E is associated with longer waiting times and increased chances of a four-hour target breach occurring, it is not the only contributory factor to these outcomes. Half of those breaches occurred when an A&E unit was running at greater than 125 per cent of its usual occupancy, but over a quarter of breaches happened at a time when units were less busy than expected (Blunt, 2014). Second, as noted in this report, there is in fact a decrease in the number of attendances to A&E during the winter periods.
However, in winter there is an increase in the proportion of older people attending and in the overall proportion of people who are admitted to hospital as an emergency. Older patients and those waiting for admission tend to wait in A&E longer than other patients (Blunt, 2014). This increases the chances of the four-hour target being breached during the winter period, although the increased number of older people attending A&E appear only to account for around 11 per cent of the observed decline in performance against the four-hour target (Blunt, 2014).
Winter weather has a direct effect on need for care by the population; for example the incidence of heart attack, stroke, respiratory disease, ‘flu, falls and injuries and hypothermia (NICE, 2015) are all greater in winter. Older people are particularly susceptible as they are more likely to have complex health needs and live in under heated homes which exacerbates illness (Department of Energy and Climate Change, 2014).
In this study we did not analyse data from general practice or community services to understand whether problems in these sectors could add pressure onto emergency care in hospitals. But studies using the GP patient survey found that only 9.2 per cent of people who could not get a convenient appointment at their GP practice went to A&E or a walk-in centre (Wallis, 2013). Insufficient out-of-hours services in general practice does not seem to be associated with pressure on A&E (Blunt, 2015). And the latest results from the GP patient survey show that only 20 per cent of respondents said that they had tried to contact an NHS service when their GP surgery was closed. Of those, a third said that they went to A&E. Extrapolating from this would mean that only approximately 6 to 7 per cent of patients who needed an out-of-hours service went to A&E instead. The survey also shows that the majority (61 per cent of patients contacting the NHS out of hours) contacted an NHS service via telephone. We are not able to tell from the survey whether there are any any particular difficulties occurring in the winter months.
One of the telephone services patients can use is NHS 111. Since August 2010 (the start of the data collection period) there have been 30 million calls to NHS 111, and of these, only 8 per cent of callers were referred to A&E. There are fluctuations at the start of the data collection, but reviewing the last three financial years shows there are more likely to be referrals to A&E in the summer months than the winter ones (data not shown).
There is little information available about demand or capacity for community care. However, looking at the numbers of nurses in community services, it appears that, while the number of nurses dropped by over 2,000 between late 2009 to a low in September 2013, this number has been increasing again back to 2009 levels (QualityWatch, 2015). It should be noted that this does not show us whether or not this is sufficient to satisfy demand, particularly in winter.
Influence of inpatient service capacity
Clearly rising demand is one factor influencing the performance of acute and emergency NHS services in winter, and supply is another. There is a growing body of evidence showing that – in addition to the influence of the specific patient groups attending A&E and certain patient pathways on the ability of A&E departments to meet the four-hour target – the capacity and flow through inpatient services also has an impact. Studies by the BMA (2003) and Monitor (2015) indicate that reducing numbers of inpatient beds, rising occupancy rates and delayed transfers of care, and staffing capacity all have an effect.
Hospital bed capacity
One study found that there was an increased risk of having no beds available for patients requiring immediate admission when average bed occupancy rates exceed about 85 per cent (Bagust and others, 1999). The study also found that acute hospitals can expect regular bed shortages and periodic bed crises if average bed occupancy rises to 90 per cent or more. Using quarterly data, we can see that hospital bed capacity (i.e. the number of beds available) increased during the winter months in the period reviewed, but there are also peaks in bed occupancy at the same time (quarter 1 for any given financial year). In the last three winters the occupancy rate reached 90 per cent. This suggests that winter months bring particular issues in making beds available for admitted patients.
Norovirus, which causes diarrhoea and vomiting, is a particularly contagious disease, and often occurs in winter. If it occurs in a hospital, beds are often closed (Guidelines for the Management of Norovirus Outbreaks, 2012). However, more beds are also closed due to delayed transfer of care than due to norovirus during the winter months, but the picture of how delayed transfer of care relates to bed occupancy is not clear when looking at the official discharge data collected throughout the year.
It has been suggested that the overall increasing number of delayed transfers of care has contributed, along with a decrease in the number of beds, to the overall increased bed occupancy. However, the link during the winter months is not obvious. The number of patients delayed actually drops in December and returns to pre-Christmas levels in January. There is no discernible increase in the number of days delayed during this time. Yet occupancy at this period is at its highest.
While delayed transfers of care are most often due to the NHS, some are a result of reductions in the availability of social care. Between 2009–10 and 2013–14, there has been a 16 per cent reduction in real-terms net expenditure on social care for adults, which means almost 300,000 fewer older adults have received publicly funded social care services (Holder, 2014). However, over a similar period (Figure 3.6), delayed transfers of care attributable to social care have remained fairly static.
Impact on services outside of A&E
In this report, we have also explored winter pressures in ambulance services and inpatient services as well as in A&E units, but because of data limitations did not analyse the impact in primary or community or social care sectors.
Impact on ambulance services
Pressures in A&E departments can reduce their ability to take new patients who arrive by ambulance. Peaks in the number of ambulances queuing do appear to coincide with breaches of the four-hour A&E waiting target. They also correspond to periods when there is a reduction in ambulance services’ ability to respond to emergency calls within eight minutes.
However, more work is needed to look into how much impact each of these factors have on ambulance response times, especially as there is no systematic information on ambulance queuing outside of the winter period. This work could also bring in staff sickness absence rates. In addition, the ambulance queuing measure used is not nuanced: it only looks at ‘extreme’ waits, and it might be the case that a large increase in people waiting in ambulances just a little bit longer without actually breaching the 30-minute threshold has a more significant impact on ambulance response times. It should also be noted that this study only considered the national picture, and more in-depth analysis locally – including looking at events such as A&E diverts and closures – will provide a richer picture on what is happening within the system.
Impact on inpatient care
During the winter months, increasing bed occupancy, as well as other factors, can result in planned and urgent inpatient care being cancelled.
The number of urgent operations cancelled is highest in winter - peaking at over 400 a month - compared to the rest of the year. Numbers of urgent operations cancelled twice or more are relatively low: less than 16 in any given month throughout the year. As a result, these data are more susceptible to random fluctuations and so it is hard to discern whether there is a winter pattern.
The number and proportion of elective operations being cancelled peak in either quarter 3 (September to December) or quarter 4 (January to March) of any given financial year, and increase from a quarterly average low of 0.9 per cent in quarter 2 to a quarterly average of 1.2 per cent in quarter 4. This may not sound like a large increase, but does mean an average quarterly difference of over 4,000 operations across England.
Capacity within urgent care can be managed by transferring patients out of critical care where possible, and this does seem to be linked to winter pressures as the number of patients transferred out of critical care (for non-clinical reasons) peak during the winter months.
Was 2014–15 a particularly bad winter?
In 2014–15 £700 million was provided by the Government (2014) in order to help relieve winter pressures by using the money to provide extra staff and beds and to release capacity through minimising delayed discharges.
As widely reported at the time, in the winter of 2014–15 performance against the four-hour A&E waiting time target decreased dramatically from an already low point. However, there were no similar dips in performance when looking at other A&E waiting time measures, such as the average time spent in A&E and the average time until treatment began.7 This suggests that those waiting ‘extreme’ lengths of time were particularly adversely affected in 2014–15.
Ambulance queuing – measured by the number of ambulance handovers delayed by 30 minutes – increased considerably in 2014–15. A knock-on effect on ambulance response times was also observed, decreasing well below levels seen in previous winters.
Despite all this, not all services experienced a particularly dramatic effect in the winter of 2014–15. There do not seem to be any discernible changes in the number of cancelled operations, or the number of people transferred out of critical care (for nonclinical reasons) outside of an approved group However, a lack of increases in critical care transfers outside of an approved group could have been offset by an increase in transfers within an approved group in 2014–15.
There was also little variation in the extreme ‘winter pressure’ effects. A&E diverts and closures were maintained at the same levels as in previous winters (although local analysis may provide a different view), while trusts reporting operational problems did increase in 2014–15 compared with the previous two winters, but not to the levels seen in 2010–11 and 2011–12 (although this may be susceptible to changes in reporting of data).
So, while the £700 million funding may have maintained performance against certain performance measures, there were clear problems in the winter of 2014–15 that the money was unable to prevent.
What do we know about performance in the 2015-16 winter?
The latest information from Public Health England shows that, for 2015–16:
- all regions are in the two least severe levels of cold weather alerts
- in January there was an indication that the influenza season started
- levels of lower respiratory tract infections appear to be within seasonal expectations
- levels of norovirus and rotavirus incidence appear to be lower than in previous years and reports of outbreaks of diarrhoea and vomiting in hospitals are at lower levels than in previous years.
While it is too early to understand the full impact that winter pressures will have on the NHS in 2015–16, we have entered this period from a historically poor starting point on the four-hour A&E target, trolley waits, ambulance response times, bed occupancy and on delayed transfers of care.
It should be noted that there has not been the same injection of funds specifically for dealing with winter pressures as in previous years. Nationally, trusts are reporting budget deficits that are a first call on spare cash that might have been reserved to support winter preparations (NHS Confederation, 2015).
Reporting on winter pressures has changed this year. Trusts that have previously encountered ‘heightened operational pressure’ are required to submit data for every measure, whereas the other trusts are only required to submit a subset of this data.
Notably, the measures that have changed are:
- ambulance handovers waiting more than 30 minutes
- four-hour waits in A&E
- cancelled operations
- number of beds closed due to delayed transfers of care.
The future outside of the winter months
Problems that were usually confined to the winter months are now increasingly being experienced at other times of the year. The four-hour A&E target has not been met nationally for over two years. Patients waiting to be placed on a ward after a decision to admit (trolley waits) is also an increasing issue, with the number and proportion of patients affected in summer 2015 being at the same levels seen in the winter of 2012–13, and worse than those in the winters of 2010–11 and 2011–12.
However, the proportion of elective operations cancelled and the number of urgent operations cancelled does not seem to be deteriorating. It should be noted that there may be other effects upon a service under strain in terms of inpatient activity, and there are growing concerns about the recent changes in the amount of time patients are waiting for treatment and the number of patients waiting for treatment (QualityWatch, 2015).
With ever-increasing demand on the NHS, performance levels that were historically only observed in the winter period are becoming increasingly common at other times of the year. Recent analysis suggests that if admission rates continue to increase at the rate they have, in the absence of other changes it is estimated that 17,000 new beds will be needed by 2022 (Smith, 2014).
So problems with emergency care performance usually only seen during winter seem to have become ‘the new normal’ for the rest of the year. But uncertainty remains over what our future understanding of ‘winter pressures’ might be.
While a lot of policy interventions, innovations and finances (such as the new models of care, vanguards and the Better Care Fund) are now developing and rightly aimed at cutting the number of admissions and providing more and better services outside of the hospital, some of these are only just starting to embed and it will probably be some years before their impact is felt.
Data sources used in this report
- Health and Social Care Information Centre (2015a) NHS Hospital and Community Health Service (HCHS) monthly workforce statistics. Analysed based on data accessed 9 December 2015
- Health and Social Care Information Centre (2015b) NHS Sickness Absence Rates. Analysed based on data accessed 17 December 2015
- NHS England (2015a) A&E attendances and emergency admissions statistics. Analysed based on data accessed 30 November 2015
- NHS England (2015b). Bed availability and occupancy. Analysed based on data accessed 8 December 2015
- NHS England (2015c) Winter Daily Situation Reports: winter daily SitRep 2015–16 data. Analysed based on data accessed 19 November 2015
- NHS England (2015d) Delayed transfers of care. Analysed based on data accessed 22 December 2015
- NHS England (2015e) Ambulance quality indicators. Analysed based on data accessed 5 January 2016
- NHS England (2015f) A&E attendances and emergency admissions. Analysed based on data accessed 1 December 2015
- NHS England (2015g) Critical care bed capacity and urgent operations cancelled. Analysed based on data accessed 2 December 2015
- NHS England (2015h) Critical care bed capacity and urgent operations cancelled. Analysed based on data accessed 19 December 2015.
About this publication
Suggested citation
Fisher E and Dorning H (2016) Winter pressures: what’s going on behind the scenes?Nuffield Trust and Health Foundation
Nuffield Trust
The Nuffield Trust is an independent health charity. We aim to improve the quality of health care in the UK by providing evidence-based research and policy analysis and informing and generating debate.
The Health Foundation
The Health Foundation is an independent charity working to improve the quality of healthcare in the UK. We are here to support people working in healthcare practice and policy to make lasting improvements to health services. We carry out research and in-depth policy analysis, fund improvement programmes in the NHS, support and develop leaders and share evidence to encourage wider change.
QualityWatch
QualityWatch, a Nuffield Trust and Health Foundation research programme, is providing independent scrutiny into how the quality of health and social care is changing over time.
Footnotes
- The A&E conversion rate is calculated as the number of A&E attendances that result in an emergency admission via A&E. (Back to text)
- The number of patients delayed in this measure is a proxy for all patients as it is a snapshot view determined by the number of patients who had a delayed transfer of care at midnight on the last Thursday of the reporting period. (Back to text)
- There have been some ongoing operational issues and concerns from local health and social care systems about the delayed transfer of care data return, and there has been ongoing work to refresh the guidance to remove ambiguity and improve operational clarity (NHS England Delayed transfers of care guidance, 2015). (Back to text)
- Individual acute NHS trusts are required to specify the geographically related hospitals to which they transfer patients for capacity reasons alone. This is their ‘approved group’. ‘Transfer groups’ are specific to each trust, and arrangements may not be reciprocal (Intensive Care Society, 2011). (Back to text)
- An A&E divert is an agreed temporary diversion of patients to other A&E departments to provide temporary respite (i.e. not to meet a clinical need). This includes diversions between hospitals that are part of the same trust, but geographically separate. An A&E closure is any unplanned, unilateral closure of an A&E department (type 1, 2 or 3) to admissions without consultation, which occurred without agreement neither from neighbouring trusts nor from the ambulance trust. This is irrespective of whether the A&E department is still accepting patients arriving on foot (NHS England Winter Daily Situation Report guidance). (Back to text)
- Trusts are asked to consider, based on their returns against all the measures collected in the Winter Daily Situation Reports as well as any other factors (e.g. staffing issues, adverse weather conditions), whether the trust has experienced ‘serious operational problems’ . Trusts are to use their judgement on what else constitutes a ‘serious operational problem’. If they respond yes, they are asked to provide more information (NHS England Winter Daily Situation Report Guidance). (Back to text)
- In these cases, the average waiting time referred to is the median. (Back to text)