
Recently published data suggests that the most deprived areas of England have twice the rate of deaths involving Covid-19 than the most affluent. But Covid-19 is not unique in this respect: inequalities in mortality have long been evident across many causes of death. Indeed, deaths from suicide, conditions such as liver disease and cancer as well as overall mortality rates all show that death rates for people living in the most deprived decile of the country are higher than those in the least deprived.
As the chart shows, not only do all causes of death lie below the equality line, most death rates for the most deprived areas are around twice those in the least deprived.
Covid-19 has highlighted a longstanding and wicked problem. Concern about this should renew interest and action to tackle inequalities in health in the population.
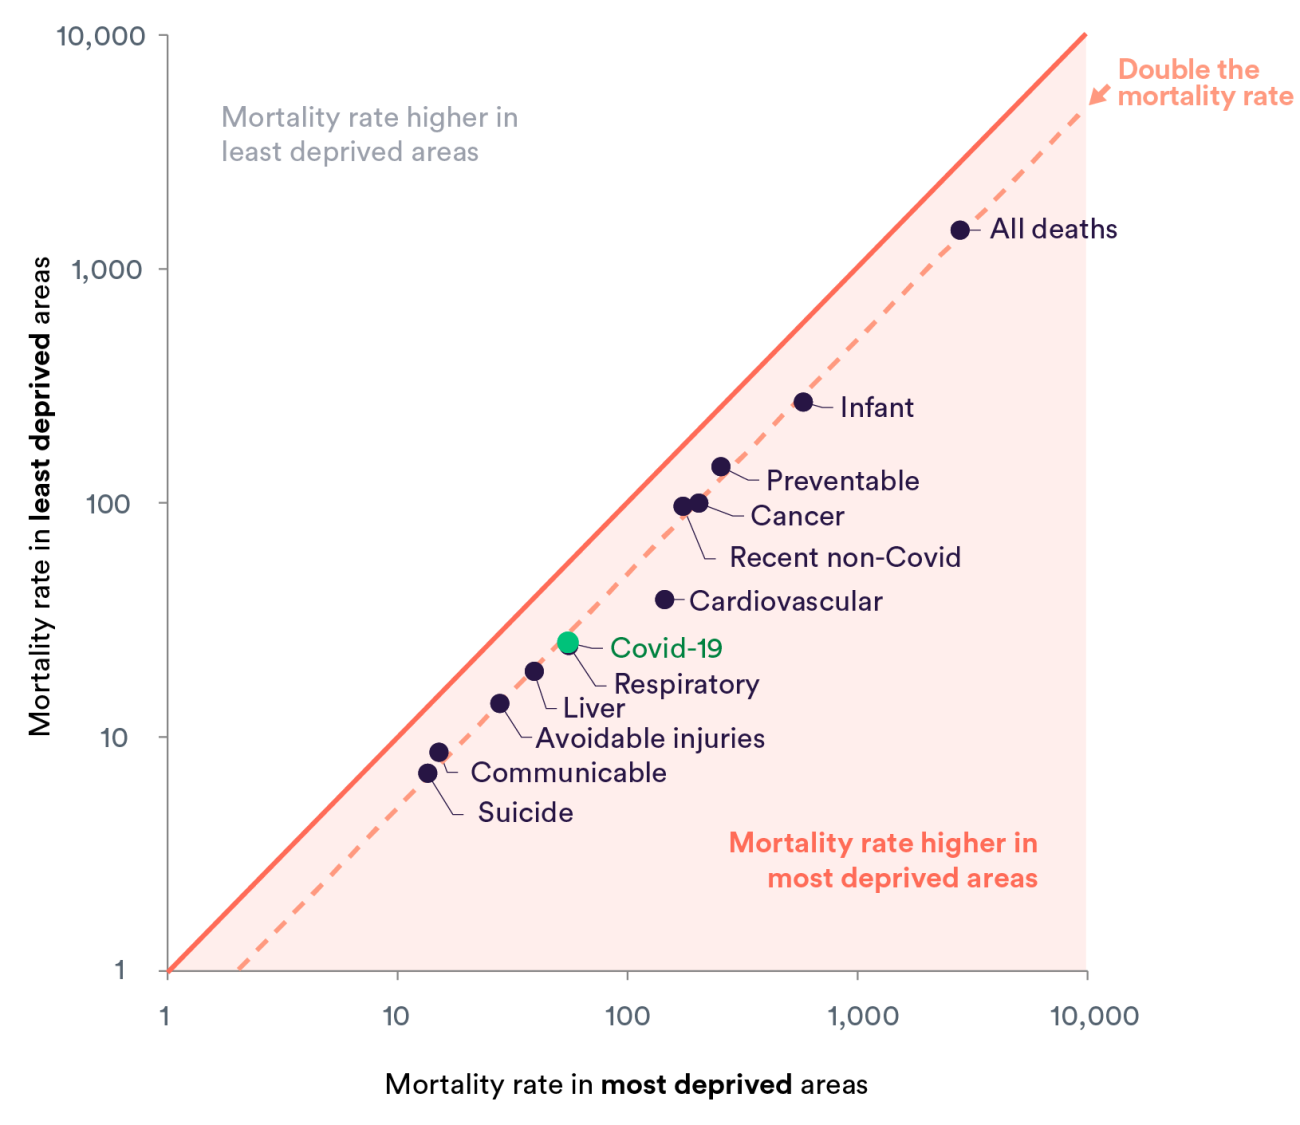
Chart notes
- Logarithmic scales are used to allow for differences in death rates.
- All measures are age-standardised with the exception of infant mortality.
- Deprivation levels measured using Index of Multiple Deprivation (IMD) and based on factors such as income, employment, health, education, crime, the living environment and access to housing within an area.
- Four of the measures (cancer, liver, respiratory and preventable deaths) are for people aged under 75.
- Four of the measures (communicable, respiratory, liver diseases and preventable deaths) are based on county and unitary authority geographies as opposed to smaller Local Super Output Areas (LSOA) due to data availability; this is likely to underestimate the degree of inequality compared to the other measures.
- All measures are for 2015–17 except for Covid-19 and recent non-Covid deaths (1 March to 17 April 2020), all deaths (2018) and deaths from avoidable injuries (2017).