It is broadly recognised that there is scope to make the NHS a more inclusive, diverse and equitable workforce. The efforts, some long-standing, to address inequalities within the workforce are welcome. Yet the discussion is all too often based on a narrow range of characteristics – commonly just ethnicity – and described using broad categories, such as Black and Minority Ethnic, which do not permit a sufficiently detailed understanding of the issues.
To highlight this issue, we looked at data on people applying and being shortlisted and appointed to NHS jobs. Covering the two years to June 2019, the data are vast, including some 8.2 million applications and 160,000 appointments. However, it does need to be treated with caution since not all employers use the system from which the data are derived to record numbers shortlisted and appointed. While the absolute level at which people are shortlisted and then appointed are therefore underestimates, comparing these levels across characteristics highlights disparities that warrant further investigation.
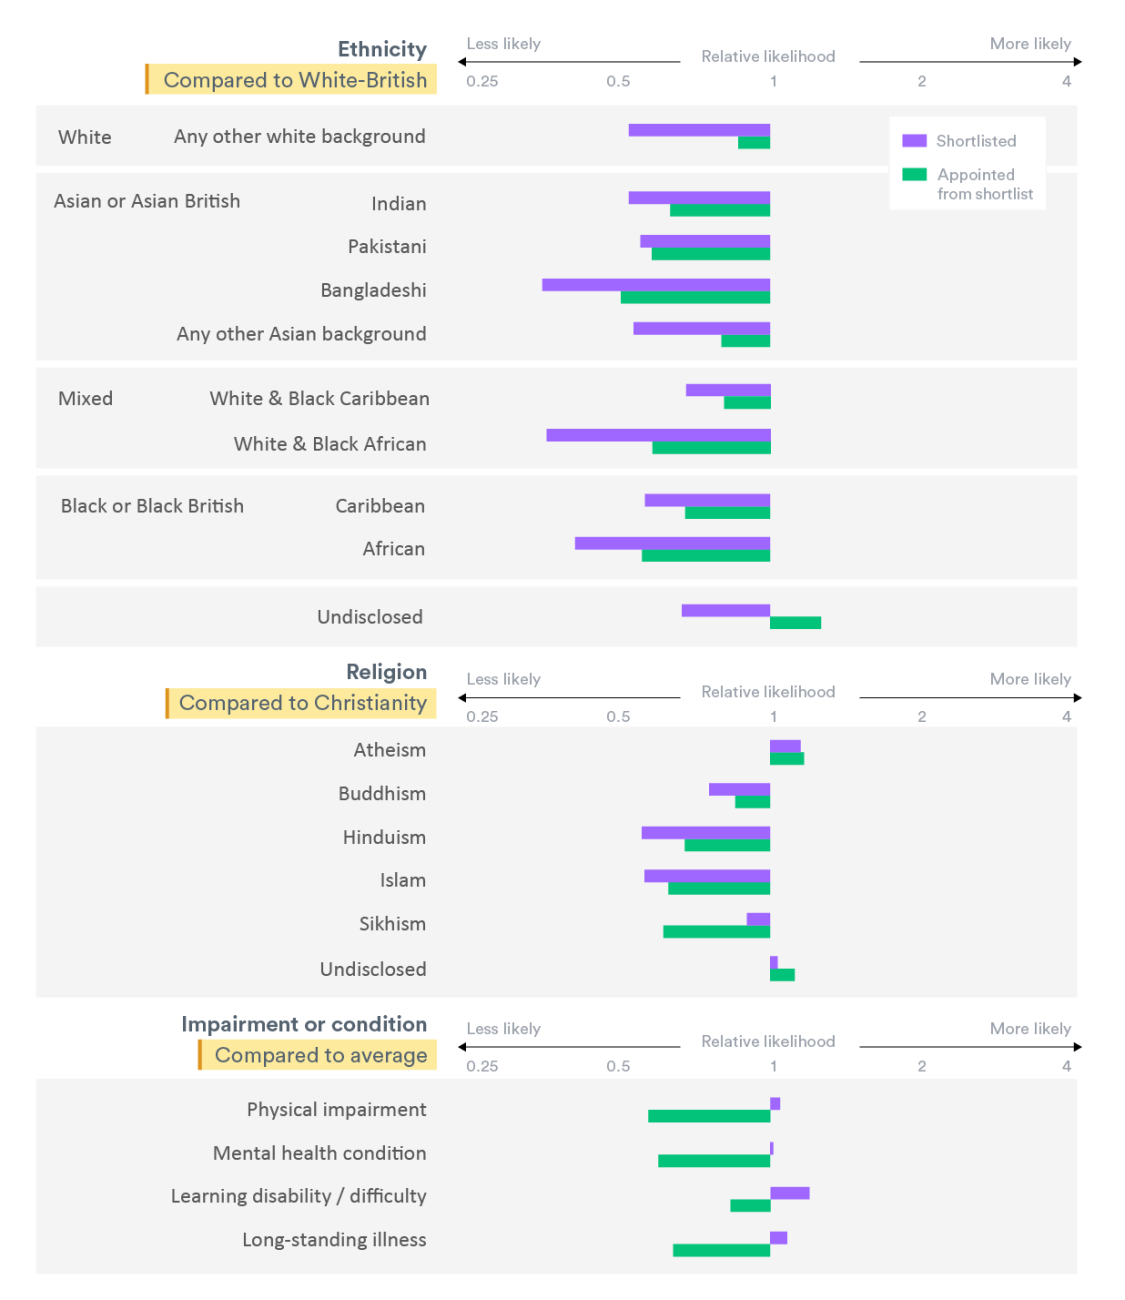
There was a clear signal that those with white ethnicity were more likely than those from ethnic minorities to be both shortlisted (purple bars) and appointed from the shortlist (green bars). However, as shown in the chart, there was considerable variation when the data was disaggregated into more specific ethnic groups. For example, those with Bangladeshi, African or White & Black African ethnicities appear to have lower success rates. Recently published but less detailed data suggest that the situation has not improved since the period this data covers.
There are also stark apparent disparities when looking at other characteristics. For example, the likelihood of being shortlisted or appointed from the shortlist for Sikhs, Muslims and Hindus are all significantly below the average. The average-or-higher likelihood of people with a physical impairment, mental health condition, learning disability/difficulty or long-standing illness being shortlisted may suggest the Disability Confident employer programme and Guaranteed Interview Scheme used by most NHS trusts is supporting this group to get interviews. However, the far lower likelihood of actually being appointed from the shortlist still needs investigating.
Our forthcoming report, funded by NHS Employers, explores these issues – including inequalities across a broader set of protected characteristics – in more detail. However, even then limitations in the data mean that we cannot explore, for example, the interplay between different characteristics or effect of socio-economic status. Given the importance of equality, diversity and inclusion, those recording, processing and publishing the data must up their game on collecting and making such information available, or else NHS leaders will remain hamstrung in their efforts to improve the diversity of their workforce at every level.