We may never know the actual number of people who have contracted Covid-19. Nevertheless (without reading too much into the last decimal point of each number), a broad and variable picture has emerged across the countries and regions of the UK during the rise and fall of the pandemic so far.
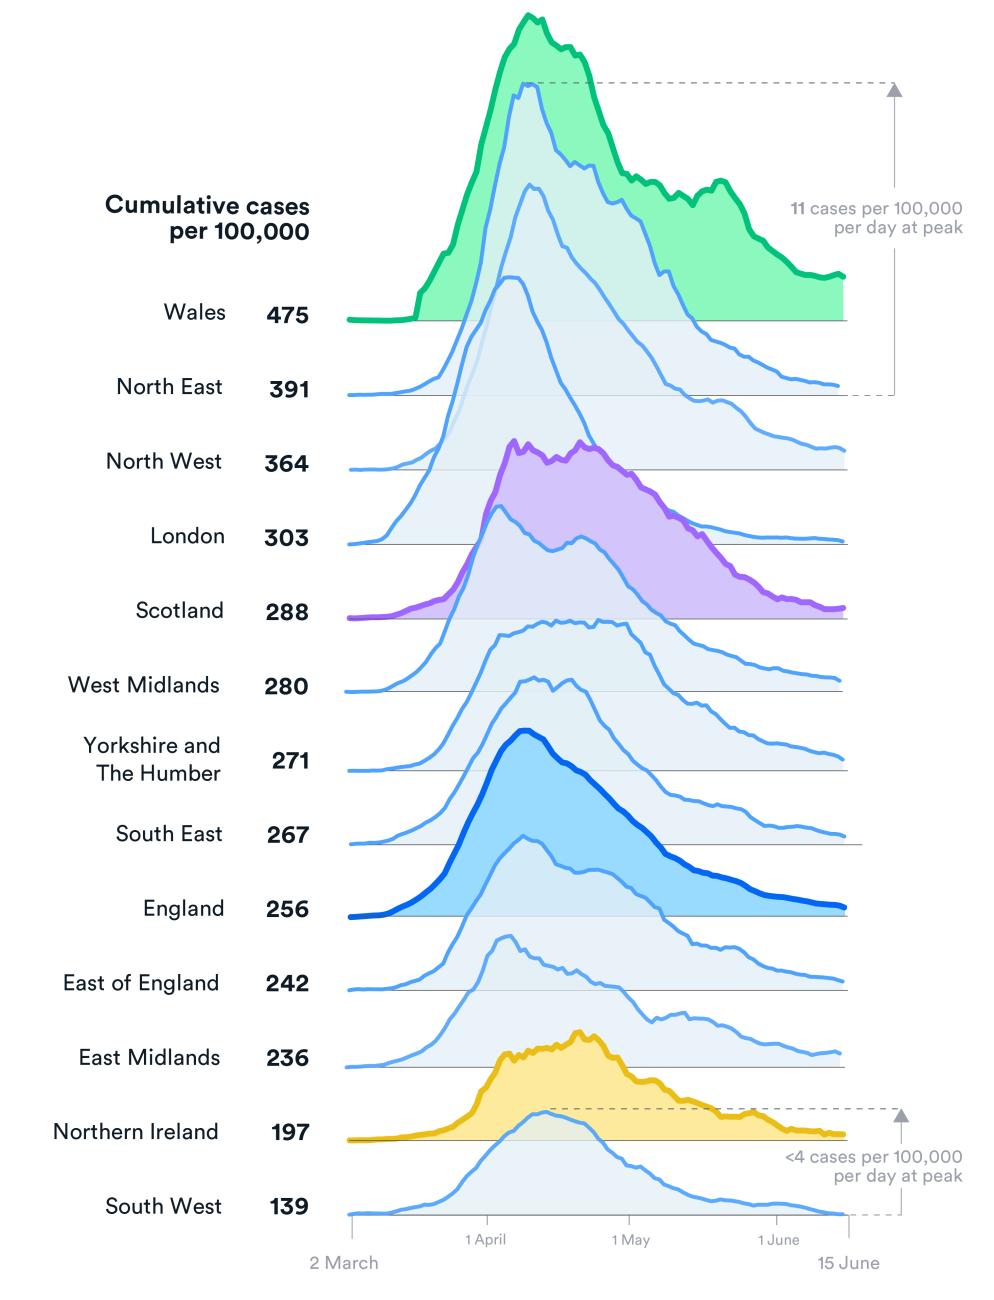
In the south west, for example, cases appeared to have peaked at a lower level of daily cases (~3.7 per 100,000 population) compared to other areas. By June 15th, the south west had recorded the lowest number (138) of cumulative cases per 100,000 population. On the other hand, the number of daily cases in the north east peaked at around 11 per 100,000 population, with a cumulative rate per 100,000 by June 15th of around 391.
The slowdown in the spread of cases post-peak has not been the same in every region. While daily cases in London rose earlier than in other regions, after the peak they have reduced at a quicker and smoother rate. In other areas, the decline has been much more erratic. Notably, in Wales – which by June 15th had the highest cumulative rate of cases (475 per 100,000 population) – the decline has faltered, with a noticeable increase in cases between the 13th and 21st of May.
Tracking the number of people with Covid-19 relies on testing (and its accuracy). In the absence of universal and regular testing, the number of reported cases will underestimate the true number, probably by an order of magnitude: as the National Statistician Sir Ian Diamond has noted, based on an ONS/University of Oxford infection survey, the UK has probably had around 3.5 million overall cases of Covid-19 – compared to a reported 300,000.