

There is no denying the seismic upheaval Covid-19 has had on health and care services and on people’s lives. As society “learns to live with Covid”, frequent headlines draw attention to the growing backlog for elective care, increasing waits in A&E departments, longer ambulance response times and waits for cancer treatment that have built up over the course of the pandemic. But what was happening to access and waiting times in the years preceding the pandemic and to what extent is Covid-19 to blame for the current pressures facing the NHS?
To help us answer this question, we looked at historical data to identify changes in key NHS performance trends before and after the start of the pandemic, among the general ‘noise’ of seasonal fluctuations. Using measures from across the NHS, we take a broad look at how effectively health services are working, discuss progress on achieving targets and how service pressures interconnect.
General practice
The number of appointments in general practice – which could be with GPs, nurses or other health professionals – fluctuates from month to month, but there was around a 30% fall during the first wave of the pandemic. Appointments have since recovered to pre-pandemic levels and are following a very similar trajectory to before the pandemic. In May 2022, there were nearly 28 million general practice appointments and an additional 729,000 Covid-19 vaccination appointments (not shown).
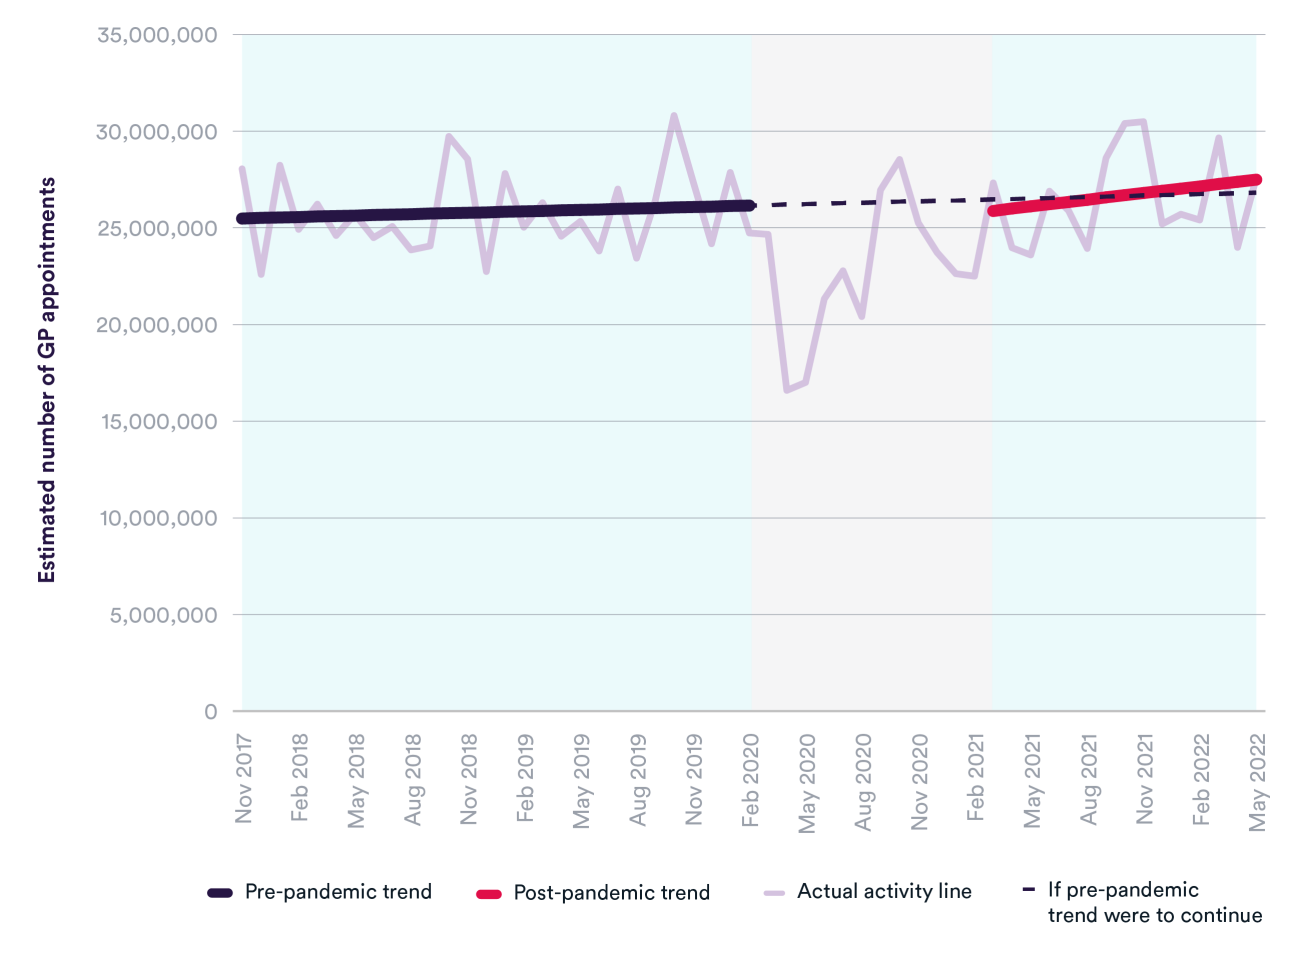
Even though the number of appointments has returned to pre-pandemic levels, access and experience of general practice have been significantly impacted by Covid-19. The latest GP Patient Survey, collected between January and April 2022, shows poorer experience of making an appointment. Nearly half of respondents (47%) said it was not easy to get through to their GP practice on the phone, and a quarter had avoided making an appointment in the previous 12 months because they found it too difficult. There is still some way to go in meeting unmet need, and we are far from reaching the government’s target of delivering 50 million more general practice appointments a year by 2024/25 – requiring an average of around 30 million appointments per month.
While appointment volumes have recovered, the number of GP referrals for a first outpatient appointment are still much lower than they were before the pandemic, although they are increasing. In May 2022, there were over 100,000 fewer GP referrals than in May 2019.
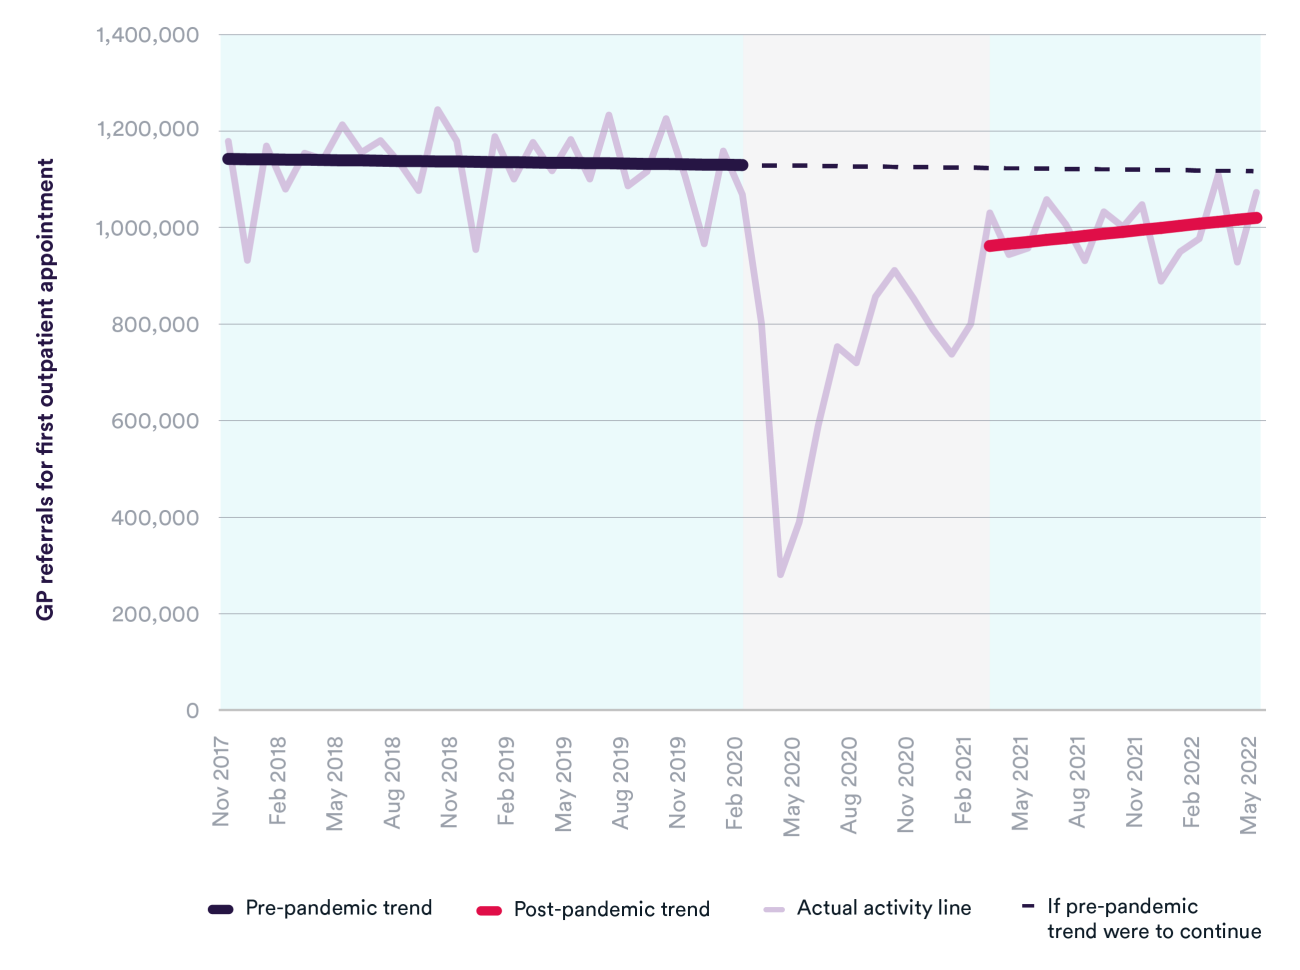
One reason for the lower number of GP referrals could be due to interventions such as Advice and Guidance, which intends to reduce unnecessary referrals and help manage non-urgent patients in the most appropriate setting. This means that GPs are providing more care for patients before referral than previously, which has implications for workload pressures as the number of GPs continues to fall and limited progress has been made in achieving the target of adding 6,000 more by 2024/25. Other reasons for the smaller number of GP referrals include patients not coming forward for care and reduced capacity in hospitals to accept referrals.
Freeing up capacity in hospitals will be more difficult if primary care is unable to deliver timely and effective services to patients, who otherwise may see their condition deteriorate and have greater risk of complications and need for urgent care. A functioning primary care system is also essential for patients and the cornerstone of universal access in the NHS. It is the first point of contact for many patients and key to preventing ill health, detecting disease early and managing chronic conditions.
Elective (planned) care
The total waiting list for elective care was steadily increasing before Covid, from 2.5 million in April 2012 to 4.6 million in February 2020. At the beginning of the pandemic, the waiting list dropped to 4 million as GP appointments and referrals fell. Since then, the waiting list has soared to 6.7 million in May 2022 and is growing at a significantly faster rate than before the pandemic. If pre-pandemic trends had continued, we might have expected the waiting list to be around 5.3 million.
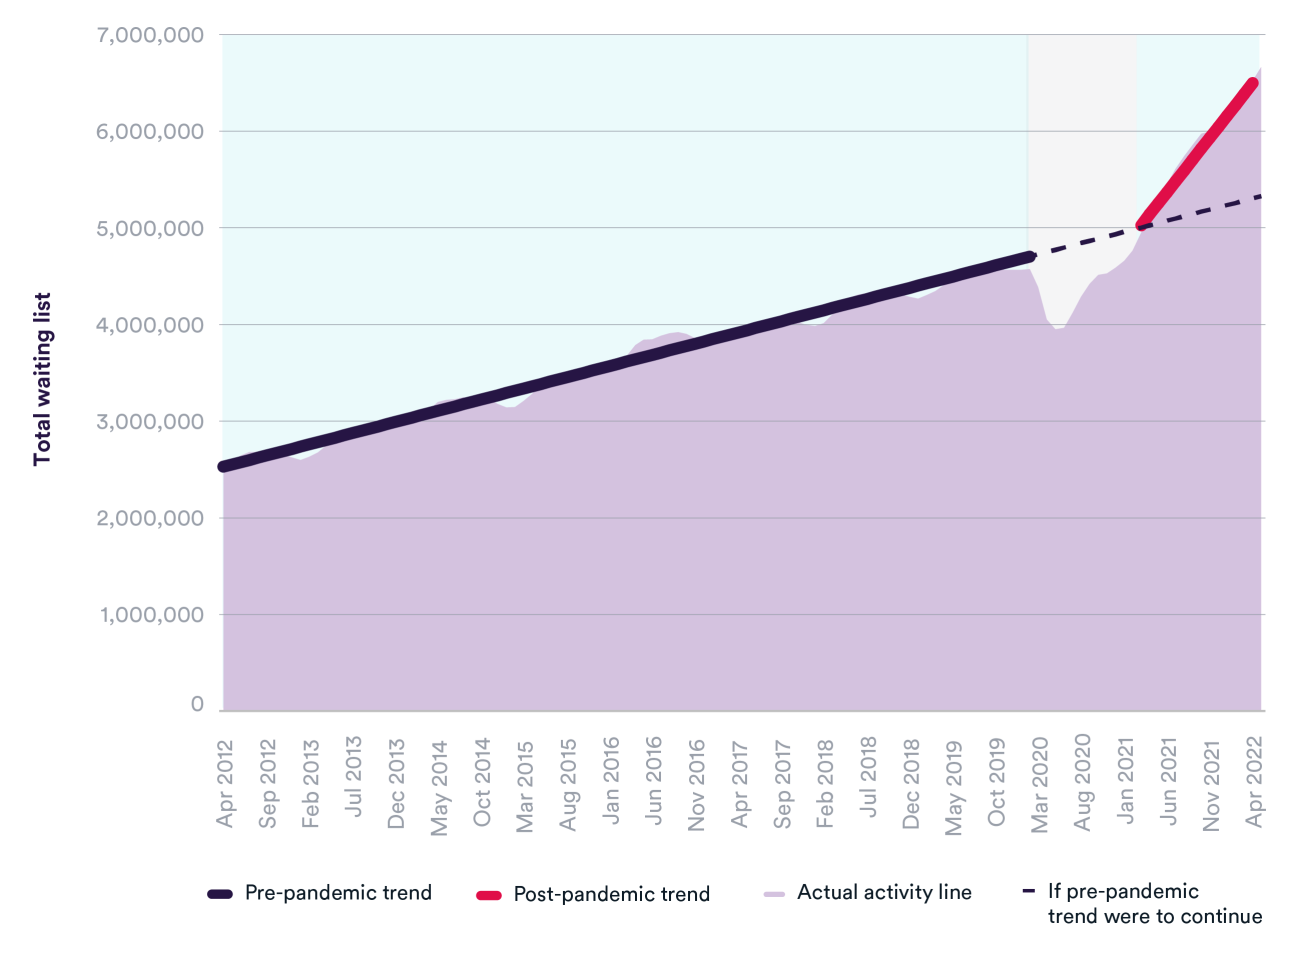
NHS England anticipated that the overall size of the waiting list would increase in the short term, particularly as some of the ‘missing’ patients who avoided accessing care during the pandemic come forward for care, and that the list will only start to decline around March 2024. Many of the ‘missing’ patients have not yet joined the waiting list and, if they do, there is potential for it to grow considerably further.
But what matters more to patients is the length of time they spend waiting for care. Long waits can have serious consequences if it means existing conditions worsen or if patients are unable to carry out daily activities free of pain. The NHS Constitution includes a right for patients to start consultant-led elective treatment within 18 weeks of a GP referral, but performance has declined over time and in May 2022 over 2.4 million people on the list had been waiting longer. During the pandemic, the number of patients waiting over a year for elective care increased dramatically, with over 430,000 one-year waiters at the March 2021 peak. Reducing them has been a key focus of NHS England’s Elective Recovery Plan.
So far, the NHS has made the quickest progress on reducing the number of patients waiting over two years for treatment, which fell from over 23,700 in January 2022 to fewer than 4,000 in June this year. If current trajectories continue, most parts of the country could eliminate waits of over 18 months by April 2023 (except where patients choose to wait longer and in specific specialties). Less progress has been made in reducing one-year waits, which now make up one in 20 people on the waiting list.
One factor driving the faster increase in the waiting list is that elective care activity has generally been below pre-pandemic levels, although the volumes of care delivered are increasing towards where they were before Covid. This is true for both patients requiring admission (such as planned surgery) and non-admitted patients (such as those receiving treatment in outpatients). In the most recent quarter of available data (March to May 2022), there were 9% fewer admitted patients and 1% fewer non-admitted patients for elective care, compared to the same period in 2019.
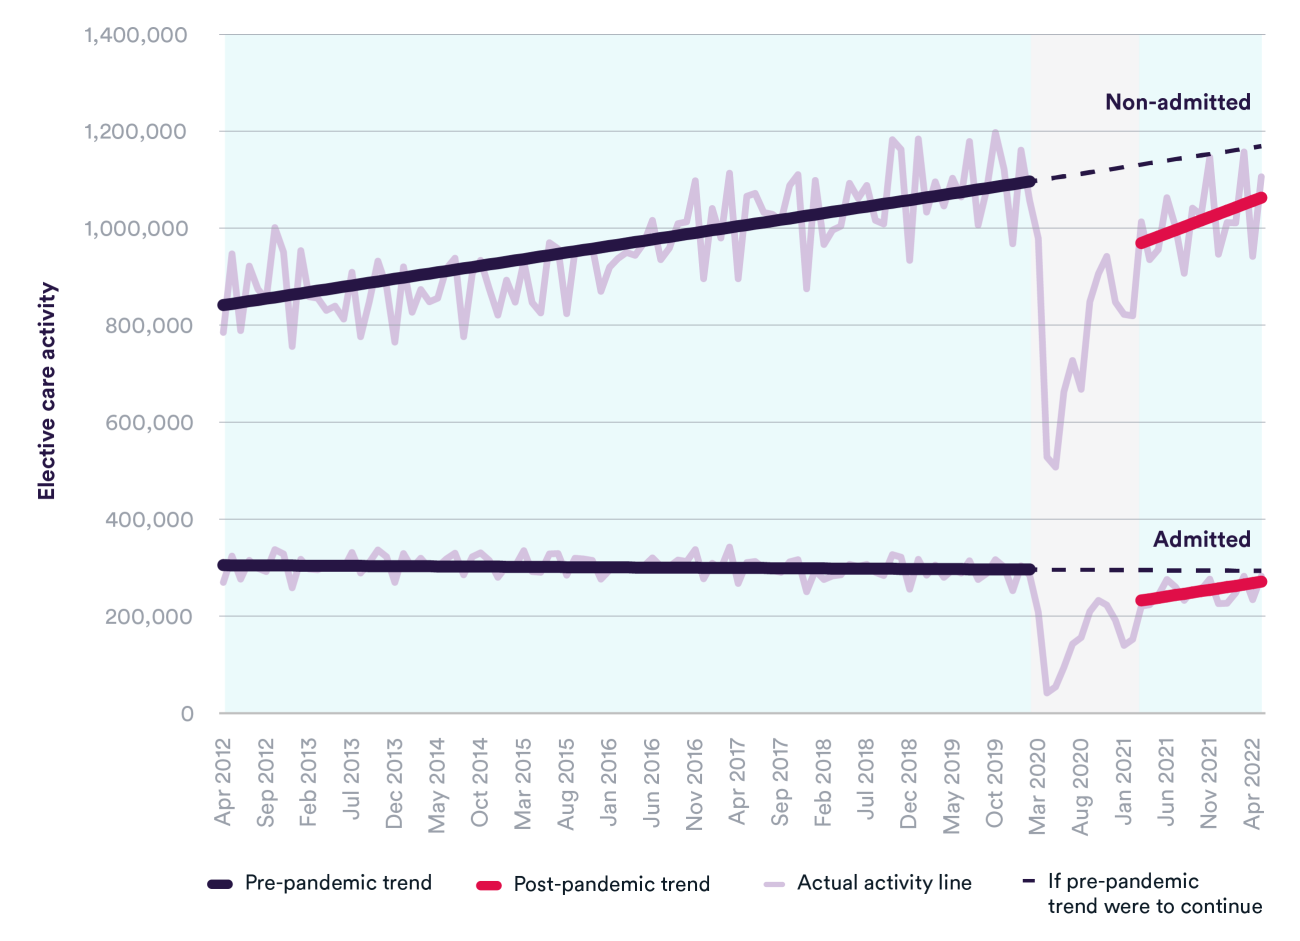
Reducing the size of the waiting list would require the health service to exceed pre-Covid levels of activity to keep up with demand, while catching up on services cancelled and deferred during peaks of the crisis. Despite progress on almost recovering to pre-pandemic activity levels, considerably more elective care will need to be provided to meet NHS England’s target of delivering 30% more elective activity by 2024/25 than before the pandemic.
Diagnostic tests
As with elective care, the waiting list for diagnostic tests was increasing for many years before the pandemic. The number of patients waiting for 15 key diagnostic tests or procedures grew from 632,236 in April 2012 to over 1 million in February 2020. Since the start of the pandemic, the number of patients waiting has grown at a significantly faster rate, reaching 1,566,168 in May 2022 – a 45% increase since the start of the pandemic. If pre-pandemic trends were to have continued, we estimate that the size of the diagnostic wait list would have been around 1.2 million.
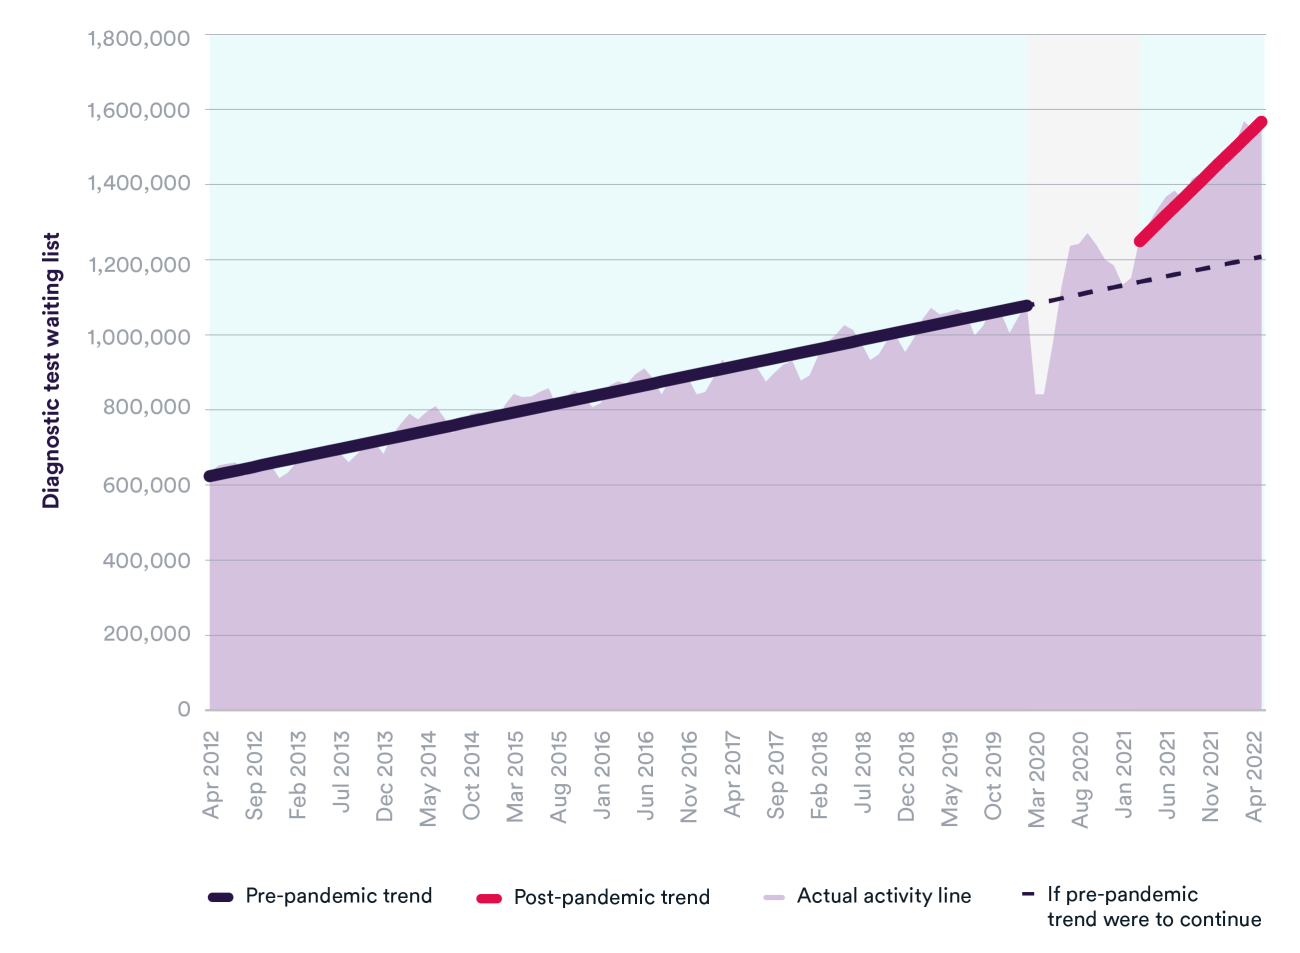
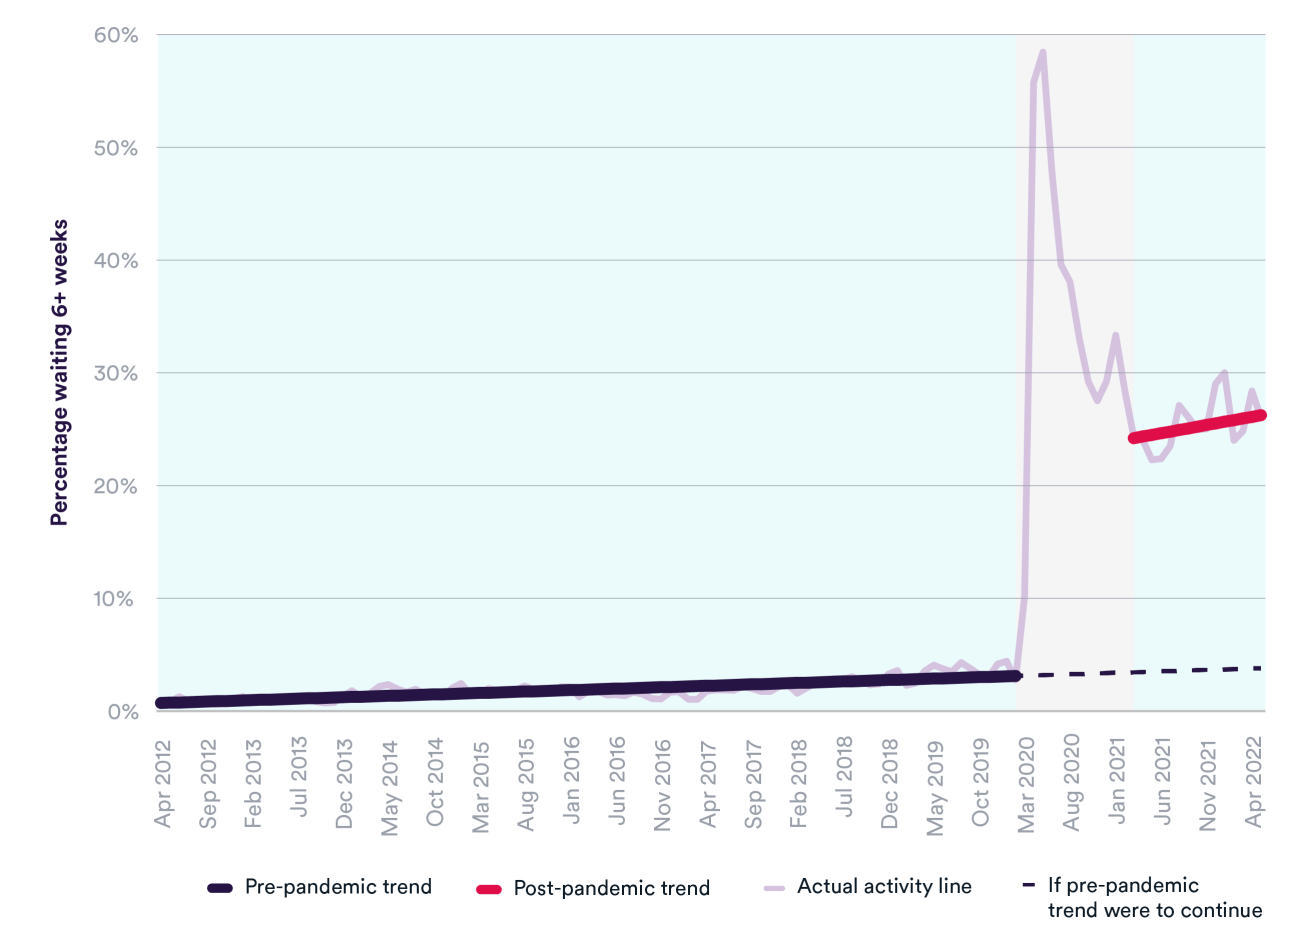
There has also been a sharp increase in the proportion of patients waiting longer than the six-week target for a diagnostic test. Where this percentage was rising gradually in the years preceding the pandemic (from 1% in April 2012 to 3% in February 2020), it reached 26% in May 2022. Similarly, the number of patients waiting 13+ weeks for a diagnostic test has seen around a 25-fold increase during the pandemic.
Longer wait times for diagnostic tests can mean that conditions are caught in a later and more serious stage of disease when there are fewer treatment options, resulting in a worse prognosis and unnecessary suffering for patients. The Elective Recovery Plan commits to delivering around 9 million more tests and checks by 2025, and has invested in growing the number of community diagnostic centres to help make this a reality. However, this depends on investment in staff and equipment, which may be more difficult in the context of the huge and likely unmanageable savings being demanded of the NHS in a difficult financial year.
In terms of the number of diagnostic tests carried out each month, total activity has recovered to the same level as before the pandemic (2% higher in the most recent quarter compared to 2019), but the growing waiting list shows that it is not high enough to keep pace with demand. There is a worrying sign that planned and waiting list tests remain around 4% lower than before the pandemic, while unscheduled tests and procedures are over 30% higher. This signals that more patients are requiring emergency tests following admission to hospital or in A&E.
Cancer waiting times
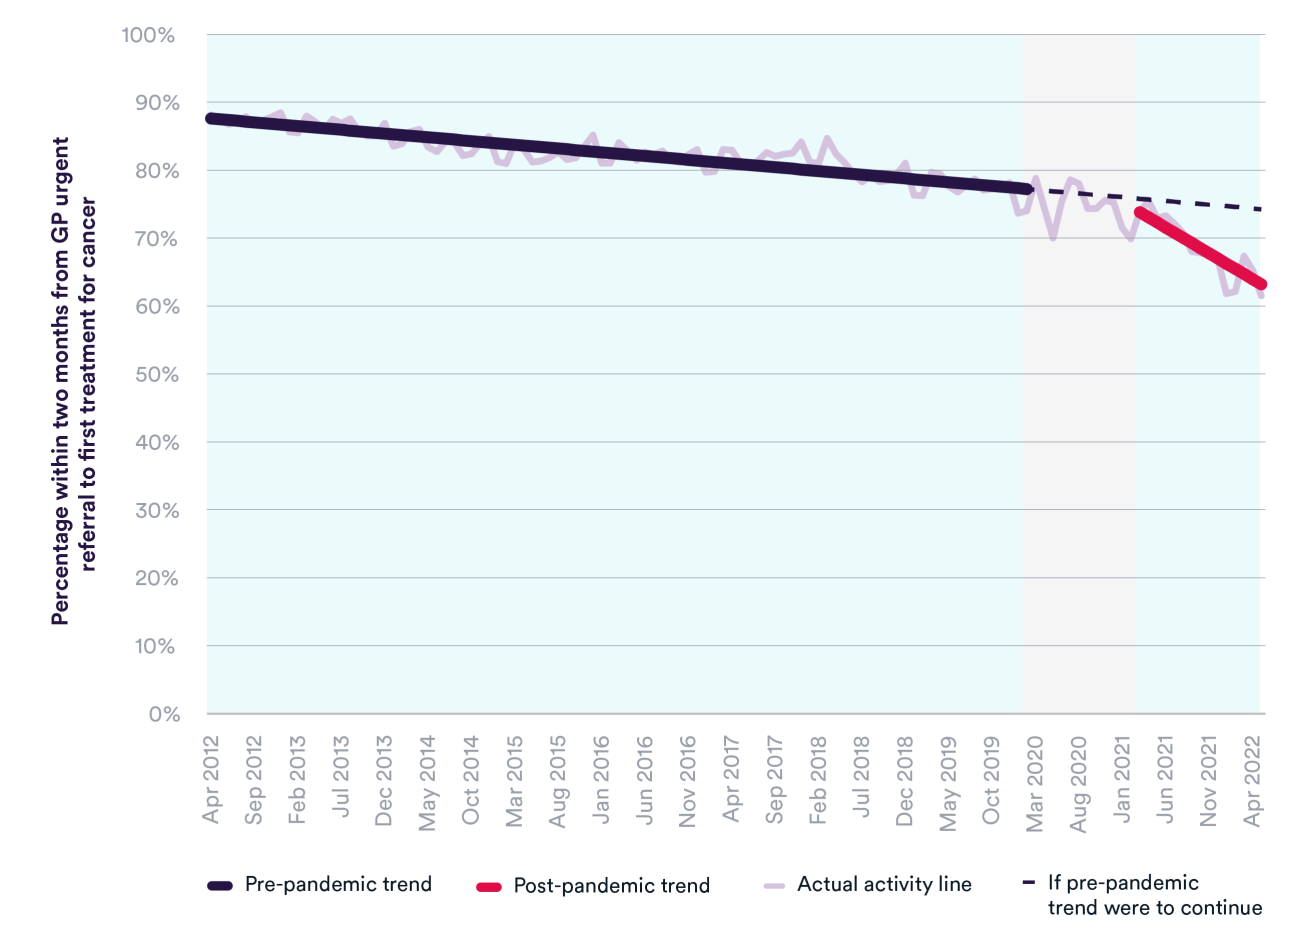
At least 85% of patients are supposed to start their first treatment for cancer within two months of an urgent GP referral for suspected cancer. Performance had been decreasing considerably over time, from 88% in April 2012 to 74% in February 2020. The pandemic has accelerated this trend; in May 2022 a record low of 61% of patients started a first treatment for cancer within two months.
The number of patients seen by a consultant following an urgent GP referral for suspected cancer is at a record high, but there are backlogs for diagnosis and treatment, and there has only been a modest increase in the number of people starting a first treatment for cancer. This has created a shortfall in the number of first treatments while the level of demand has grown.
During the first wave of Covid, there was a considerable fall in urgent referrals and cancer treatment starts, as well as the pausing of cancer screening services. This meant that unfortunately some patients would be presenting later and at a more advanced stage of disease. It led NHS England’s chief executive to launch a campaign encouraging people with potential cancer symptoms to come forward.
But waiting times for cancer treatment are getting worse. In May 2022, almost 6,000 cancer patients starting treatment waited longer than two months from urgent GP referral. The NHS is moving further from the goal of returning the number of people waiting longer than two months to the level in February 2020 (3,316 patients).
A&E
Recovery of elective care and urgent and emergency care are intrinsically linked. In order to ensure capacity is available to undertake planned care and reduce long waits, hospitals need to have enough capacity to admit emergency patients and free up beds by discharging people quickly and safely when they are ready to leave.
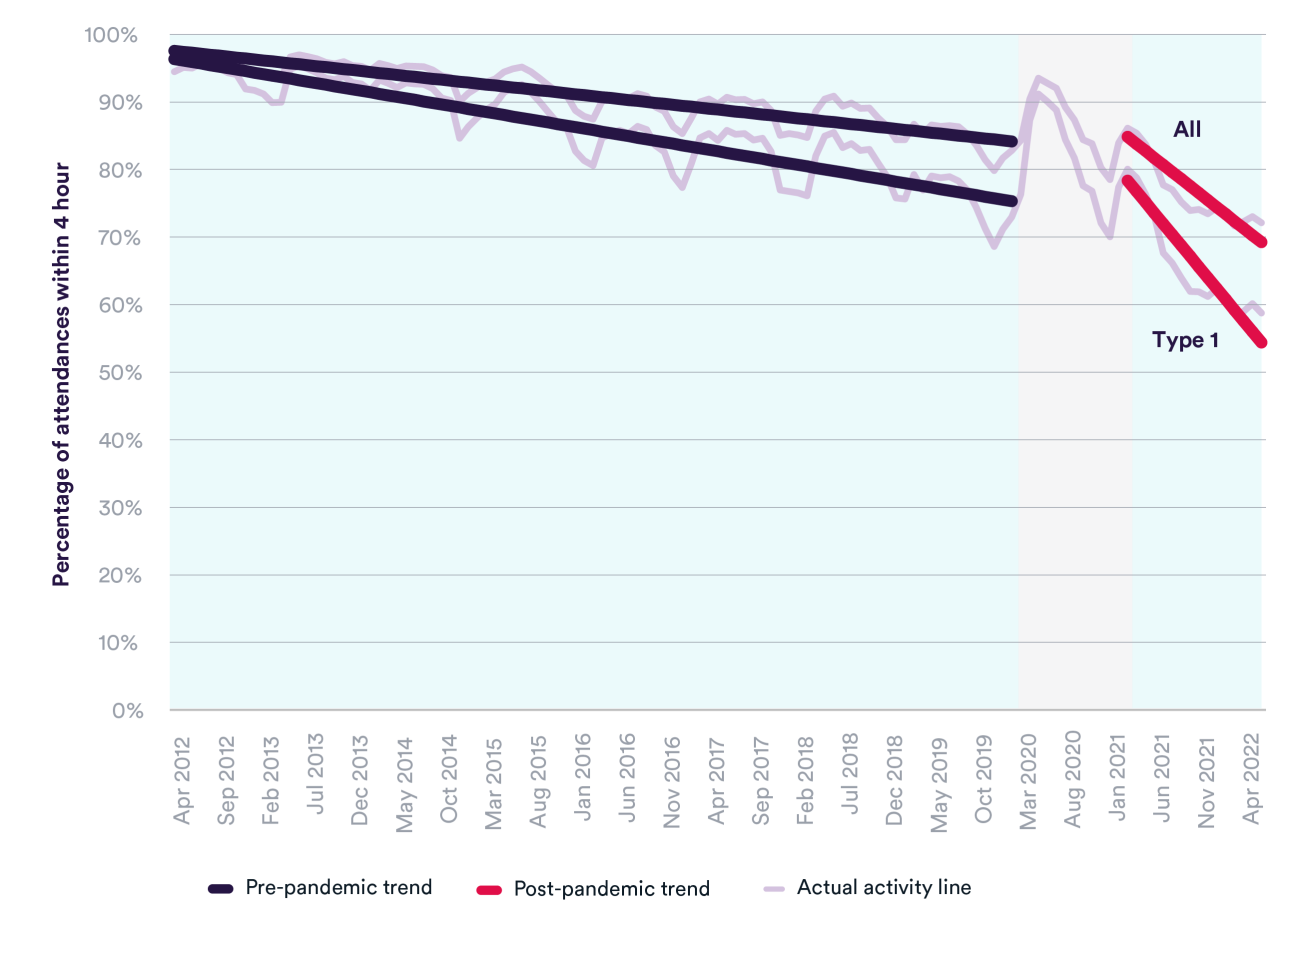
Waiting times in A&E departments were deteriorating long before the pandemic; the four-hour target for patients to be admitted, transferred or discharged was last met in July 2015. Performance improved during the initial Covid waves due to different demands for emergency care, but since March 2021 has been declining at a significantly faster rate than before the pandemic. In June 2022, only 72% of total attendances met the four-hour target, and for attendances at major (type 1) departments this was lower at 59%.
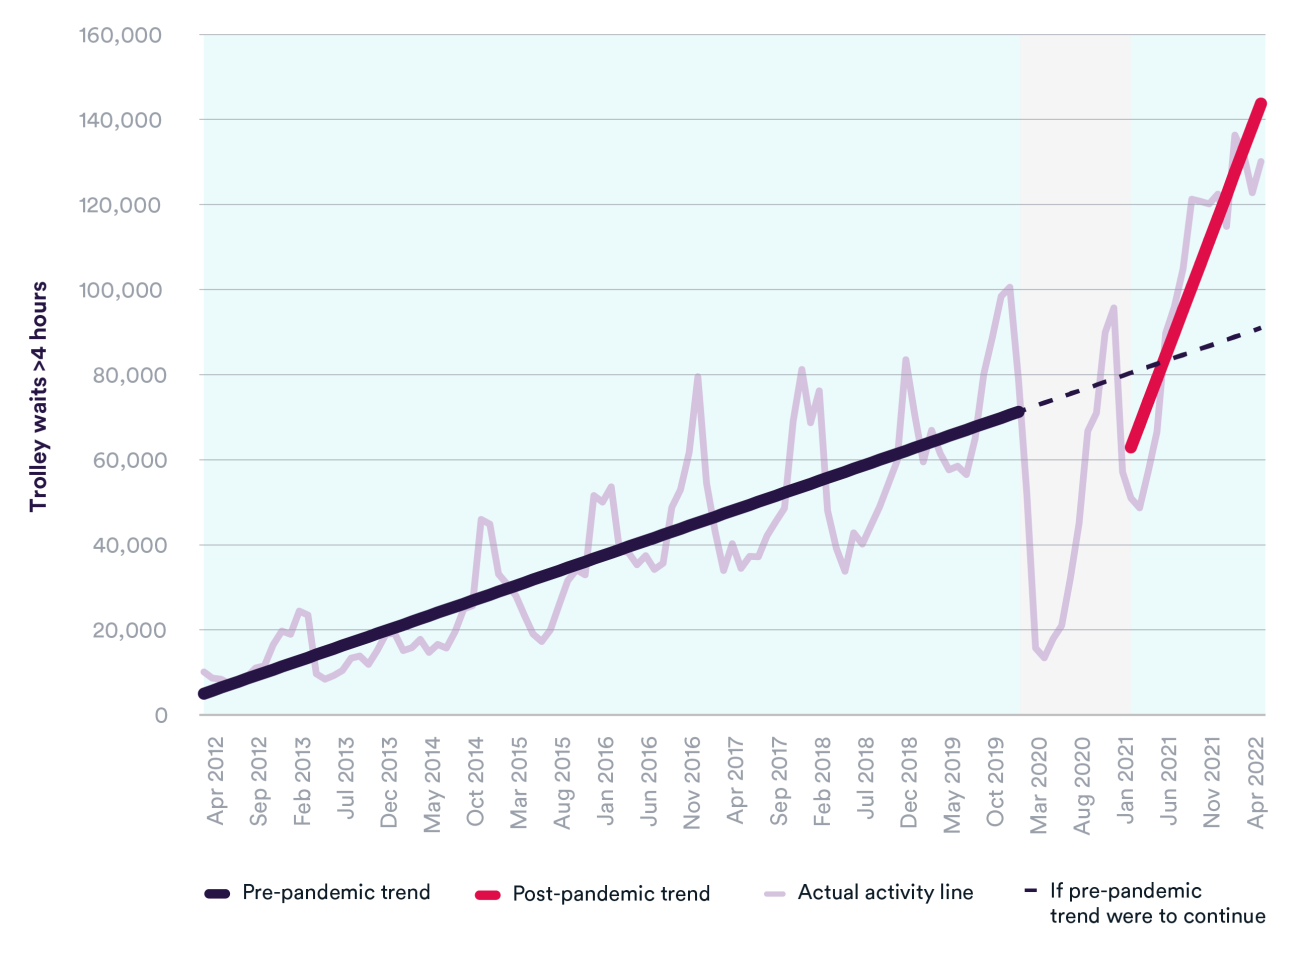
Long trolley waits – the time between a decision to admit and a patient arriving on a hospital ward – were also becoming more commonplace in the years leading up to the pandemic. In the winter of 2012/13 (December to February), there were just over 55,000 trolley waits of over four hours, compared to around 278,000 in the winter of 2019/20. Since the start of the pandemic, the number of trolley waits has grown significantly faster – increasing by almost 30% to over 357,000 in the winter of 2021/22.
Ambulance staff are also facing long delays to hand over patients to A&E departments, which has serious implications for patient care and safety. These delays reflect a whole-system issue that is impacted by challenges including hospital capacity, patient flow, delayed discharge to social care and community services, and increased demand for care.
Ambulance response times
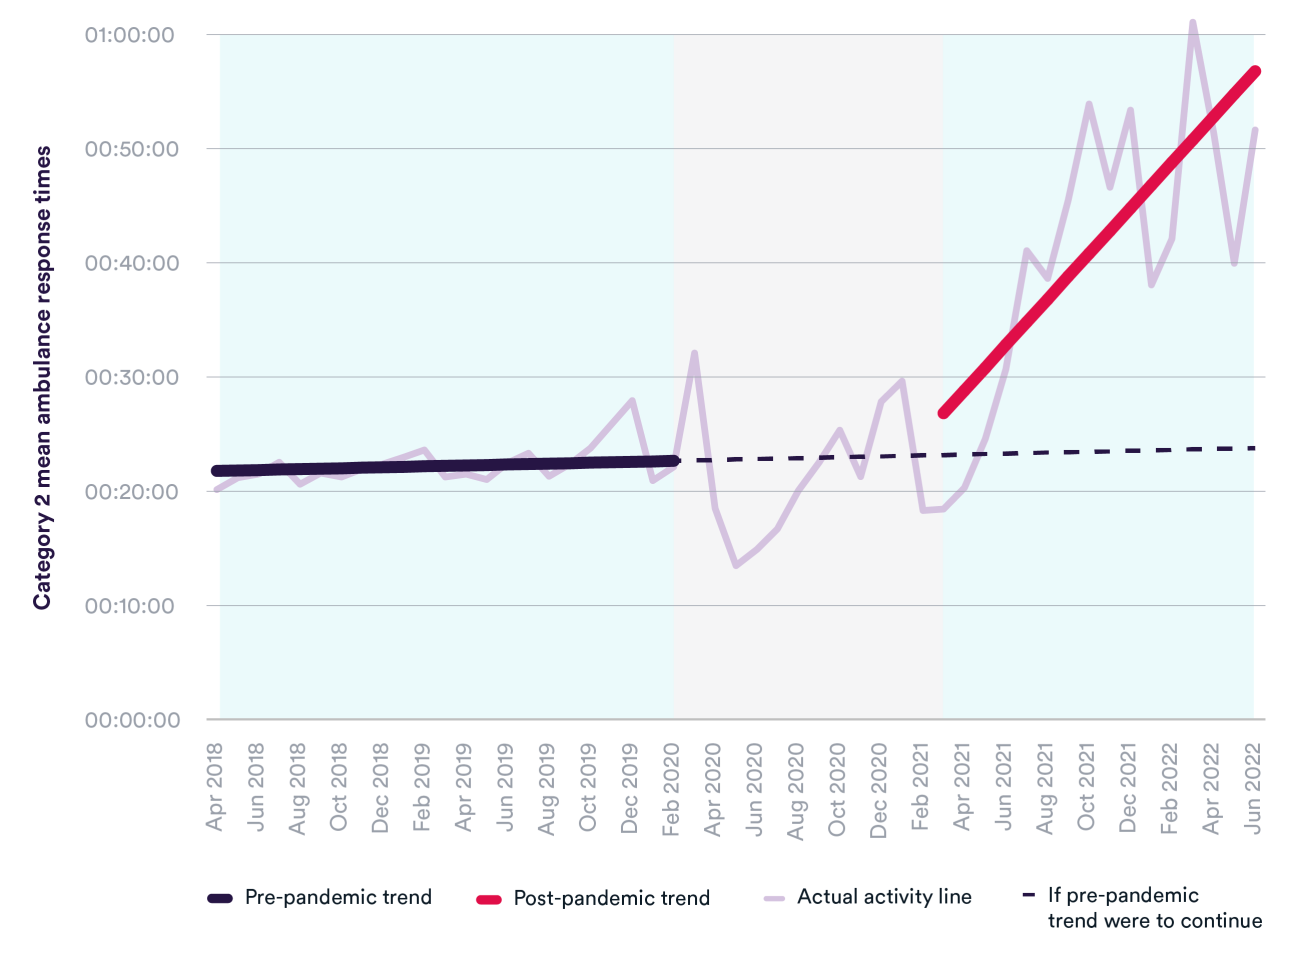
Ambulance services were not meeting the 18-minute mean response time target for emergency incidents (Category 2) before the pandemic. This includes patients who have had a heart attack or stroke. In December 2019, the mean response time reached nearly 28 minutes, with one in 10 patients waiting over 58 minutes for an ambulance.
Since the onset of Covid-19, response times for emergency incidents (Category 2) have worsened significantly. In March 2022, the mean response time was over one hour, and one in 10 patients waited over two hours and a quarter for an ambulance.
Urgent and emergency care systems have been asked to improve ambulance response times and achieve the standards for life-threatening and emergency incidents. They are also tasked with minimising handover delays between ambulance and hospital. Doing so will depend on improving patient flow, reducing shortages of ambulance staff, and ensuring enough capacity in A&E and urgent care to receive patients.
Covid-19: a turning point?
A look across historical trends in key performance measures paints a picture of a system already stretched beyond its limits before the pandemic, with access and waiting times in a gradual but steady decline. This is a situation that has been made significantly worse by Covid-19, given the limited capacity available to absorb a crisis this large and protracted in nature. Heightened infection control practices, rising levels of staff sickness and burnout, and the cancellation of routine care and redirection of staff have seriously constrained the NHS’s ability to provide care.
The current trends point to intensifying pressures in every part of the system that will not go away easily. This makes many of the recovery targets a steep ask to balance alongside ongoing waves of the virus, and persistent staff shortages that are worsening in key areas. Add to this a tightening financial picture, as the NHS faces a real-terms budget cut this year and will have to do even more with less.
This is not to say that the NHS has not risen to the challenge. Services have acted quickly and pulled out all the stops to find efficiencies and adapt service models to see as many patients as possible. But it would be misleading to say that Covid is solely to blame for the crisis we now see in NHS services. Covid has accelerated the trajectory the NHS was already on, and makes the size of the NHS backlog less an unexpected aberration but rather a predictable consequence of the pandemic, for a system where pressures have been mounting for some time.
Suggested citation
Morris J and Reed S (2022) "How much is Covid-19 to blame for growing NHS waiting times?" QualityWatch: Nuffield Trust and Health Foundation.