

The impact that the Covid-19 pandemic is having on mortality is stark.
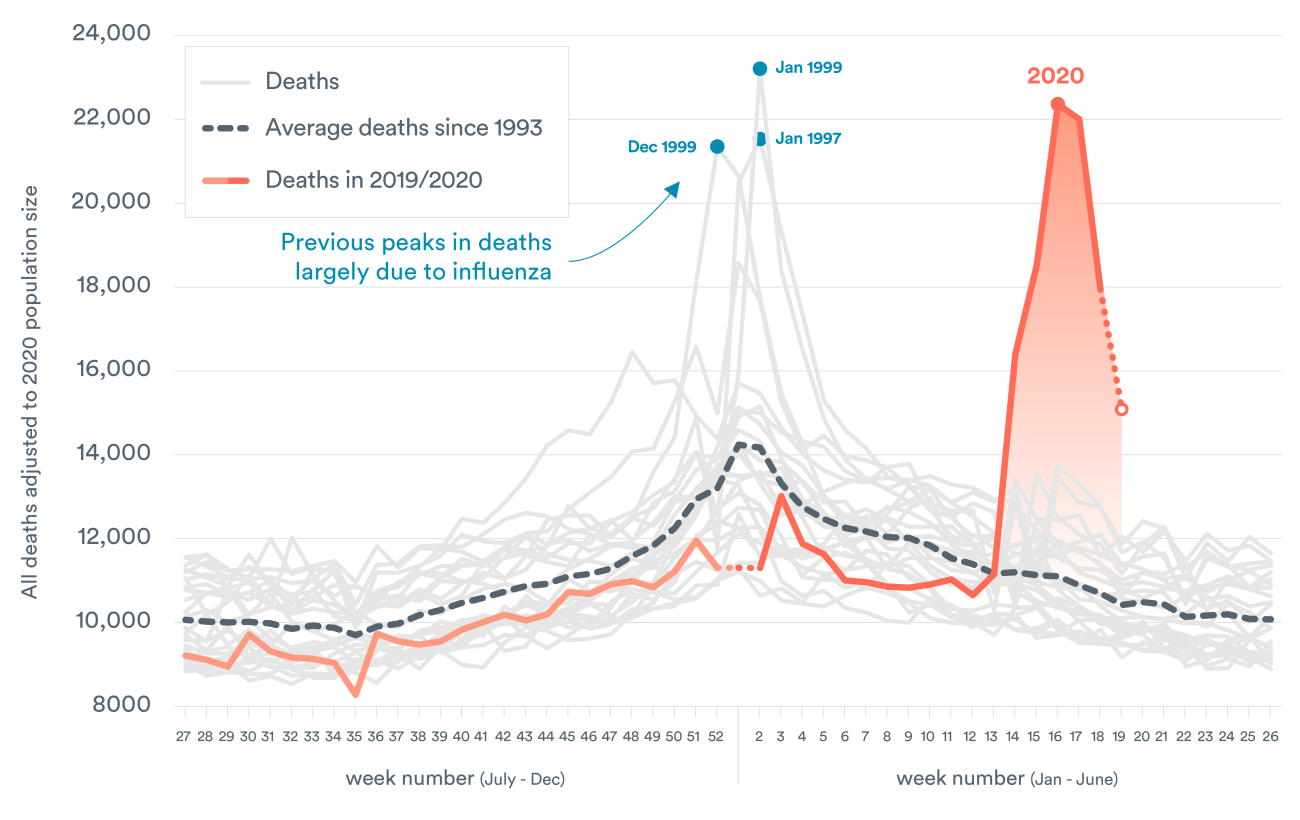
Total deaths in England and Wales reached 22,351 in the single week ending April 17th (week 16) of this year. This is double the average number of deaths in that particular week over the previous 26 years. Deaths where Covid-19 was mentioned on death certificates accounted for 40% of all deaths in week 16, and 80% of all ‘excess’ deaths above the 26-year average.
Piecing together data since 1993 and adjusting actual deaths for changing population size over time, the peak in deaths this spring looks similar to three previous winter peaks: in 1997 and twice in 1999 (due to influenza outbreaks). However, without the unprecedented lockdown and health service measures to combat Covid-19, the rise in deaths would undoubtedly have been substantially higher.
The latest official figure for weekly deaths (12,516) appears to be an underestimate due to underreporting of deaths on the final day of that week, which coincided with a bank holiday. We estimate that the actual number of deaths might be in the region of 15,000.
Whatever the precise numbers, the positive news is that total deaths have fallen since mid-April. However, the course of the pandemic remains somewhat uncertain and there remains a possibility of increases in deaths as lockdown measures are progressively relaxed.
Notes
- Data from mid-1999 to mid-2019 are for date of occurrence rather than date registered. Trends by date of registration are susceptible to having relatively higher spikes due to under-reporting on bank holidays and subsequent catching up of these death registrations. Data until mid-1999 exclude non-residents who died in England and Wales.
- Due to apparent delays in reporting of deaths from 2019 week 52 to 2020 week 2 and the same point in 1997/98 which creates artificially large peaks and troughs, we have taken averages over these periods. This may supress peaks during these periods.