

The NHS was founded on the principle that care should be free at the point of use, with access based on need, not the ability to pay. This remains a key principle of the NHS today. The creation of the NHS did not immediately address inequalities in care across socioeconomic groups. In nationalising the patchwork of existing services, unequal access to health care was hardwired into the health service from the start. Nearly 50 years ago, Julian Tudor Hart highlighted the “Inverse Care Law” by which access to good quality care was worse in areas of greatest need. Since the 1970s, there have been continued efforts to address this by improving access to services and implementing policies that match funding to need. Despite this, inequalities in the quality of care between socioeconomic groups remains a concern.
We know that looking at variations in the quality of care across different socioeconomic groups only tells us about one dimension of health care inequality. Other types of inequality – such as gender, ethnic and regional – exist too but are out of scope for this study.
Addressing inequalities in health care quality, use and access, is high on the policy agenda for the NHS. The Long Term Plan recognises that while the NHS has a limited role and ability to shape the wider determinants of health, such as income or housing, it should contribute to “reducing health inequalities and addressing unwarranted variation in care”. It aims to do this by allocating a higher share of funding to areas with greater health needs, and by targeting care for people with complex needs.
But while NHS policies are aiming to reduce health care inequalities, there is growing concern that welfare and social care spending cuts are having the opposite effect and causing inequalities to widen. For example, the Sure Start initiative that aims to improve childcare, early education, health and family support particularly for people in the most deprived areas, has been shown to be effective in reducing the gap in health outcomes but has been cut in recent years.
There is also evidence that the Inverse Care Law is persisting in primary care, as a result of pressures on the workforce and a growing number of people living with multiple health problems. This may be affecting deprived areas to a greater extent, resulting in a double deficit, where people in these areas have greater needs but also poorer access.
This QualityWatch annual statement builds on our quality indicators to ask whether inequalities in the quality of care between socioeconomic groups have changed over the last 10 years.
How did we choose the measures?
The 200+ QualityWatch indicators monitor how the quality of health and social care is changing over time and are a key element of the programme. They cover a wide range of services and aspects of quality and are grouped into domains and sectors. This enabled us to take a systematic approach when choosing which measures to use for the analysis.
The indicators were selected:
- to include a broad range of care quality measures from across the QualityWatch domains and sectors
- to provide trend data over a 10-year period (2008/09 to 2017/18) where possible
- to use data that was publicly available or calculate additional measures using Hospital Episode Statistics (HES) data.
We also considered data quality issues and comparability over time. See About the data for more information.
Which measure of deprivation did we use?
We chose the Index of Multiple Deprivation (IMD), which is a measure of deprivation for small areas in England (each area covers approximately 1,500 people). It ranks every small area from most deprived to least deprived, and combines information from the following seven sources to produce an overall relative measure of deprivation:
- Income
- Employment
- Education, skills and training
- Health deprivation and disability
- Crime
- Housing and local services (eg. food shops)
- Living environment
For each quality indicator, we compared trend data for the 10% of people living in the most deprived areas with the 10% of people living in the least deprived areas.
How did we measure the inequality gap?
Health care inequalities can be measured in different ways. We considered both absolute and relative inequalities. Using a simple measure of relative inequality, we were able to:
- see how the level of inequality between the most and least deprived groups has changed over time for a particular indicator
- compare the level of socioeconomic inequality across different indicators.
The QualityWatch data story presents trend data for seven key indicators of quality of care. It looks at whether the overall trend for the indicator is getting worse or better, and if the inequality gap is widening or narrowing. The interactive chart that follows lets us compare the size of the inequality gap between a larger set of indicators.
What did we find?
Across all of the indicators, people living in the most deprived areas of England experience a worse quality of care than people living in the least deprived areas.
The size of the inequality gap is greatest for measures that are more influenced by the wider link between deprivation and ill health, such as avoidable mortality, smoking prevalence and emergency admissions to hospital. Measures relating to children and young people also show large inequalities, which is in line with previous research carried out by the Nuffield Trust. In contrast, measures of patient experience and access to services show smaller inequalities, although there is still a gap between the most and least deprived areas.
Looking at the trends over time, for many measures of care quality the inequality gap has widened, although for others it has narrowed or stayed the same.
In general, when the trend shows that the overall quality of care is getting worse, the inequality gap has widened. This is the case for A&E waiting times (which have worsened everywhere in recent years), experience of making a GP appointment, overall experience of GP services, emergency admissions for pressure sores and pneumonia, and obesity in Year 6 children (aged 10-11 years).
Conversely, for a number of indicators where the quality of care is getting better, the inequality gap has narrowed. Examples include unplanned hospital admissions for asthma, diabetes and epilepsy in children, recovery rate following psychological therapy and people being able to die at their usual place of residence.
But not all the indicators follow this general pattern. Teenage pregnancy rates have declined overall, but the reduction has been relatively greater for people in the least deprived areas, resulting in a widening inequality gap. Another example is hospital admissions as a result of self-harm in children and young people, where the rate of admissions has increased but only in the least deprived areas, leading to a narrowing inequality gap.
What can we learn from this?
Comparing the level of socioeconomic inequality across different measures of care quality teaches us two key things. Firstly, the inequality gap is smaller for measures of patient experience and access to services, where the NHS is able to make more of an impact. This suggests that the NHS is relatively effective at addressing inequality in the delivery of its services – a finding that is in line with international comparisons that highlight how the NHS combines universal health care access with a high level of financial risk protection.
Secondly, the inequality gap is greatest for measures such as avoidable mortality and emergency admissions to hospital, which are more related to the wider determinants of health. This includes the conditions in which people live and work, the level of social and community support, and how these influence individual lifestyle factors. The NHS has less influence over these wider social factors. Cross-sector action, ranging from tackling poverty to investing more in education and public health services, is needed to reduce the inequality gap.
Turning next to trends over time, we found that the inequality gap has widened for many measures of care quality over the last decade. When the overall trend for an indicator shows declining quality, such as A&E waiting times, the difference in quality of care between people in the most and least deprived areas has tended to widen. Only a small number of measures where there has been an increase in service provision in recent years – for example, access to psychological therapies – have shown a reduction in inequality.
This is especially concerning given the financial and workforce pressures that the NHS and social care are currently facing. QualityWatch has reported that waiting times are at record levels, services are being stretched to full capacity, and patient experience is getting worse. If the quality of access, outcomes and experience of care continues to deteriorate, the inequality gap between the most and least deprived groups may widen further.
Our analysis raises questions about whether the policy initiatives that are currently in place to reduce inequalities in the quality of care (see table below) are going far enough.
Policy initiatives to address inequalities in the quality of care
Challenge |
Relevant policy initiatives
|
|
People from deprived areas have more complex health needs, resulting in services not being able to meet the needs of these patients, even with increased funding. |
The Long Term Plan (LTP) aims to ensure that areas with the highest needs are funded accordingly, with additional targeted spending in some areas. The LTP also includes a requirement for CCGs to monitor inequalities. |
|
Delivering services in deprived areas is more challenging, and this results in recruitment and retention difficulties, leading to a mismatch between capacity and need. |
The Five year forward view proposed targeted GP recruitment, to improve staffing in more deprived areas. |
|
People in deprived areas may need more support to make the best use of health services, due to lower health literacy and digital skills, and less ability to advocate for themselves and understand how the system works. |
The LTP proposes support for carers and closer working between the NHS and community organisations, as well as continuity of midwife care for vulnerable groups. The Widening Digital Participation programme aims to help people with low digital skills to improve these to get better access to care. |
|
People with fewer social support networks may need more support to look after their own health, particularly people with multiple long-term conditions. |
UPC proposes tailored support for people with complex needs, for example, personalised care and support planning. |
|
Socially disadvantaged groups may need to prioritise other aspects of their lives before health care – for example, housing or job seeking – meaning they present later when their condition is worse, and make less use of preventive services. |
The UPC programme includes more support for people to manage their own care. The LTP includes services for rough sleepers, and using targeted approaches to tailor services and roll-out more accessible preventive care to those who need it most. |
It is clear that more work is needed to understand what is driving the increase in inequalities and how to improve the effectiveness of interventions. We have also identified issues that need further exploration. In particular, the widening inequality gap in emergency admissions for people with a pressure sore and the worrying trend in hospital admissions as a result of self-harm in children and young people.
******************************
About the data
Deprivation
The Index of Multiple Deprivation (IMD) is the official measure of deprivation for small geographical areas in England. These small areas are called Lower-layer Super Output Areas (LSOAs). The Index of Multiple Deprivation (IMD) combines information from several sources of data such as income, housing, employment and education.
For the measures of health care quality used in this analysis, each patient was allocated an IMD score based on the small area in which they live. The population of England was then divided into ten deciles, based on IMD scores. The most deprived decile is the 10% of the population with the highest IMD scores, and the least deprived decile is the 10% of the population with the lowest IMD scores.
The 2015 version of IMD was used for all indicators, but for some indicators there is a break in the time series when the earlier 2010 version switches to the 2015 version. There are additional breaks in the series for some of the quality measures. For example, the 2017/18 experience of making GP appointments data is not comparable with previous years due to changes that were made to the 2018 GP Patient Survey.
For each measure of quality, we compared trend data for the most deprived decile with the least deprived decile. This approach meant losing some information about inequalities for each measure across the whole population. But it did allow us to apply the same approach when using published data sources (e.g. the NHS Outcomes Framework) as well as when additional analysis was undertaken using patient-level data.
Inequality gap
To calculate the inequality score, we divided the indicator value for the most deprived decile by the indicator value for the least deprived decile, and then calculated the difference from 1.
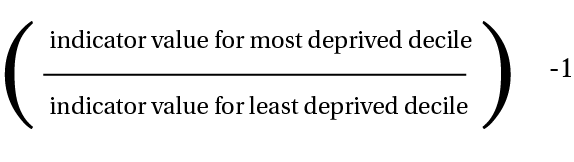
The higher the inequality score, the larger the inequality gap. The score was turned into a positive number when the quality of care was worse for people in the most deprived areas. This last step was necessary as for some measures a high indicator value represents a good outcome (for example, the percentage of people reporting a good experience of making an appointment at their GP practice), and for others a bad outcome (emergency admissions to hospital for a pressure sore).