

The waiting list for planned care in England reached a record high of 7.4 million in April this year, as a result of under-investment in the NHS in the decade leading up to Covid-19, and disruption to planned care during the pandemic.
There are plans for the private sector to play a more active part in addressing waiting lists, through new care arrangements struck between the NHS and private providers. At the same time, the role of the private sector in supporting the NHS is hotly debated, reflecting long-standing concerns that a strong private provider sector threatens the viability of the NHS. Meanwhile, there is evidence that more people are paying for care directly themselves, even if they do not have private insurance.
So is the increase in private provision significant, and how will it impact on the NHS? Understanding the impact of growing waiting lists on the balance of public and private provision of health care requires a complete picture of how planned care is delivered and funded – across both NHS and private sectors. Here, we bring data together from both sectors to describe the extent and implications of private sector involvement in elective inpatient care. Our analysis covers the year leading up to and the first two years of the pandemic.
Where does this data come from?
-
This explainer only discusses planned inpatient care – hospital treatment that has been arranged in advance and requires admission to hospital. It excludes outpatient consultations and other forms of private provision, including by GPs who are largely independent contractors.
-
Planned care can be paid for by the NHS but delivered by private providers and vice versa. We use Hospital Episode Statistics (HES) for data on care that is either delivered or paid for by the NHS and Private Healthcare Information Network (PHIN) for data on care that is both paid for and delivered privately.
-
The analysis is undertaken for hospital spells, which is the total time a patient spends in hospital between admission and discharge. See the data notes for more detail.
-
Data is reported for financial years, which run from April to March. For example, 2021/22 refers to April 2021 to March 2022.
How is health care split between the NHS and the private sector?
In 2021/22, the most recent full year for which data is available, there were almost 10 million admissions to hospital across England for planned care. The volume of NHS care is a different order of magnitude to private care, with most care (87%) delivered by the NHS and an even larger majority (92.5%) funded by the NHS.
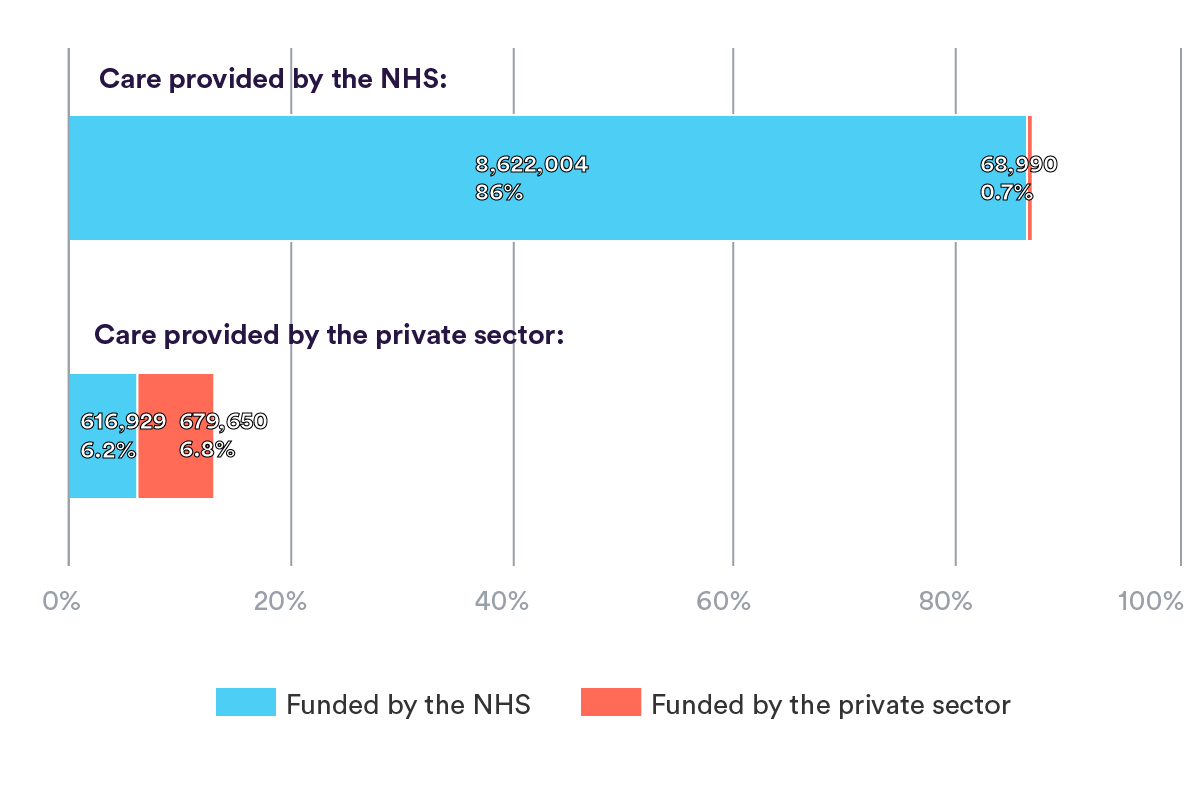
The most common form of care (86%) was that paid for and delivered by the NHS, amounting to 8.6 million elective admissions. Conversely, the smallest volume of care was that provided by the NHS but paid for privately, with 68,990 admissions that accounted for less than 1% of the total volume of care. A similar proportion of privately provided care was funded privately (6.8%) as by the NHS (6.2%). Most care that was paid for by each sector was provided within that sector, i.e. most NHS-funded patients received NHS-provided treatment, and most privately funded patients received privately provided treatment.
How did the NHS/private split change during the pandemic?
In 2020/21, the first pandemic year, the total volume of elective inpatient admissions fell by a third compared to 2019/20, from 11 million to 7.45 million. Although activity rose again during 2021/22, total activity reached only 10 million, which was still 9% lower than the year before the pandemic, as shown in the chart below.
In 2020/21, activity fell across both NHS and private providers, and for care funded by both sectors (table 2). The largest relative fall was in privately funded, NHS-provided care, which fell by almost half, from just under 87,000 to just under 44,000 spells.
NHS-provided care decreased during the first pandemic year, as hospitals reorganised their work to respond to Covid. This included not only treating Covid patients, but also ensuring that Covid and non-Covid patients were treated separately, and dealing with significant staff sickness. Privately provided care also decreased, and did so by a slightly higher proportion than NHS care (35% compared with 32%), from 1.23 million to just over 800,000 spells.
By 2021/22, the volume of activity had increased across all sectors, but the increase relative to 2020/21 was higher for privately funded and delivered care than for NHS-provided and funded care. NHS-funded care provided by the private sector grew by 63% between the first and second pandemic year (from 380,000 to 617,000), compared with an increase of 31% for care funded and provided by the NHS (from 6.6 million to 8.6 million). NHS-provided, privately funded care partially recovered, with an increase of 57% to 69,000 spells, while privately funded and provided care increased by a similar proportion from 426,000 to 680,000.
Although overall activity in 2021/22 was still below the pre-pandemic year, privately provided activity had recovered more quickly – indeed, privately provided and funded activity increased to 10% above the pre-pandemic year. NHS-funded and privately provided care almost recovered to 2019/20 levels, being around 617,000 spells in both years. NHS-funded and provided care remained 11% lower in 2021/22 than in 2019/20, and privately funded NHS provided care had fallen by almost 21%.
The cumulative impact of these changes on elective care is that between 2019/20 and 2021/22, there was an increase in proportion of privately provided care from 11% to 13%, and a decrease in proportion of NHS-provided care from 89% to 87%.
How does NHS and private activity vary by region of the treatment provider?
There are regional differences in who pays for and provides care. London and the south have a higher proportion of privately funded and provided activity than the northern areas.
The regions with the lowest proportion of entirely NHS-funded and provided care were London and the South East, with only 85% and 83% of care being NHS-funded and provided. They also had the highest proportion of care paid and provided for privately, accounting for 10.5% of spells in London, and 10.1% in the South East. Conversely, for the North East, North West, Yorkshire and the Midlands regions, elective admissions were almost entirely funded by the NHS (94-97%), and fewer than 6% were paid for privately.
Most privately delivered care in London, the South East and the East of England was paid for privately. This pattern did not hold true for any of the other regions, where most privately delivered care was paid for by the NHS. London NHS providers rely most on privately funded activity, with 2% of all London activity being privately funded but delivered in NHS hospitals.
People living in London and the South East are more likely to pay for private care. High-disposable income and low deprivation are associated with higher household spending on health care. The population in London and the South East is, on average, much wealthier than the north.
How does NHS and privately provided activity vary by clinical procedure?
For most common procedures, the proportion that are privately provided is around 10% or below, falling to only 3% of cardiac therapeutic and cardiac diagnostic procedures, as shown in the chart below.
However, hip and knee replacement and cataract procedures had an even split in provision between the NHS and the private sector. Around half of the total hip and knee replacements (51%) and cataract procedures (46%) were provided privately. Since these procedures are standardised and less likely to occur as emergencies, they are better suited than other procedures for the private sector that don’t have the facilities to accommodate emergency situations.
The completion of hip and knee replacements by private providers has been growing steadily since 2012/13, as the ability of the NHS to allocate capacity towards planned surgery has shrunk. Consequently, private providers have been looking to increase productivity to cater for higher demand from patients for these procedures. As of 2021/22, of all private providers who delivered NHS-funded care, a quarter specialised in ophthalmology. There is a well-developed private provider market for this specialty.
The distribution of elective procedures by funding and by provision are similar, with most care either paid for or provided by the NHS as opposed to the private sector. However, procedures were more likely to be privately provided than privately funded. While half of the total hip and knee replacements were provided privately, only a quarter were paid for privately. Similarly for cataracts, close to half were delivered privately, but one in 10 were paid for privately.
As described earlier, most NHS-funded procedures were delivered by the NHS, and most privately funded procedures were delivered by private providers. However, the proportion of ‘mismatched’ funder/provider care arrangements differed by procedure.
A very small proportion (<0.5%) of NHS-funded patients received treatment by a private provider for cardiac procedures. Conversely, the proportion of NHS-funded procedures delivered by private providers was highest for hip and knee replacements (36%) and cataracts (41%). At least one in three of these types of procedures, albeit paid for by the NHS, were conducted in the private sector.
Under one in 10 privately funded patients received treatment by the NHS for cataracts, hip and knee replacements, dental, and gastrointestinal procedures. However, at least two in five (41%) cardiac therapeutic procedures paid for privately were provided by the NHS. An even larger proportion (56%) of patients paying privately for cardiac diagnostic procedures received treatment by the NHS. This is plausible given the scant amount of private provision available for these procedures and was also evidenced by the small group of NHS-funded patients who received private treatment for cardiac procedures.
Implications for the NHS and elective recovery
Planned inpatient care fell across both the NHS and private sectors in the first year of the pandemic. However, while the NHS has struggled to recover activity to pre-pandemic levels, private sector activity has grown. Privately funded and provided activity was 10% higher in 2021/22 than before the pandemic, while NHS-funded and provided care fell by 11% over the same period.
Critics identify threats to the NHS and the dangers of a two-tier system emerging as the health system is put under pressure from increasing demand and inadequate resources, while advocates for the private health sector are quick to highlight the benefits the NHS gains from private sector capacity. Yet while it is true that the private sector has been able to recover, and indeed increase, capacity more quickly than the NHS, we must be careful not to overstate the role that the private sector can play in addressing those long NHS waiting lists.
NHS-funded and provided activity still accounted for 86% of all elective inpatient care in 2021/22. Our analysis shows that privately provided and funded care only accounts for a substantial proportion of activity for procedures where the private sector already has a stronghold such as cataracts and joint replacement, for which the NHS has outsourced care over a long period.
For most people, and most groups of procedures, NHS-funded and provided care is the norm. This is particularly the case for procedures often also undertaken in emergency settings, such as cardiac procedures, where NHS care predominates. Privately funded and provided activity is also much higher in London and the South East than elsewhere in England.
Waiting times for treatment are a key political battleground and a significant cause of record levels of dissatisfaction with the NHS. However, there is also continued strong public support for the fundamental principles of the NHS being tax funded and free at the point of use. Despite the increase in private sector activity, and more people going private in the face of long waits for care, trends in activity do not suggest that a significant shift in the NHS model is likely.
However, the challenge for the NHS to increase activity to meet demand is greater in some parts of the country than others, and risks further increasing inequalities in care. There are lower levels of NHS-funded private provision in the least wealthy parts of England. In these same areas, the demands for urgent treatment in the face of worsening health across the population impact on the ability of local health systems to increase activity for planned care.
Data notes
Hospital spells refer to a continuous stay at one hospital, the total duration of time between admission and discharge.
For data sourced from HES, an NHS provider refers to those given the label ‘care trust’, ‘CCG’, ‘NHS foundation trust’ or ‘NHS trust’ in the PROTYPE field in HES. A private provider refers to those given the label ‘independent sector provider’ and ‘treatment centre at an independent sector provider site’ label in the PROTYPE field in HES. An NHS-funded patient is classified as someone given the label ‘1’ and a privately funded patient is classified as someone given the label ‘2’ in the ADMINCAT field in HES.
In the PHIN dataset, a private provider is one who subject to the CMA order is required to report all changes to a site’s status to PHIN. These are further sub-categorised by sector into ‘independent hospitals’ and NHS PPUs (private patient units). Data from independent hospitals where each record had an admission category of private patient (ADMINCAT=2) was used to constitute privately funded, privately provided data from PHIN.
Procedure codes across HES and PHIN were mapped using a guidance document provided by PHIN that matched PHIN procedure names to primary procedure codes in HES. A list of common procedures was compiled based on the justification used in this report.
This report uses Hospital Episode Statistics (HES) data (year range 2019/20 to 2021/22). Copyright © 2023, re-used with permission. A data-sharing agreement with NHS England (DARS-NIC-226261-M2T0Q) governed access to and use of HES data for this project.
This work uses data provided by patients and collected by the NHS as part of their care and support. Read more about this here.
Suggested citation
Bagri S and Scobie S (2023) “How much planned care in England is delivered and funded privately?”, Nuffield Trust explainer