Qualitywatch
A Nuffield Trust and Health Foundation programme
NHS performance tracker
Our monthly-updated analysis of the NHS's performance against totemic access and waiting times targets.
Headlines
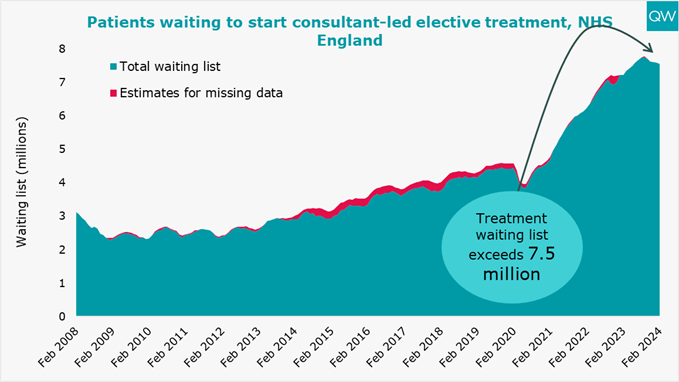
- The headline waiting list to start elective (planned) care technically fell in February 2024, but when we account for NHSE’s changes to what is included in the dataset the wait list remained static at 7.54 million.
- 21% of people waited over six weeks for a diagnostic test in February 2024, the best performance since the start of the pandemic, but still very far from targets.
- In March 2024, 26% of people attending A&E spent more than four hours from arrival to admission, transfer or discharge. Though an improvement on the previous year, the March objective of 24% was missed.
The analysis below includes the latest data on key activity and performance measures from February and March 2024, as published by NHS England on 11 April 2024. This includes data on the NHS's performance against some key targets, including some of those set out in the latest planning guidance, as well as other indicators of patient safety and care.
Planned hospital care and diagnostic test waiting times
- The waiting list to start elective (planned) care decreased from 7.58 million in January 2024 to 7.54 million in February. However, this decrease coincided with the removal of community service pathways from the RTT dataset. When we account for this, the waiting list has remained stable. This is the fifth month in a row the list has stayed the same or decreased, falling by 229,000 since September.
- 6.29 million people were waiting to start elective care in February 2024. This is lower than the overall waiting list of 7.54 million because some people are waiting for multiple treatments.
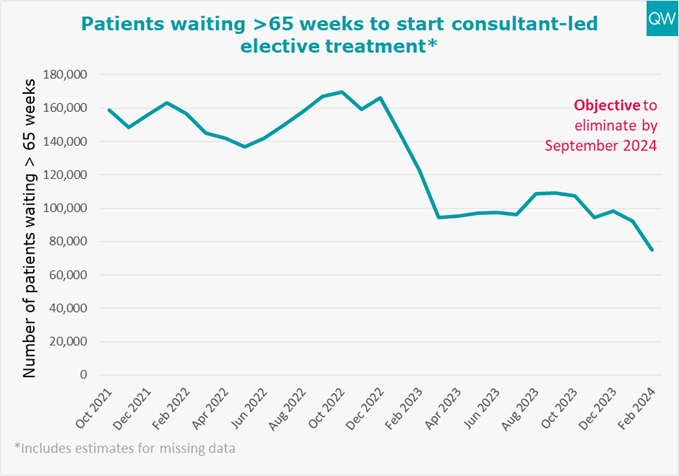
- There is a new objective to have no more people waiting over 65 weeks to start consultant-led elective treatment by September 2024 (except where patients choose to wait longer), replacing the objective for this to happen by March 2024. There were over 75,000 waits this long in February 2024, a decrease of over 17,000 on the previous month (approximately 2,500 of the drop was caused by the removal of community service pathways).
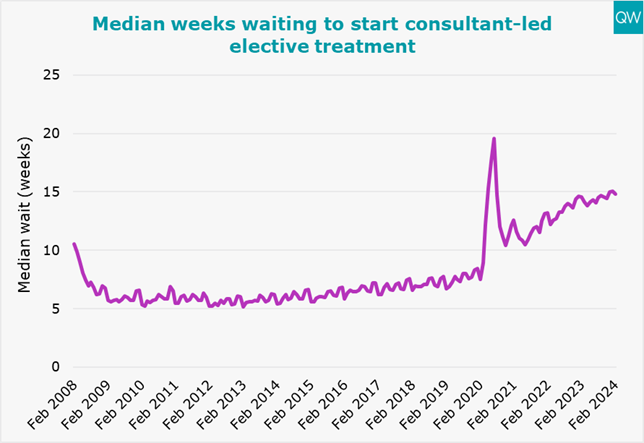
- The median time that patients had been on the waiting list was 14.8 weeks in February 2024. This is slightly lower than the previous month. Before the pandemic, in February 2020, the median wait was only 7.5 weeks.
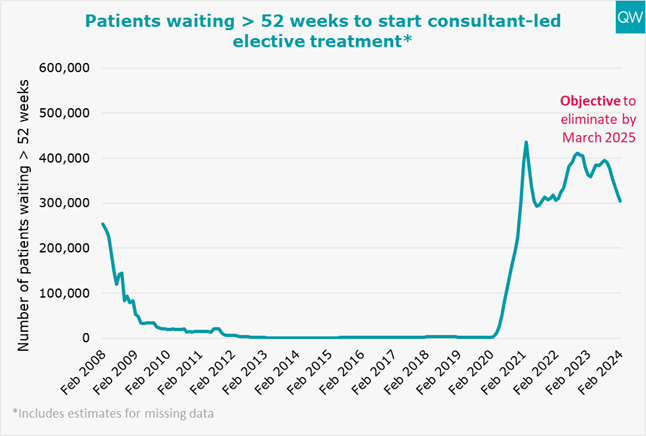
- The number of waits of over 52 weeks to start elective care stood at over 305,000 in February 2024 – a decrease of over 57,000 over the past year (approximately 4,400 of which was caused by the removal of community service pathways). In February 2020, there were only 1,845 waits of over 52 weeks. The aim is to have nobody having to wait this long by March 2025.
- 21% of people waited over six weeks for a diagnostic test in February 2024. This is the best performance seen since the start of the pandemic, but is far beyond the 1% target, as well as the objective of 5% by March 2025.
For more information, see our treatment waiting times and diagnostic test waiting times indicators. For information on the recategorisation of community service pathways, see the NHS statistical press notice.

Cancer waiting times
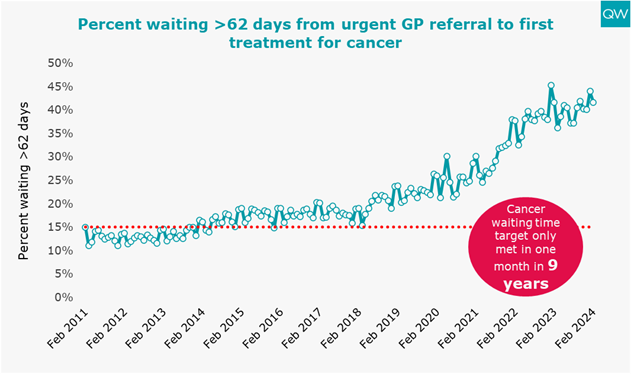
- In February 2024, 42% of patients who had their first treatment for cancer following an urgent GP referral waited longer than two months. This is an improvement on the previous month, but performance has been worsening over the longer term. It is also far away from the target of only 15% of patients waiting this long.
- The number of patients who waited longer than two months from an urgent GP referral to a first treatment for cancer was 6,479 in February 2024. When the 15% threshold target was last met in December 2015, only 1,704 patients waited more than two months for their first cancer treatment.
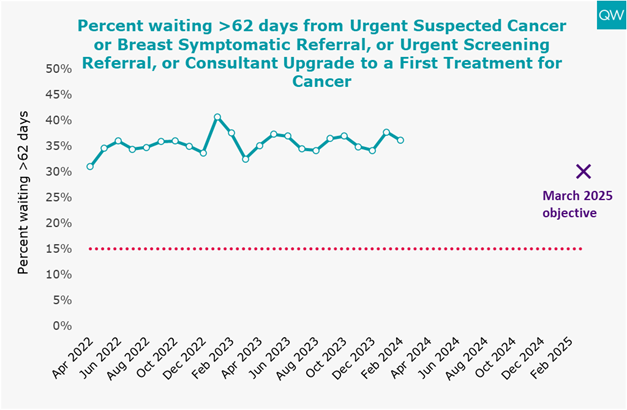
- In December, NHS England began publishing new cancer waiting time standards. For the new standard concerning two-month waits from an urgent suspected cancer referral, or breast symptomatic referral, or urgent screening referral, or consultant upgrade to a first treatment for cancer, 36% waited longer than the target time to begin treatment in February 2024. A new objective of reducing this proportion to 30% by March 2025 has been announced. The 15% standard has not come close to being met during the period for which records are available.
For more information, see our cancer waiting time targets indicator. Data for the first cancer chart from April 2023 onwards has been derived from NHS England’s commissioner-based cancer waiting times data extract. This is due to changes in the cancer waiting times standards which have led to changes in the published national-level data.
Emergency care
A&E
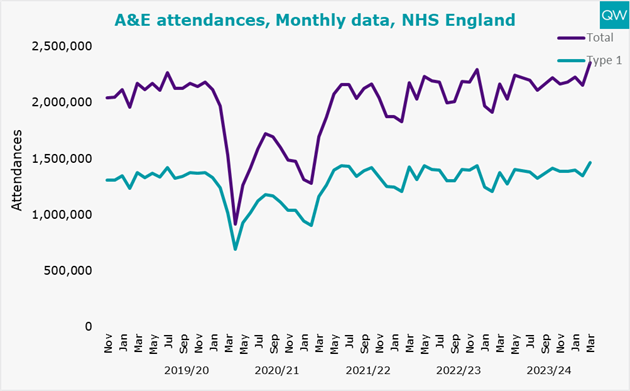
- In March 2024, there was a record high of 2.35 million total attendances to A&E departments. This represents a 9% increase compared to the previous March, and also a 9% increase compared to before the pandemic in March 2019.
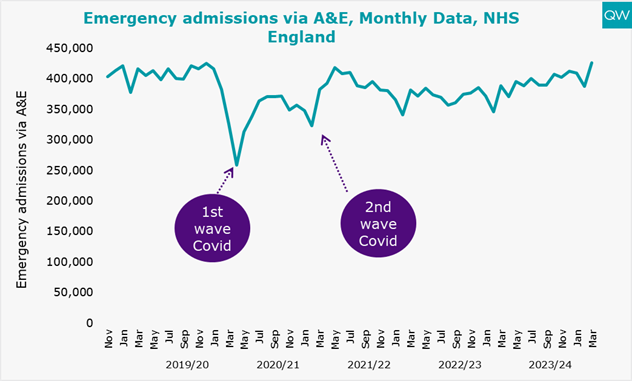
- There was also a record high number of emergency admissions via A&E, reaching 426,000 in March 2024. This is 10% higher than in March 2023 and 2% higher than pre-pandemic levels in March 2019.
- 26% of people attending A&E spent more than four hours from arrival to admission, transfer or discharge in March 2024. This is 3 percentage points better than March last year, but 12 percentage points worse than before the pandemic in March 2019.
- Performance against the four-hour target missed the March 2024 objective of 24% or fewer being seen outside the target time. The long-standing 5% standard is still far from reach.
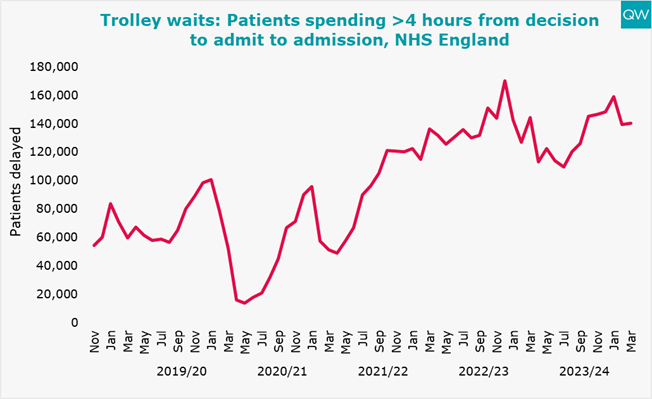
- Trolley waits (the time between a decision to admit a patient and them being admitted) of over four hours increased slightly to 140,000 in March. This is 3% lower than in March last year but much higher than it was pre-pandemic in March 2019 when there were about 60,000 instances of waits this long.
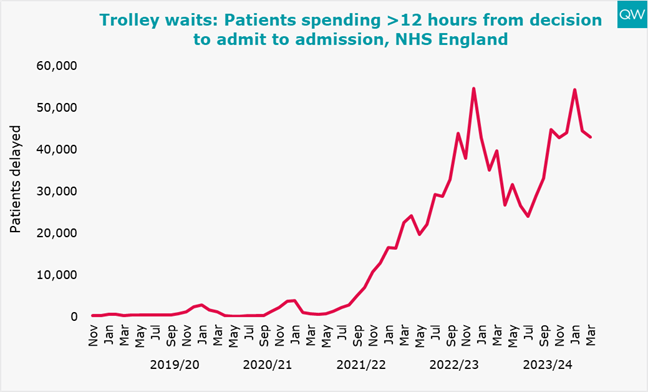
- Trolley waits of over 12 hours decreased slightly to 42,968 in March 2024. However, they were 8% higher than in March last year and significantly higher than before the pandemic.
For more information, see our A&E waiting times indicator.

Ambulances
- In March 2024, there was an average response time of 8 minutes 20 seconds to Category 1 incidents (life-threatening conditions, such as cardiac or respiratory arrest), missing the seven-minute target. One in 10 people waited over 14 minutes 48 seconds, which means the 15-minute target was met.
- Response times to Category 2 incidents (emergency conditions such as stroke or heart attack) improved by two and a half minutes in March, with an average response time of 33 minutes 50 seconds. This is still far from the mean target of 18 minutes.
Note that Category 1 response times for the London Ambulance Service from 19 August 2020 to 22 September 2022 were under-reported, so the actual mean response time during that period was an average of 54 seconds longer than shown.
For more information, see our ambulance response times indicator.


About this data
QualityWatch provides independent scrutiny of the health and social care system. The most recent data published today reflects changes in access and waiting times in the aftermath of the pandemic.
Between May 2019 and May 2023, in response to proposals made in the Clinically-Led Review of NHS Access Standards Interim Report, 14 hospital trusts acted as field testing sites for alternatives to the existing four-hour A&E standard. During this period, these trusts did not report performance on the four-hour standard and are hence absent from the data for May 2019 to May 2023. Reporting on the findings of the Clinical Review of Standards for Urgent and Emergency Care is now available.
For interactive charts showing the quality of health and social care over time, please refer to our 200+ indicators.