
It’s less than a week to the long awaited Spending Review. Across the public services the consolidation plans are unprecedented, culminating in a tightening of £83 billion in 2014-15. Health, along with overseas development, is in a protected position with the Government promising a real terms increase in funding between 2011-12 and 2014-15.
On Wednesday we will know what level that real terms increase will be but it is clear that the headline level will be substantially below the growth of the last decade, when health spending doubled in real terms. It is also likely to be below the average under the previous conservative administration of 3.2 per cent per annum.
Navigating around the ins and outs of health spending data is seriously complex. The Treasury is currently part way through a programme called the Alignment Project which – although it will make comparisons easier in the future – has lead to some major changes in the definitions of key spending totals such as Resource Departmental Expenditure Limits (DEL) and total Health DEL.1
In the 2010 Budget the Treasury set out estimates of the effect of this programme on the DEL spending totals. For health, this reduces the Resource DEL total for 2010-11 by £2.6 billion, although it makes no difference to the spending power of the Department of Health (there is a corresponding increase in the health Annually Managed Expenditure estimate - AME). This means we need to be wary of simple comparisons of plans and out-turn figures from previous periods.
There are three things to watch out for when looking at the figures the Treasury will announce on the 20 October:
What has the Treasury decided to do about the cumulative under-spends in the health budget?
The health budget was under-spent by £1.5 billion in 2008-09 and £1.4 billion in 2009-10. Across the public sector the scope to carry over money from previous years (end year flexibility - EYF) has been sharply curtailed. Will the cumulate under-spend from the last few years be lost to the NHS?
The resource and capital split?
Treasury rules set separate resource and capital budgets for Government departments. In general money can be moved from the resource budget to bolster capital spending. But departments cannot shift money allocated to them for capital investment to the resource budget.
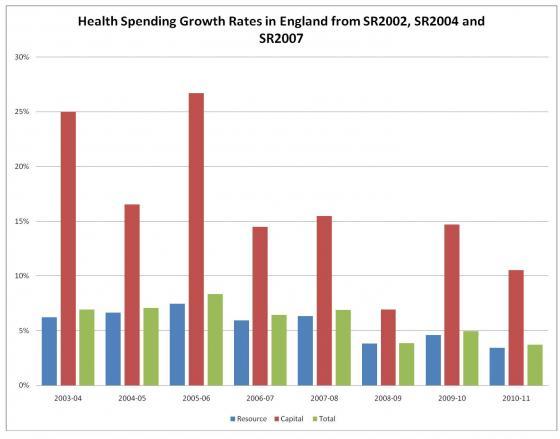
The table below shows the split between resource and capital for health spending in England over the last three Spending Reviews in 2002, 2004 and 2007. This shows that the resource envelope increased by one per cent per year less that the total increase in the health budget. If that pattern continued in next week’s Spending Review the headline total for health might mask a greater challenge on resource. Resource DEL is the key figure for the next four years as it’s this budget that pays for staff, pharmaceuticals and the goods and services essential for patient care.
Real on what terms?
The Government’s commitment to increase health spending is a commitment to increase spending in real terms i.e. after inflation. In one sense this is very straight-forward. However, there is much devil in the detail here. There are three principal measures of inflation. The Retail Price Index (RPI) is perhaps the best known, but over the last few years it is being used less and less in government. The Bank of England’s inflation target is now judged against a measure called CPI (the Consumer Price Index) and the Government has announced that pensions and benefits are to be up-rated in line with CPI rather than RPI.
For the Spending Review the Government will use neither of these measures of inflation to judge the real terms increases. For public spending the Government uses a measure called the GDP deflator. This is the traditional measure used in Government as it covers a wider range of activity (not just consumer prices).
Why does this matter? It matters because the different measures produce very different estimates of inflation. The table below shows the projections from the newly created Office of Budget Responsibility (OBR) for the Spending Review period. This shows that RPI is forecast to remain significantly above both CPI and the GDP deflator throughout.
OBR Pre-Budget Inflation Forecast March 2010
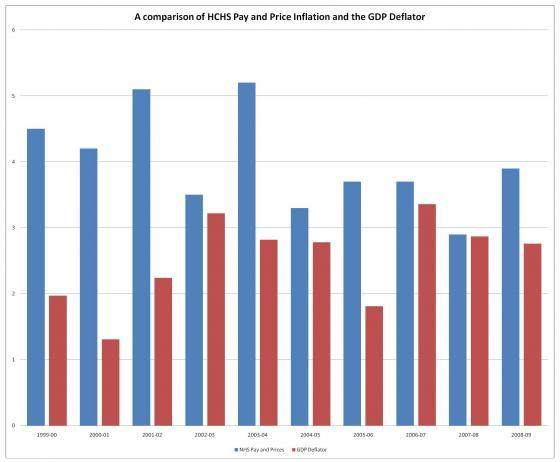
The most important question for health spending is how all this compares to the actual inflationary pressures in the NHS. For this there is no forward projection. But, if history is any guide to the future, there is a real risk that inflation in the NHS will exceed the GDP deflator. Over the last 10 years health inflation measured by the Health Services Pay and Price index has been an average of 1.5 per cent a year above the GDP deflator.
The chart below compares the Hospital and Community Health Services (HCHS) pay and price index and GDP deflator for this period.
If HCHS pay and prices continue to run ahead of general inflation at this rate a real terms increase in health spending of one per cent per annum would translate into a 0.5 per cent cut in the volume of health care services the NHS could deliver, other things being equal.
1 Total Government Spending is made up of three key elements: Department’s fixed resource budgets (Resource DEL), Department’s fixed capital Budget’s (Capital DEL) and Annually Managed Expenditure (AME) – the Spending Review will fix three figures for Health (total DEL, resource DEL and capital DEL). DH also has some AME expenditure which will be forecast but not fixed.
Suggested citation
Charlesworth A (2010) ‘Understanding the Treasury’s figures for health’. Nuffield Trust comment, 15 October 2010. https://www.nuffieldtrust.org.uk/news-item/understanding-the-treasury-s-figures-for-health