
There seems to be some confusion about what has been happening to NHS productivity over the last few years. This confusion appears to stem from three primary sources.
First, the ‘productivity’ label can be applied quite liberally. But productivity has a narrow definition: it is simply the ratio of outputs to inputs in production.
So, productivity is not the same as ‘value for money’ – this requires some means of attaching social or consumer value to what is produced. While productivity counts the number of people treated in hospital, a value for money assessment might ask if they need to be treated there.
Nor is productivity equivalent to health system ‘performance’, which could encompass a broad array of measures.
Second, the productivity story told by the Office for National Statistics (ONS) has changed over time, partly because productivity growth varies from year-to-year and partly because their initial figures were based on part year estimates.
The most recent ONS estimates show positive rather than negative NHS productivity growth.
Third, while the media has been quick to publish pieces when the ONS has reported declining NHS productivity, the ONS’ corrected figures received virtually no attention, with the exception of a mention in The Financial Times six months after their release.
Putting the picture straight
In 2006, the University of York’s Centre for Health Economics (CHE) and the National Institute for Economic and Social Research suggested improved methods for measuring productivity.
Prior to the mid-1990s, NHS ‘output’ was a simple count of the number of patients treated in 12 different settings. We made two fundamental improvements:
- The measure of NHS output is comprehensive, capturing as far as possible all the activities undertaken for all NHS patients. Rather than just 12, there are now more than 13,000 different categories to describe the care provided to patients.
- Output is not simply a count of activity, but also captures the quality of health care, measured by indicators such as survival rates, waiting times and disease management.
The Department of Health and ONS accepted the methodological recommendations that we made. But even so, the figures that we produce at CHE differ from those reported by the ONS in the following respects:
- We cover England only; the ONS cover the UK.
- We report figures by completed financial year. The requirement that ONS reports by calendar year has sometimes forced them to project forward for up to three quarters. These projections are often subsequently corrected when the actual data become available.
- Our figures ensure comprehensive coverage, even if there is whole scale re-categorisation in how output or input data are described. The ONS drop most of the outputs or inputs subject to re-categorisation, thereby providing an incomplete representation of NHS productivity.
- We use more accurate and detailed data to describe changes in the number and composition of the NHS workforce and in capital utilisation.
- The ONS uses the data we construct to measure changes in the quality of health care but also includes patient experience among its quality measures.
Our analyses show that, contrary to popular opinion, NHS productivity growth over time has not been negative.
While year-on-year growth rates are sometimes positive and sometimes negative, looking over a succession of years reveals that output growth and input growth track each closely. Indeed, between 2004/5 and 2010/11, output growth outstripped input growth, with NHS productivity increasing by 8 per cent.
In our most recent report we include a direct comparison of our CHE figures with those produced by ONS. Despite some methodological differences, the newly revised ONS figures are now closer to ours, as Figure 1 demonstrates.
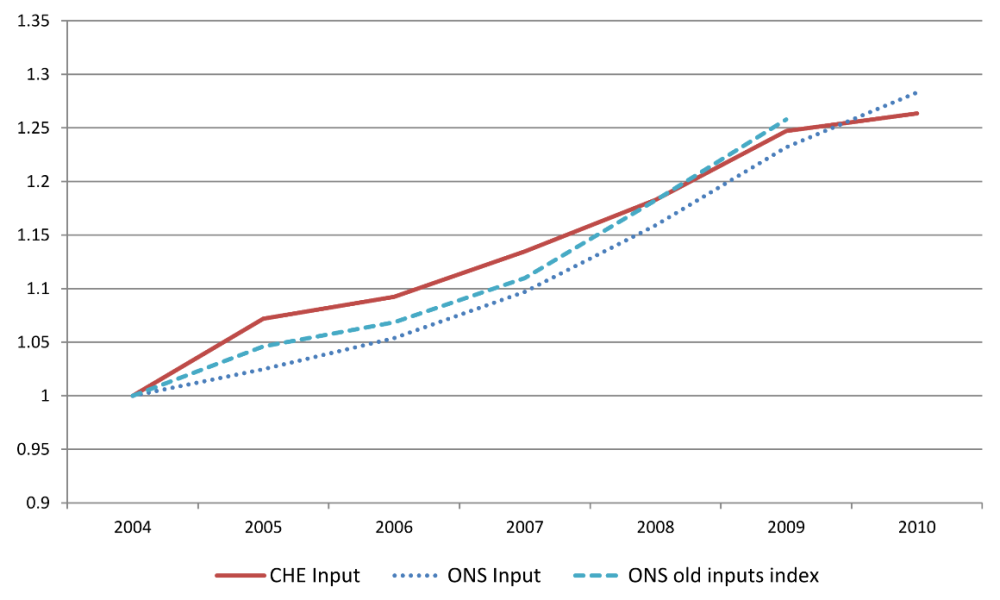
Figure 1. Productivity growth.
The main reason why our series diverged in the past was due to the construction of the output series. As Figure 2 shows, the CHE and ONS output series are now virtually identical.
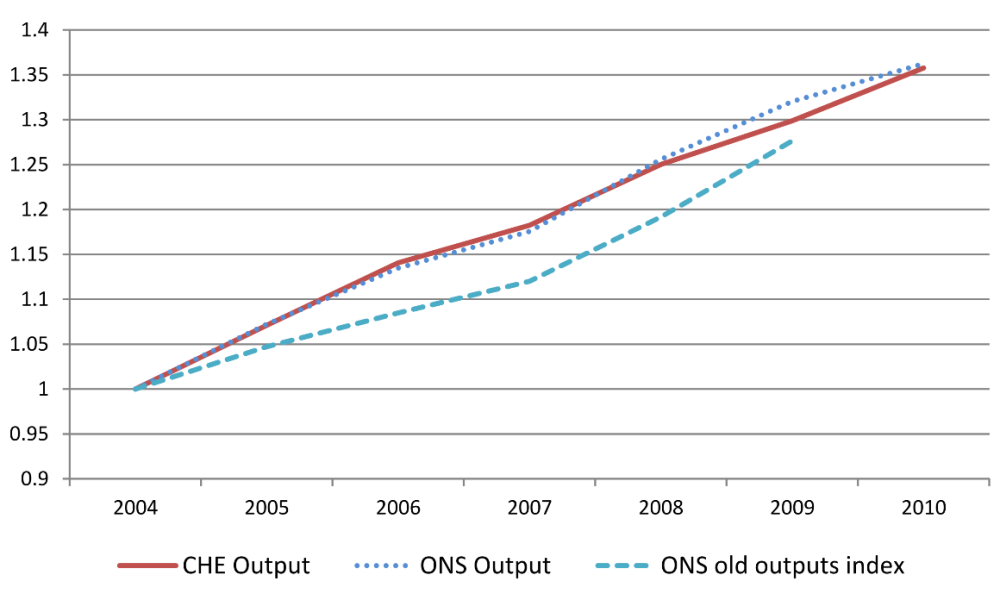
Figure 2: Output growth.
However, there remain differences between CHE and ONS in our estimates of input growth, as shown in Figure 3. These remaining differences account for the discrepancies in the CHE and ONS measures of productivity growth.
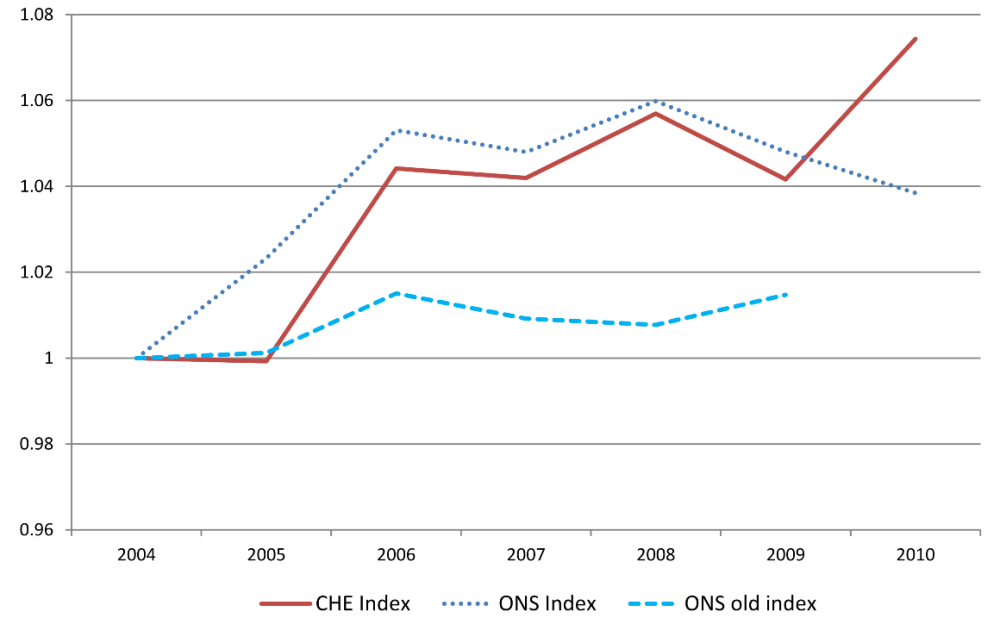
Figure 3: Input growth.
No grounds for complacency
Even with productivity growth positive over time, there are no grounds for complacency. Our related research and that by the Nuffield Trust suggest wide variations in productivity across the NHS.
For example, if all parts of the country were as productive as the South West, the NHS could cut expenditure by £3.2billion without reducing the number of patients treated. And there are substantial differences in length of stay for people admitted to hospital with the same problems.
It is essential that future efforts to improve productivity are directed at reducing these variations.
Professor Andrew Street is Professor of Health Economics and Director of the Health Policy team in the Centre for Health Economics. Please note that the views expressed in guest blogs on the Nuffield Trust website are the authors’ own.
Suggested citation
Street S (2013) ‘What has been happening to NHS productivity?’. Nuffield Trust comment, 23 October 2013. https://www.nuffieldtrust.org.uk/news-item/what-has-been-happening-to-nhs-productivity