This is a simple guide to implementing the PARR-30 model detailed in the article: 'Development of a predictive model to identify inpatients at risk of re-admission within 30 days of discharge (PARR-30)' by Billings and others, published in BMJ Open in August 2012.
What data will you need?
The PARR-30 model uses just 17 pieces of information to calculate the risk of a patient being readmitted within 30 days of discharge.
These fall into three basic categories:
-
General information about the patient:
- The NHS organisation code of the hospital in which they are being treated;
- Their age;
- Their postcode (which is used to assign a deprivation level to the patient).
-
Information about the patient’s history of emergency admissions:
- Number of (non-obstetics and gynaecology) emergency admissions the patient had in the last year;
- Whether or not the patient had any (non-obstetics and gynaecology) emergency admissions in the last 30 days;
- Is the current admission an emergency admission?
-
Information about the patient medical history:
Does the patient have a history of each of the following conditions (yes/no)?- Congestive heart failure
- Peripheral vascular disease
- Dementia
- Chronic pulmonary disease
- Other liver disease
- Other malignant cancer
- Metastatic cancer with solid tumour
- Moderate/severe liver disease
- Diabetes with chronic complications
- Hemiplegia or paraplegia
- Renal disease
To create the model, this information is drawn from the patient’s last two years of hospital diagnoses, not including the current admission unless those diagnoses happen to be available.
How do you turn that into a risk of readmission?
The next step for each of the 14 items of information from sections 2 and 3 is to multiply them by a model coefficient. The questions that have yes/no answers are applied as yes = 1 and no =0. Coefficients for all items in the model are published in the appendix to our BMJ Open paper.
The three items of general information about the patient (section 1) are handled a little differently and need a bit of processing first:
- The NHS organisation code is used to look up a coefficient for that trust (each organisation has a different one).
- The patient’s age needs to be squared before it is fed into the model and multiplied by its coefficient.
- Lastly, the patient’s postcode is used to look up the deprivation level of their local area.This is done by mapping from the patient’s postcode to lower super output area (LSOA), then looking up that LSOA’s deprivation score in the 2007 Index of Multiple Deprivation (IMD).
The PARR-30 model uses six bands of deprivation, and the band in which the LSOA deprivation falls will point to the deprivation coefficient to be used. Of course, if the patient’s LSOA is already known there is no need to gather the postcode. The Office for National Statistics has a search tool that can help.
When all the information has been multiplied by the respective coefficients, the results are summed and a constant term added. This final result can be converted to a percentage using:
exp(risk_score)/(1+exp(risk_score))
Worked example
A fictional 83-year-old woman from a relatively deprived part of London is about to be discharged from a large teaching hospital in London. Her home post code is E1 5AA. She received an emergency admission linked to her chronic obstructive pulmonary disease 7 days ago.
Though she has not been in hospital within the last month, she did have two discharges following emergency admissions in the previous year. The patient also has a history of congestive heart failure and peripheral vascular disease.
Two things have to be looked up: the NHS code for Barts and The London NHS Trust is ‘RNJ’, and the associated coefficient is 0.1171. The patient’s LSOA is Tower Hamlets 013C, and the 2007 IMD score was 34.84. This places it in our 25 to 40 deprivation band, for which the coefficient is 0.023915.
The patient’s risk score is then:
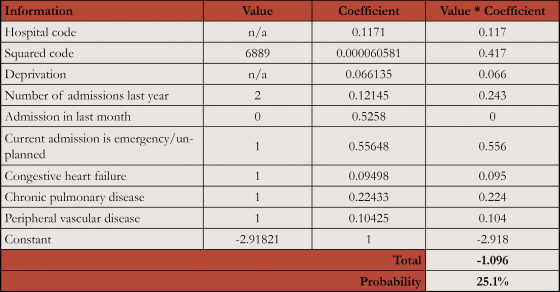
What about confidence intervals and costs?
Confidence intervals and estimated costs of readmission are applied from look-up tables based on risk score. These can be found in table two of the paper published in BMJ Open.