
Around 300,000 people in England and Wales over the age of 65 are currently resident in care homes. However, despite the growing need for social care, there is very little information that homes can use to monitor the quality of care they provide, or judge how good their outcomes are in comparison to similar homes both within the local area and across the country. A recent article in Age and Ageing explores one approach that might be applied.
What data exists?
Some care home providers already collect data on their residents, and all have to report notifications of serious harm, abuse and deaths to the Care Quality Commission (CQC). There have been previous initiatives to collect comprehensive data at a local level, but these have not led to national data collections. Other useful measures can be derived from hospital data such as emergency admissions to hospital from individual care homes, particularly for conditions which may reflect poor or insufficient care in the home, such as dehydration or diabetes. Though it is not perfect as a measure, there may be some sense in identifying whether particular care homes are better at preventing the sort of crises in care that lead to emergency admissions. There is certainly evidence that social care does reduce hospital use.
How can this data be used effectively?
For individual care home residents, the chances of an adverse event occurring will depend on their underlying risk (for example, their degree of frailty or long-term illnesses). However, tools for using this information to predict risk are not widely available, so methods are likely to have to rely on counting crude numbers. It would be feasible for care homes to adapt approaches that are already being used by NHS hospitals. For example, monthly numbers of events could be inserted into a simple spreadsheet which then performs the necessary calculations in order to signal whether numbers appear to be increasing at a concerning rate or, conversely, if changes to their care processes are resulting in improved outcomes. Outcomes could be compared against a peer group of similar homes caring for a similar mix of residents, or against a home’s own history.
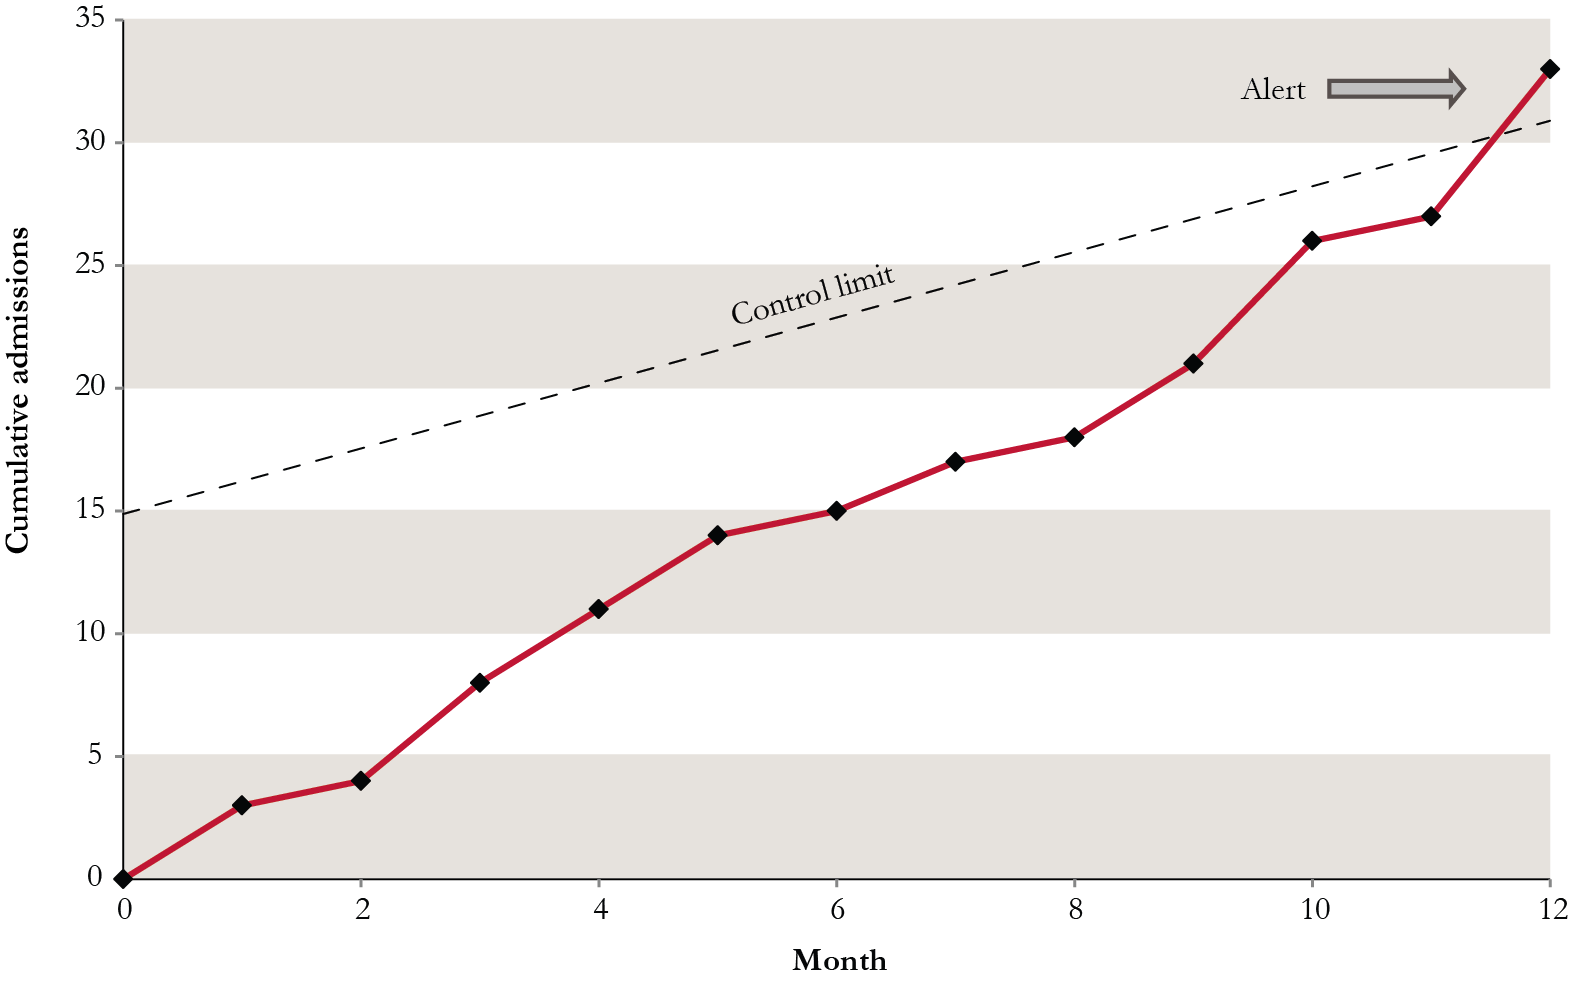
An example is shown in the figure below. This is a graph of the emergency admissions to hospital from a 40-bed care home, accumulating each month over a period of one year. The control limit is a threshold that is used to determine whether numbers of admissions are unusually high for the type of home, and in this case an alert signals in month 12. In other words, 30 admissions over the course of a year is a potential cause of concern and should prompt the care home to investigate further to determine how much these were related to quality of care.
Cumulative emergency admissions to hospital from one care home
Implementation
The methods for generating the control limits can be complex, but the formulae can be provided within a simple spreadsheet that could be available for individual homes or local authorities to use. These are not perfect methods for identifying good or poor quality care, but can provide information that acts as a starting point for a more in-depth investigation of the care they provide.
It is perhaps better to have some guidance about potential quality issues rather than no guidance at all.