
The QualityWatch programme, a joint piece of independent work from the Nuffield Trust and the Health Foundation, was launched at its inaugural conference in an intimate room at the Royal Institute of Physics in central London earlier this month.
There was a good reception to the programme and the presentations by the audience, which was made up of about 100 delegates with a wide range of interest in health and social care including those from NHS providers, health care commissioning bodies, local authorities, commissioning support units, royal colleges, regulators, research organisations, and patient associations.
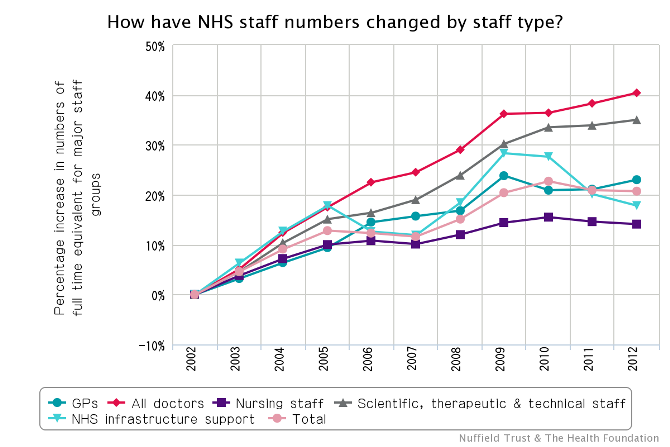
As you’d expect though, in this very topical area there were moments of discussion and debate, and one particular moment came during Dr Martin Bardsley’s talk: ‘Time for QualityWatch?’, in which he presented the chart below as an example of how total numbers of different NHS staff groups have changed over the past decade.
View an interactive version of this chart.
Some questioned the data on nurses and asked whether it was misleading. It showed that nursing levels have remained largely stable since 2009, at around 14.0-15.5% more than there were in 2002, when actually they argued that if you just look at the recent data nursing staff numbers have actually fallen slightly.
Both views are different perspectives on the same indicator.
The graph does show what’s happened at a national level in the context of 10 years from 2002 according to official figures. However, in this form, it doesn’t show potentially useful nuances – such as what’s happening in different areas of the country, in different sectors such as GP practices, secondary care or mental health services, and it doesn’t compare this against activity measures over the same period.
The QualityWatch research team understand these kinds of limitations and what can be inferred about quality with single or simple sets of indicators and the programme aims to do more than just show single isolated charts or simple dashboards.
The aim of our set of indicators, is to put information into context as much as possible by looking further into the data than the national picture, trying to unpick different views, intertwine related information and add commentary to the numbers to tell the fullest story possible.
Analysis like this, however, does come with its challenges:
- Quality of care is a difficult thing to assess. It is complex to define, and hard to measure or assess in ways that are rigorous and consistent. This was a common theme, albeit from different starting points, from speakers during the session: ‘Key quality issues for the next decade’.
- What we are able to show will be dependent on what information is available. It is well recognised that in England, despite improvements, we haven’t got it quite right yet in what information is collected, and how it is made widely available – if it is at all. These were some of the themes that arose during the conferences ‘Improving information for quality’ session.
- The information presented will only be a starting point and is not the end itself. One of the programme’s aims is to provide a resource to give an independent picture of the quality of care to help others identify priority areas for improvement. This was reflected in another of the QualityWatch conference’s sessions: ‘Acting on information’.
We are at the start of this programme and the information currently presented in the indicators on the QualityWatch website is just the beginning.
Like the data about nurses, we want to use the information to start the debate, we want to continue to engage with people on the programme's direction and findings, and we hope that it will support work to overcome these challenges.
So have a look at the website yourself to find out how to get involved and give us your feedback.