
The performance of health care services, and crucially health outcomes, continue to vary significantly across the country. This may be due to factors out of the health service’s control, such as patients living in very deprived circumstances or if their ethnic or cultural background means they interact with health care differently. More positively, variation may be desirable, such as care that differs from the standard approach and is instead tailored for a particular group of patients with very specific needs and preferences.
Sadly, however, much of the variation is not related to patient characteristics or their preferences, but instead to how health care providers decide to organise and deliver treatments – what Jack Wennberg termed “unwarranted variation”.
Measuring how health care for children and young people varies across the country has always been especially difficult, but fortunately there has been a recent breakthrough. Members of the Nuffield Trust research team last year published a method that calculates the catchment population of children and young people served by hospitals in England. It means that, for the first time, we can make a fair and meaningful comparison of each hospital’s care for children and young people, much like we can for adult services.
More on that shortly, but first let’s take a quick look at how measuring variation in health care for children and young people across the country has, until now, been hampered by how health services are organised.
Age-old problems?
Where people live (or more precisely, with which GP they are registered) determines who commissions their care, and the population each commissioning area serves gives a ready measurement unit for comparative analyses. This technique is the basis of how unwarranted variation has been explored in this country – most notably in the NHS Atlas of Variation in Healthcare series that I co-author – including for children and young people.
This approach has distinct benefits. Because the data presented is usually for a discrete population with a single responsible organisation such as a clinical commissioning group, that organisation is answerable for each outcome measure, and accountable for its improvement.
Now while we know about population factors that might affect outcomes (such as age distribution, socio-economic circumstances and ethnic background) – and can therefore adjust indicators to give reliable and fair comparisons for policy-makers, commissioners and clinicians alike – there are situations where we would like to measure and compare outcomes better attributed to a health care provider, such as a hospital.
Currently, we cannot adjust for population characteristics by hospital trust, as hospitals in England do not draw upon a sharply defined catchment area that can be described demographically. To try to compare hospitals without knowing the different characteristics of the catchment population from where patients are drawn would be both unfair and meaningless.
In the atlas of variation for children and young people, we explored how hospital admissions varied across England for bronchiolitis, a respiratory viral infection affecting children below two years of age. Infants are more likely to contract severe bronchiolitis if they live in a deprived area, but we wanted to know how much of the variation we uncovered was related not to those population factors, but rather for health care reasons – such as how the treating hospitals managed children differently in the emergency department.
Without being able to identify the specific area that a hospital serves, it is impossible to know whether higher admission rates in one hospital can be entirely explained by the fact they serve a more deprived population of children, or whether some responsibility rests on the hospital.
A new way forward?
Our published study last summer describes a technique to identify catchment areas for children and young people that unlocks the potential for meaningful comparisons at provider level. Catchment areas for adult populations exist, but the referral and treatment pathways for children and young people vary too much from those of adult patients to be used interchangeably.
We have therefore created hospital catchment populations specifically for children and young people by modelling the historical flow of emergency admissions from each local area, allowing the population each hospital serves to be identified and, crucially, their demographic characteristics to be estimated.
How to work out the catchment population of children and young people?
How do we measure the impact of a new hospital initiative on the local population, or how changes in secondary care services affect local pathways of care? To answer these questions, we must establish a link between the hospital and the local population. The population served by a hospital is often referred to as its catchment area, yet it is not always clear what that is.
Catchment area borders are not clear – it is not the case that in one street everyone will attend one hospital whereas in a neighbouring street they will attend another. Catchment areas for one specialty might also be different than for another. For example, a hospital might provide a relatively uncommon service that has a particularly wide catchment area. Moreover, patient preferences might be different, such as parents preferring their child to be treated at one hospital while older people with a heart condition prefer another.
There are a variety of approaches for estimating catchment populations, depending on the data available.
The method we describe in our paper works out the size and make-up of these populations by observing who attends each hospital. The same geographical area can be in the catchment area for more than one hospital, but what’s important is the proportion of that population (and their specific demographic make-up) who attend that particular hospital.
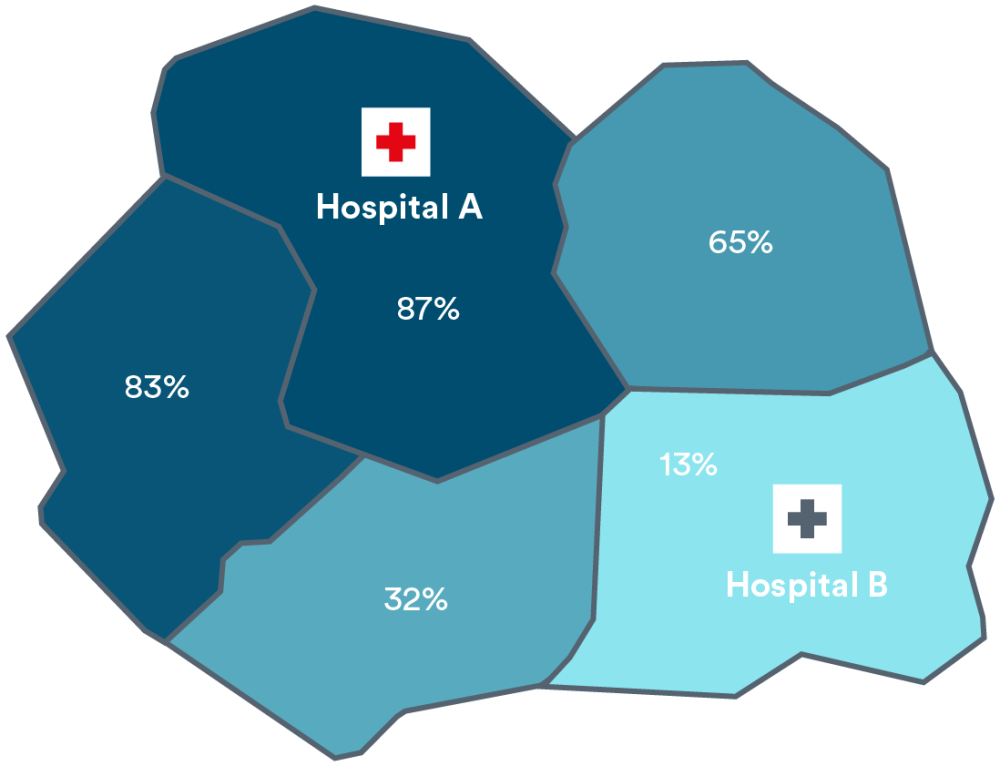
For example, when looking at the figure below, suppose we have two neighbouring hospitals called A and B and residents of five local districts either attend one or the other. Suppose also that 87% of children living in the district surrounding Hospital A are admitted to Hospital A, whereas 13% are admitted Hospital B, further away. In a neighbouring district to the east, these proportions are 65% to Hospital A and 35% to Hospital B.
We estimate that these proportions reflect the relative sizes of their respective catchment populations, so that the catchment population for Hospital A includes 87% of children resident in the surrounding district, and the catchment population for Hospital B includes the other 13% (and so on). For adults, these proportions may be different, resulting in a different geographical spread for each hospital’s adult catchment population.
In this way, we can build up total catchment populations for a hospital that has varying proportions of different types of individual from the surrounding districts.
Our calculations mirror the approach taken by Public Health England when calculating hospital catchment areas, but also use Hospital Episode Statistics (HES) data to adjust for the ways in which paediatric admissions differ from adult patterns.
Local populations of children within the catchment of two hospitals. Percentages represent the proportion in the catchment for each hospital.
Catchment for Hospital A:
Catchment for Hospital B: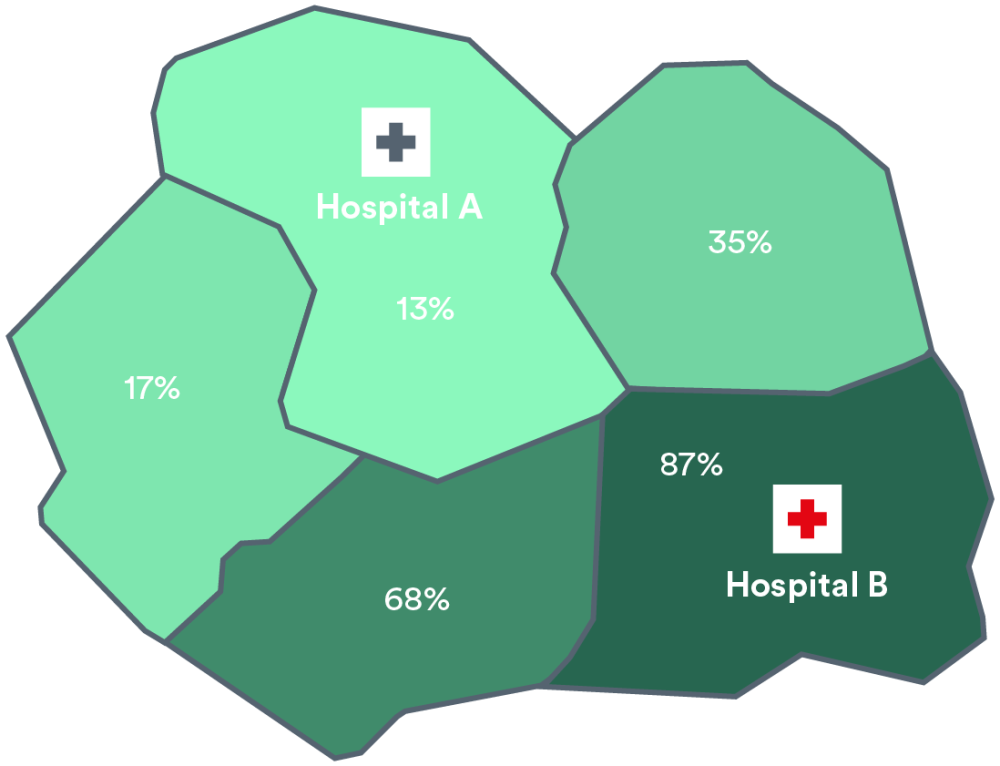
Chris Sherlaw-Johnson
Until now, I have found that commissioners tended to understand unequivocally that the responsibility for tackling a poor outcome for their population fell squarely on their shoulders – even if the solutions often seemed elusive. Clinical teams were often more cautious about population findings, suggesting that “our patients are different”, or “our patients are more deprived”. Without the tools to analyse the local population served by each hospital, it was not always possible to challenge them on this.
The publication of these catchment populations for children allows us to say with greater certainty than ever before that one hospital’s higher rates of admission for sepsis for example, or longer hospital stays for respiratory infection, are related to how they manage the condition and not because they serve a unique population.
This opens the door for policy-makers and providers to meaningfully and fairly compare hospital care for children and young people. Regulators and researchers, in particular, must take advantage of these tools to hold providers of children and young people’s health care to account, and pose the multi-million pound question: are your patients really that different?
Suggested citation
Cheung R (2019) "There’s no longer a catch: a new way to measure how children and young people are treated”, Nuffield Trust comment.