

Key points
- Monthly sickness absence rates over the last calendar year never once fell below even the peak in the pre-pandemic year and, on average, the reported rate for NHS staff across 2022 was 29% higher than in 2019 (5.6% v 4.3%).
- The reported level of sickness absence – some 27 million days across 2022 – equates, on average, to around 74,500 full-time equivalent staff, including 20,400 nurses and 2,900 doctors. This is likely to be a significant underestimate due to various causes of under-recording of the sickness absence rate.
- Over the course of 2022, some 6 million days were recorded for staff being sick due to mental health and wellbeing related reasons. The number of reported days of absences related to anxiety, stress, depression and other psychiatric illnesses increased by 26% between 2019 and 2022.
- High sickness absence is bad for NHS staff, bad for providers of health care in terms of costs and disruption to patient care, and expensive for the taxpayer. Sickness absence is also associated with a higher likelihood of staff leaving the NHS.
What are the levels of sickness absence in the NHS?
Over the course of the last calendar year, from January to December 2022, we saw an unprecedented and sustained high average level of sickness absence for the NHS in England. The reported sickness absence rate for NHS staff across 2022 (5.6%) was substantially higher than in the year before the pandemic (4.3% in 2019). In fact, the monthly sickness absence rate across 2022 never once fell below even the peak for 2019 (4.9% in December 2019).
The reported sickness absence rates in 2022 were equivalent to 74,500 additional full-time staff, including 2,900 doctors and 20,400 nurses. In reality, the scale of absences could be substantially greater as not all sickness absence days are thought to be recorded, particularly for some staff groups. The rise in reported sickness absence rates between 2019 and 2022 alone is equivalent to 16,900 full-time staff. Separate data suggest that there were 122,501 staff reported as absent from work through sickness or self-isolation at the peak across health care providers in 2022 (on 6 January during the Omicron wave).
Is this trend consistent across England?
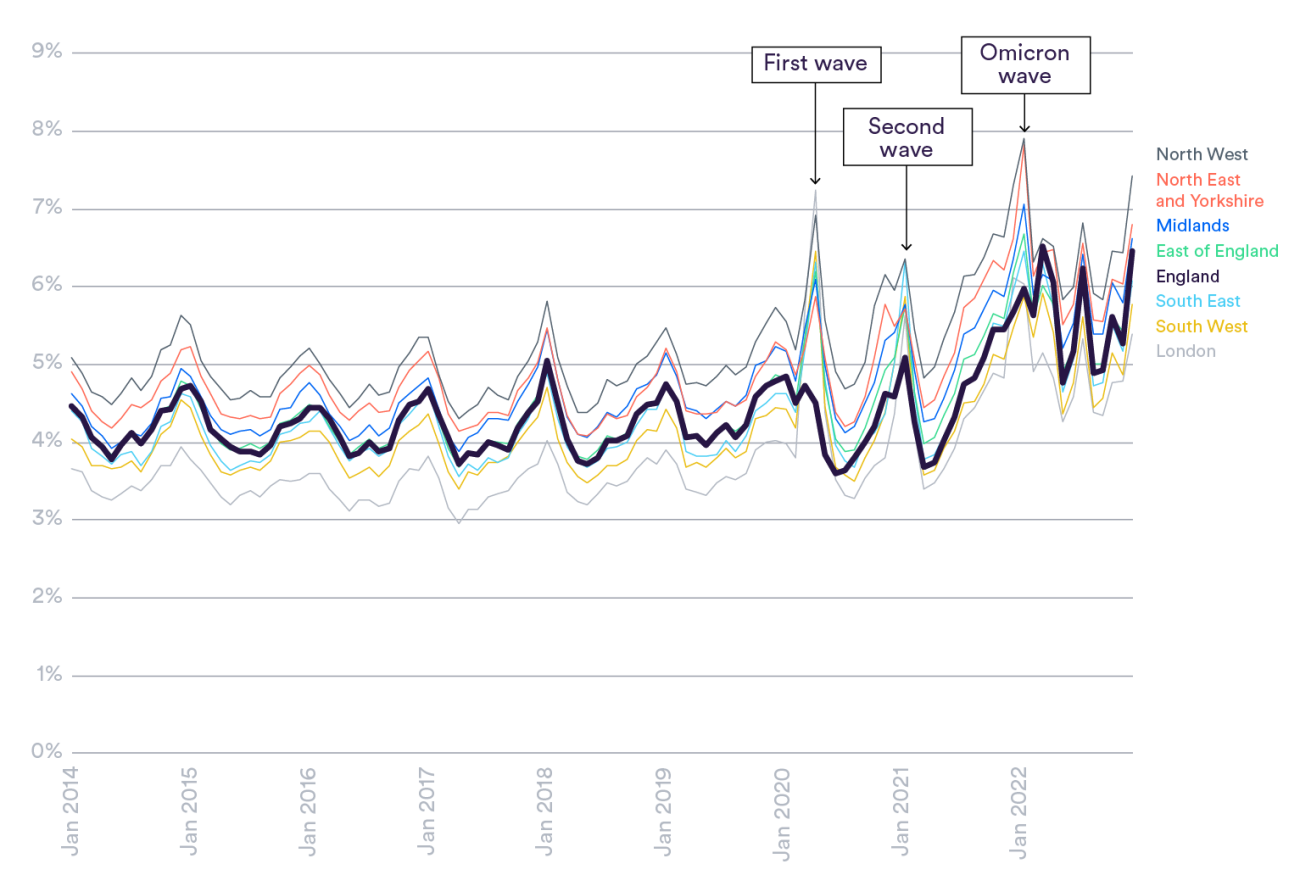
While the directions of the trends are fairly consistent across the English regions, the absolute reported sickness absence levels are substantially higher in some areas (Figure 1). By the end of 2022, the reported sickness absence rate stood at 7.4% in the North West compared to 5.4% in London.
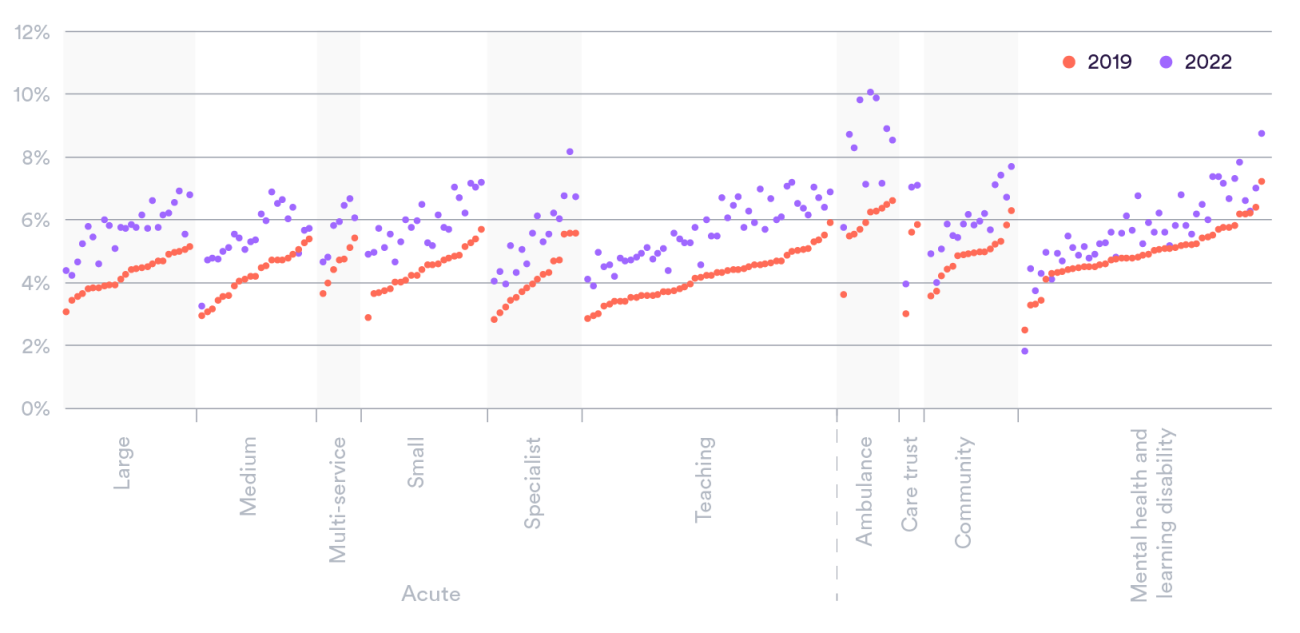
All types of NHS trust – from small to large and from acute to community – have, on average, seen a substantial increase. That said, reported levels across mental health and learning disabilities have been less affected overall. However, there is significant variation at a provider level. Sixteen trusts had their sickness absence rates increase by over half between 2019 and 2022, and three ambulance trusts saw their rates soar to 10% across 2022 (Figure 2).
The absolute level of absences is vast for some providers. For example, in the first week of 2022 – during the Omicron wave – 30 NHS trusts reported having, at some point, more than 1,000 staff absent on a given day from work through sickness or self-isolation (with six of these providers having more than 2,000 absent on at least one day over that week). Fast forward to the last week of 2022, and a sizeable number (11) of trusts were still reporting over 1,000 absences.
What are the reported reasons for sickness absences?
There has been a large rise in absences related to anxiety, stress, depression and other psychiatric illnesses which account for around a quarter (23%) of sick days (Figure 3). In fact, across 2022 there were around 6 million reported sick days for these mental health and wellbeing related reasons. The data available suggest that sickness absence days due to these reasons increased by around a quarter (26%) between 2019 and 2022, substantially outstripping the growth in staff numbers of that period (around 13%).
Across 2022, around one in six (18%) of sickness days were reported as specifically due to Covid-19. However, looking at the detailed reasons for sickness absence (which does not identify Covid-19 separately), it appears that Covid-19 and similar conditions (chest & respiratory; cold, cough or flu; infectious diseases) account for much of the increased levels compared to 2019 (27% in 2022 compared to 10% in 2019).
Figure 3: Reasons for sickness absences, average number of sick days per month 2019 and 2022
Chart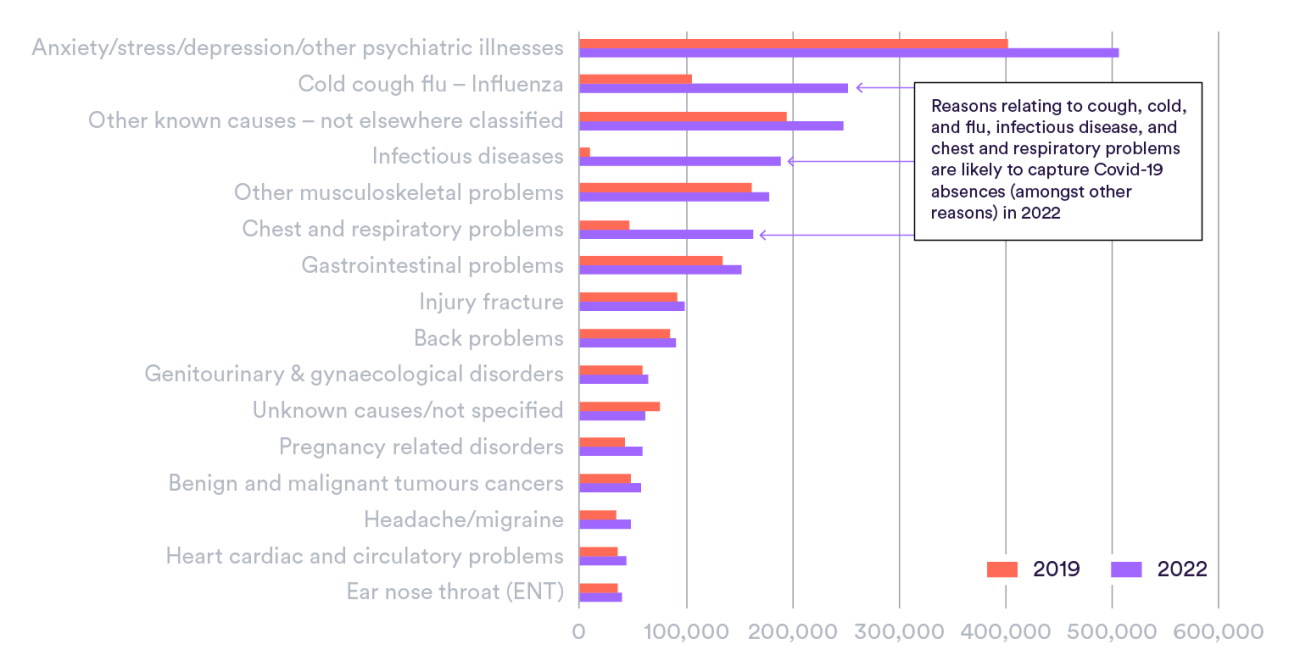
Have some staff groups been particularly affected?
Comparing sickness absence rates between staff groups can be problematic as, for example, some professions are less likely to actually record absences. In addition, the nature of the roles of different staff groups affects the degree to which staff can work with certain conditions – including the extent to which they are patient-facing or, for example, involve physical tasks – and the ability to work remotely or when self-isolating.
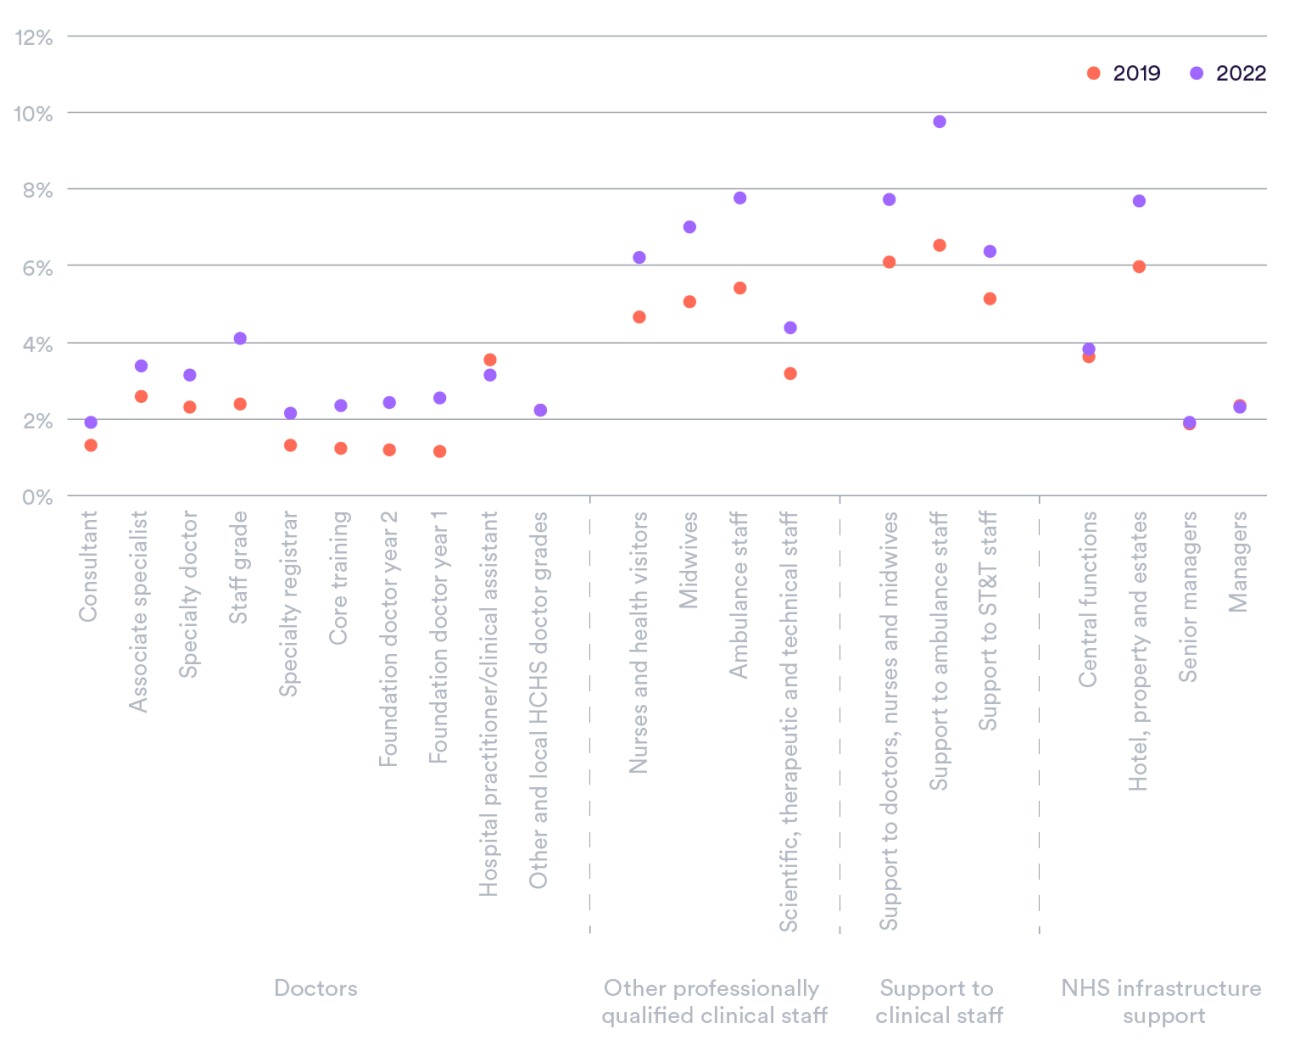
Compared to 2019, most staff groups saw a reported increase in sickness absence of broadly around 1 percentage point in 2022. However, some had no or low increase (managers, central functions, and for some categories of largely locally employed doctors) while other professions, including ambulance staff (2.3 percentage points), support to ambulance staff (3.2) and midwives (1.9), saw larger increases. The rates for foundation doctors (medics in their first two years after graduating) more than doubled, but this was from a comparatively low pre-pandemic level (Figure 4).
The reported reasons for absences vary by staff group. Prior to the pandemic in 2019, midwives for example were more likely to have reported sickness absence for mental health reasons (28% of all absences) than doctors (24%). Moreover, around twice the proportion of reported sickness days for ambulance staff and clinical support staff related to musculoskeletal conditions than for doctors (17% compared to 9%). And in the last three years, some groups have been disproportionately affected by certain reasons for sickness absence. For example, reasons for absence relating to influenza, chest and respiratory problems, and infectious disease (i.e. those that could relate to Covid-19) for ambulance staff alone rose from equivalent to a 0.3% sickness absence rate to 1.9% (for all staff the sickness absence rate for those reasons alone increased from 0.4% to 1.5%).
Is this increase unique to the NHS in England?
Differences between sectors and settings in the way sickness absence rates are defined and recorded makes such comparisons difficult. However, the increase in overall public sector sickness absence between 2019 and 2022 was similar to the NHS in England. That said, the sickness absence rates remain well above the public sector average (3.6% in 2022, albeit measured in a different way to that of the NHS) despite a target from the NHS Long Term Plan to get them down to those levels.
Increased levels of sickness absence in 2022 not only affected the health service in England, with surges too in the NHS in Wales and Scotland (the latter despite the data excluding Covid-19 absences, which in part explains the different apparent trend in that nation). While this analysis focuses on the NHS, the recent spike in sickness absence for teachers is also notable (Figure 5). Prior to the pandemic – between 2015 and 2019 – sickness absence rates had been fairly stable in the NHS in England and for teachers too, while reported rates had fallen on average across the public sector.
Figure 5: Changes to sickness absence rates across specified UK public sector groups, 2015 baseline
Chart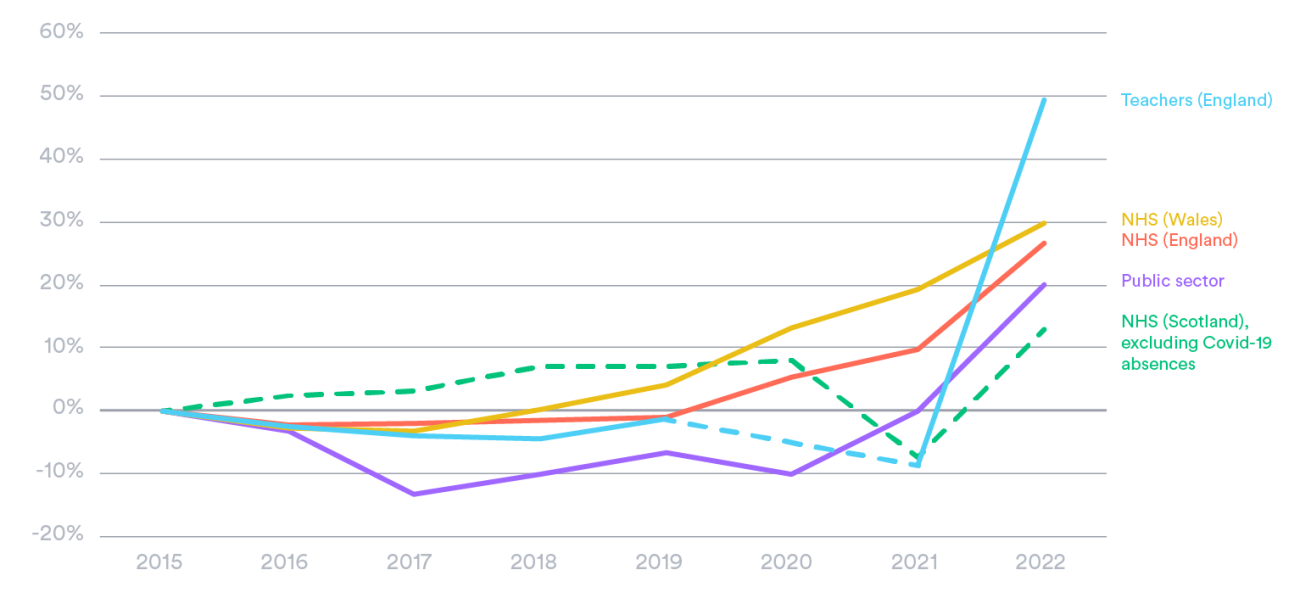
These increases coincide with more people leaving the labour market due to long-term sickness. Staff employed in “human health and social work” have – compared to some other sectors – relatively high retention issues due to long-term sickness (7.8 former workers economically inactive because of long-term sickness per 1,000 current staff, 2021/22) which, for example, was above the education sector (4.7 per 1,000) but below wholesale and retail services staff (10.4 per 1,000). Again, such comparisons need to be treated with some caution due to the nature of the roles in different sectors and, for example, the ability to work remotely including when self-isolating.
Discussion
Sickness absence levels tell us about the physical and psychological health and wellbeing of a workforce. And this analysis is not the first, by any means, to highlight health and wellbeing issues for the NHS workforce. The annual staff survey for NHS staff in England showed, for instance, a higher proportion of staff feeling unwell as a result of work-related stress in 2022 (45%) relative to three years prior (41%). Not only this, but over half (57%) of staff reported going into work despite not feeling well enough. While the proportion dipped in 2020 due to Covid-19 self-isolation requirements, this has gone back to levels seen in 2018.
Where staff sickness cannot be adequately covered by temporary staffing, then this could have a direct impact on those receiving care and – as the ability to clear the backlog would be hindered – those yet to receive care. It can also have indirect effects on other staff working in stretched services. Around a sixth (16%) of the total temporary (bank and agency) nurse and midwife use is to cover long-term sickness. While we do not know the exact cost of this, a sixth of the spend on agency nurses in 2020/21 equates to around £130 million.
Health reasons are also increasingly a cause for staff to leave the NHS. The number of NHS staff pointing to health as the reasons for leaving their role has more than tripled in the decade to 2022, including increasing by 52% since 2019. Of nurses, midwives and nursing associates leaving the professional register in 2022, physical and mental health is the second most commonly cited main reason and burnout or exhaustion the third, both behind retirement. Across these professionals leaving, of those that were educated in the UK, nearly one in three (31%) reported physical or mental health as a reason for leaving, with one in seven (14%) suggesting it as the main reason.
Sophisticated recent analysis highlighted a strong association between probability of leaving the NHS acute sector and sickness absences for both physical and (particularly) mental health reasons. For instance, compared to those that have not had absences, an NHS consultant missing three days of work for mental health reasons is 58% more likely to leave three months later. Given high sickness absence levels and poor retention are both causes of and caused by increased pressure of services, the NHS risks being stuck in a vicious cycle.
Sickness absence rates are known to relate to a huge array of factors. In particular, previous work has highlighted its relationship with season, infectious disease outbreaks, job satisfaction and employee engagement, workload over previous years, effort-reward imbalance, socioeconomic status, and gender. The solutions needed to solve the current high levels of sickness absence are, therefore, likely to be manyfold. However, there is an array of UK and international experience on interventions to address, for example, long-term sickness absence and reduce risks of recurrence.
In any case, the concern is that, despite emerging from the peaks of Covid-19, the levels of NHS sickness absence are still stubbornly higher than what was observed before the pandemic. But the NHS has a moral duty to protect the physical and mental health of its staff and, in doing so, can benefit the entire workforce and current and future patients. And, for this reason, understanding and ameliorating sickness absence levels are something that we hope will feature centrally in the highly anticipated NHS long-term workforce plan.
*We have calculated the NHS’s sickness absence rate by dividing the total sickness absence days (including non-working days) reported by the sum total days available per month for each member of staff (also including non-working days), while the BBC (for whom we carried out this analysis) have calculated annual sickness absence rates taken as an average of the monthly sickness absence rates in a given year.
Suggested citation
Palmer W and Rolewicz L (2023) All is not well: Sickness absence in the NHS in England. Briefing, Nuffield Trust.