
Headlines
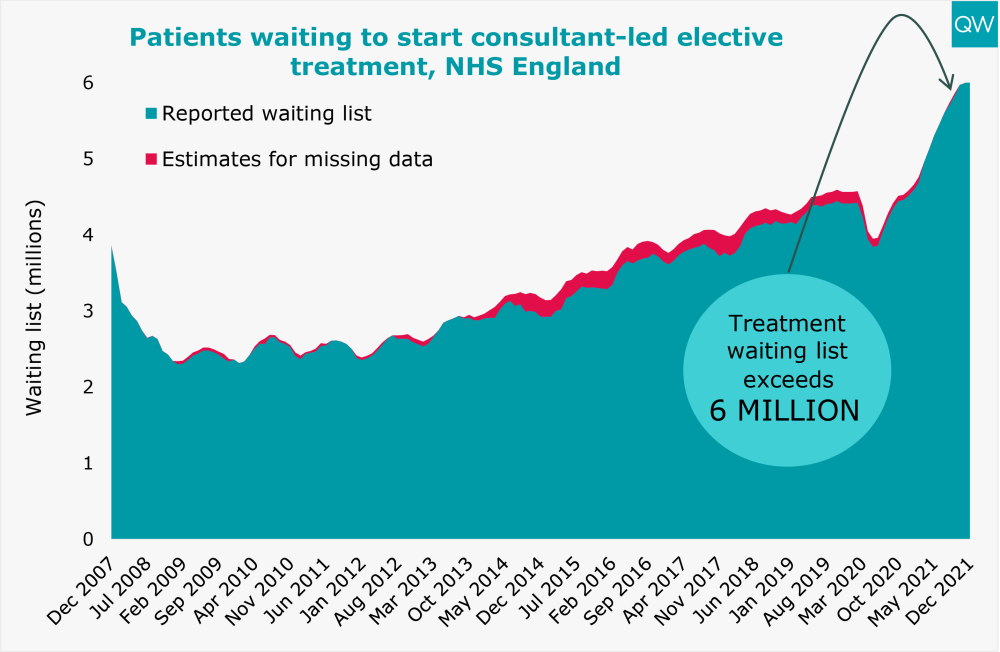
- The waiting list for elective treatment grew to 6.07 million in December 2021, reaching a new high.
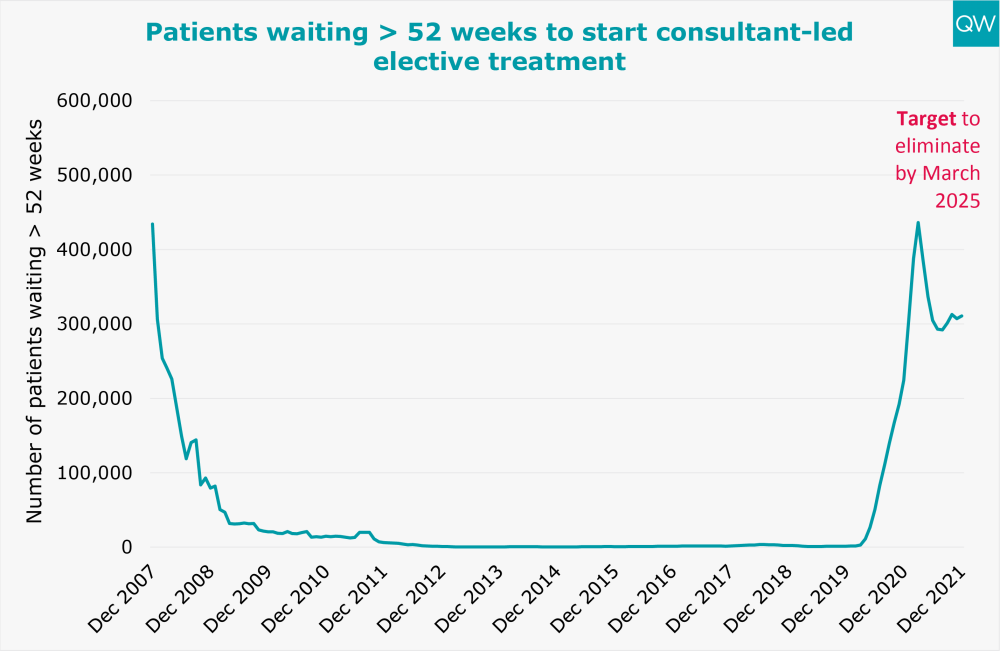
- As of December 2021, 310,813 people have been waiting over a year for planned hospital care – 200 times higher than pre-pandemic levels. 20,065 people have been waiting over two years.
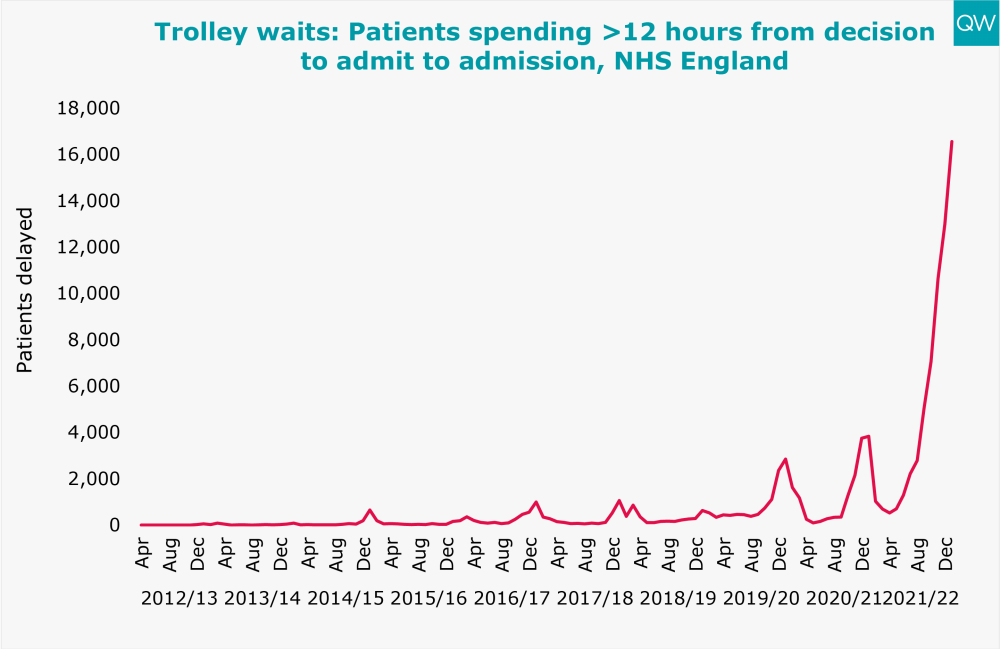
- Trolley waits are increasing: in January 2022, 16,558 patients waited over 12 hours from decision to admit to admission – a 28% increase from the previous month.
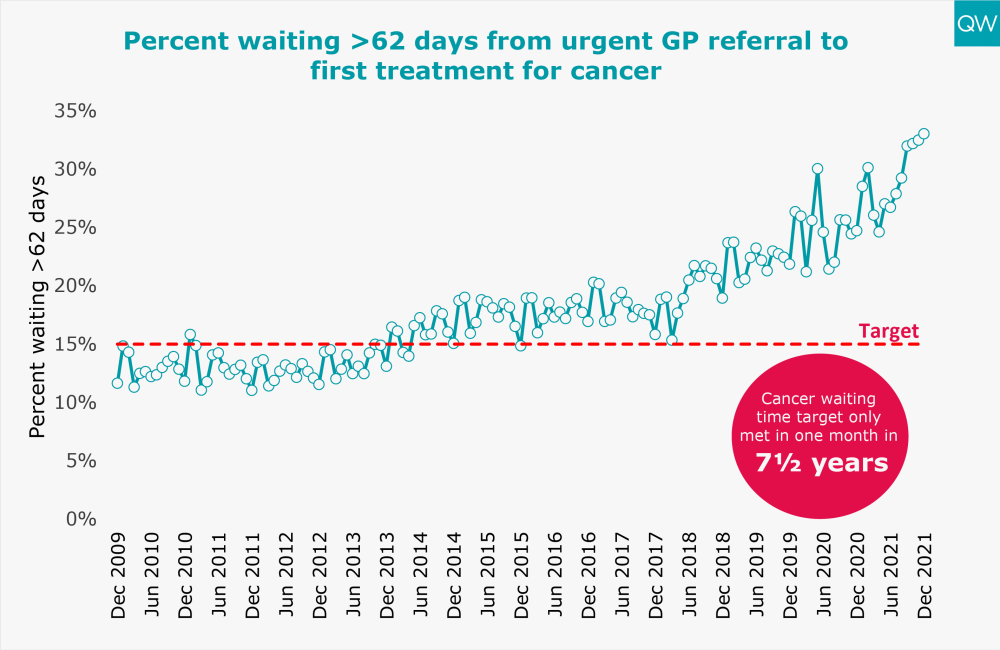
- A third of patients with an urgent GP referral for suspected cancer waited longer than two months for their first treatment in December.
Today, NHS England published the latest data on key activity and performance measures for December 2021 and January 2022. Here we show NHS performance against some key targets, including some of those set out in the latest planning guidance released earlier this week, as well as other indicators of patient safety and care.
Planned hospital care
- The total number of people waiting to start consultant-led elective treatment increased to 6.07 million in December 2021, the highest level since records began.
- The number of people waiting over 52 weeks to start elective treatment increased slightly to 310,813 in December 2021, which is much higher than pre-pandemic levels. In December 2019, 1,467 people were waiting over 52 weeks to start treatment.
- The number of people waiting over two years for planned hospital care increased to 20,065 in December 2021.
For more information, see our treatment waiting times and diagnostic test waiting times indicators
Cancer waiting times
- In December 2021, 33% of patients waited longer than two months to start their first treatment for cancer following an urgent GP referral – the worst on record. This has increased from 25% in December 2020 and 22% in December 2019.
For more information, see our cancer waiting time targets indicator.
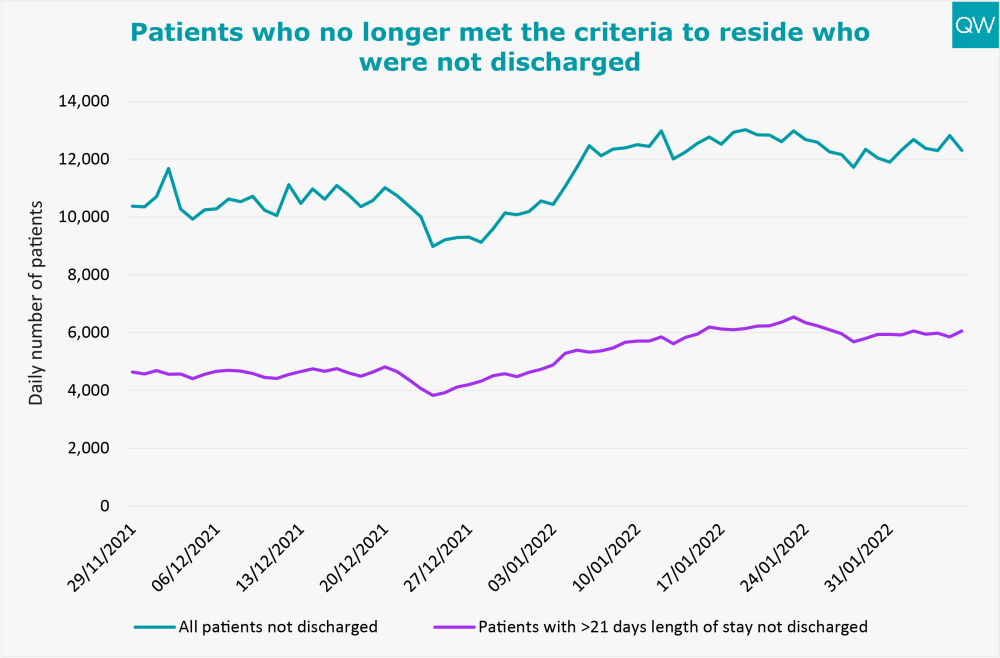
Hospital beds
- In Week 5 of 2022 (commencing 31 January), 64,719 patients who met the criteria for discharge were discharged, including 5,005 patients who had been in hospital for more than 21 days. However, 58% of all patients in acute trusts who met the criteria for discharge were not discharged. This figure increased to 89% for patients whose length of stay was longer than 21 days.
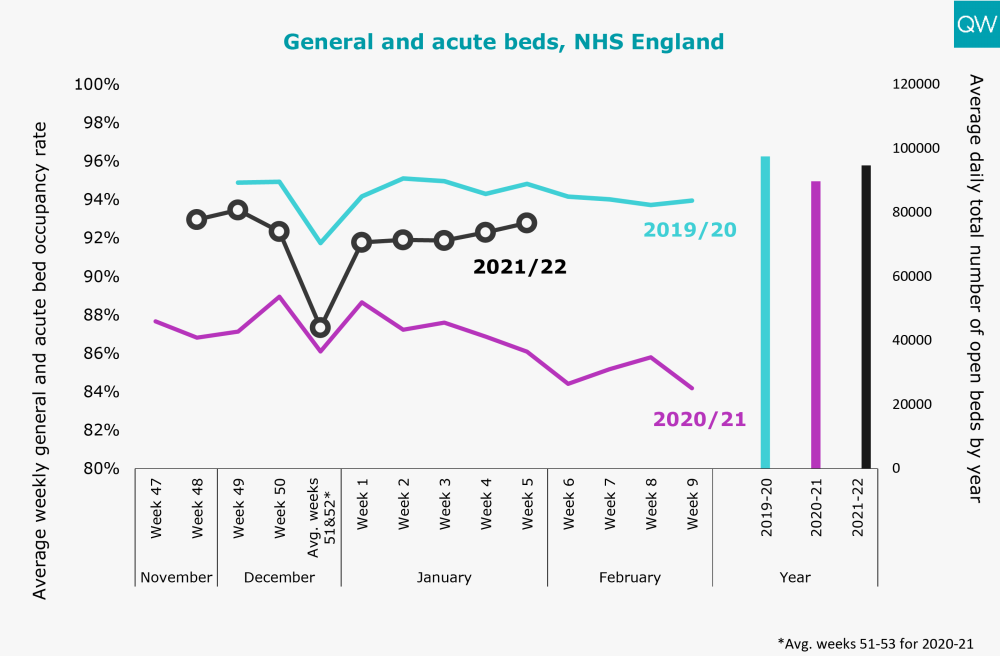
- 93% of general and acute beds were occupied in Week 5 of 2022 with an average of 95,747 beds available each day.
A&E waiting times
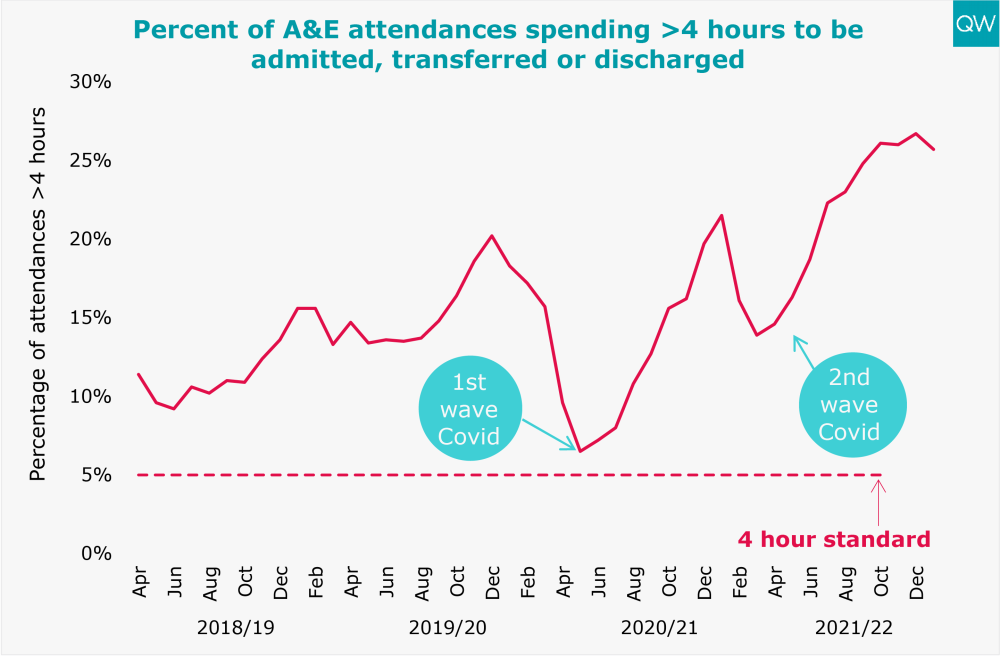
- There were almost 1.9 million A&E attendances in January 2022 – 11% lower than pre-pandemic levels in January 2020.
- In January 2022, 26% of people attending A&E spent more than four hours from arrival to admission, transfer or discharge. This is a slight improvement from 27% in December 2021, which was the worst on record.
- 12 hour trolley waits have continued to increase. In January 2022, 16,558 people waited over 12 hours from a decision to admit to admission – a 28% increase on December 2021 and over four times greater than in January 2020.
Ambulance response times
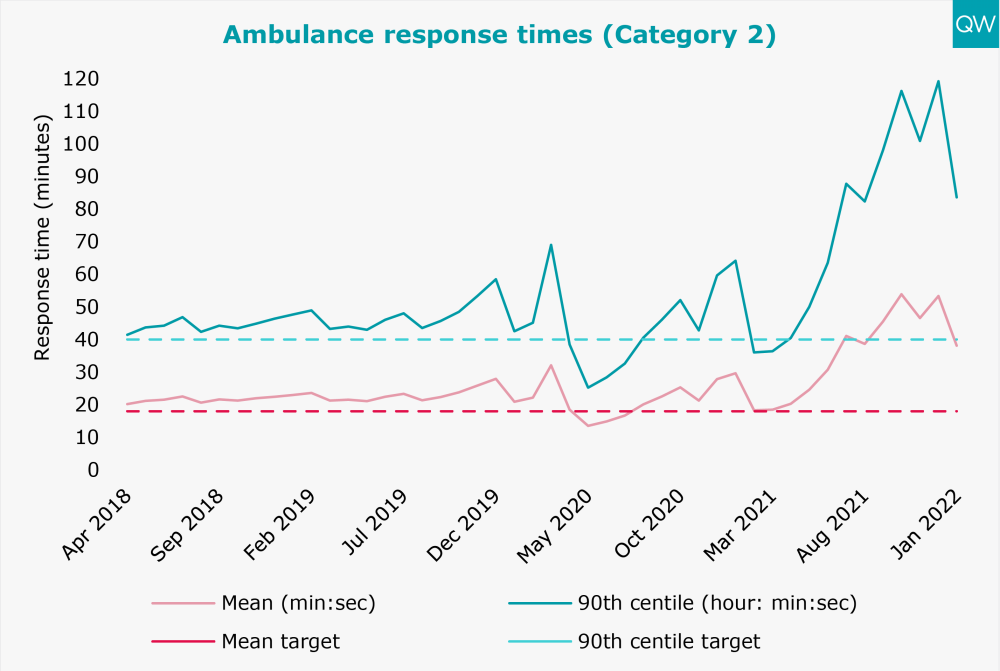
- In January 2022, the average response time by ambulances for Category 1 (life-threatening) incidents improved to 8 minutes 31 seconds but was still above the mean target of 7 minutes.
- The average response time by ambulances for Category 2 (emergency) incidents decreased to 38 minutes 4 seconds in January 2022 but was still above the mean target of 18 minutes. The 90th centile was 1 hour 24 minutes, two times the target of 40 minutes.
For more information, see our ambulance response times indicator.
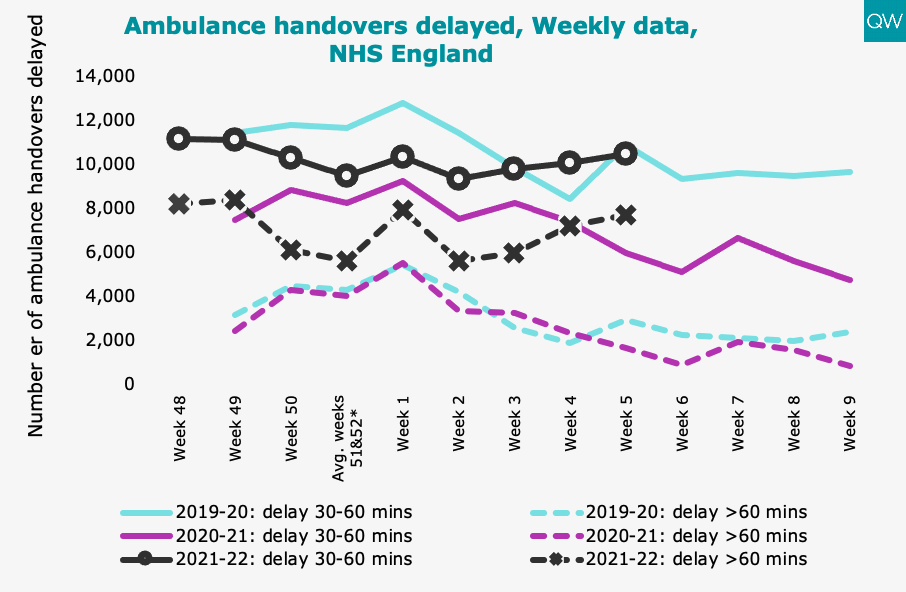
Ambulance handover delays
- In Week 5 of 2022 (beginning 31 January), 18,193 ambulances experienced a handover delay of over 30 minutes, 21% of all abulances arriving. 42% (7,725) of these delays were over 60 minutes.
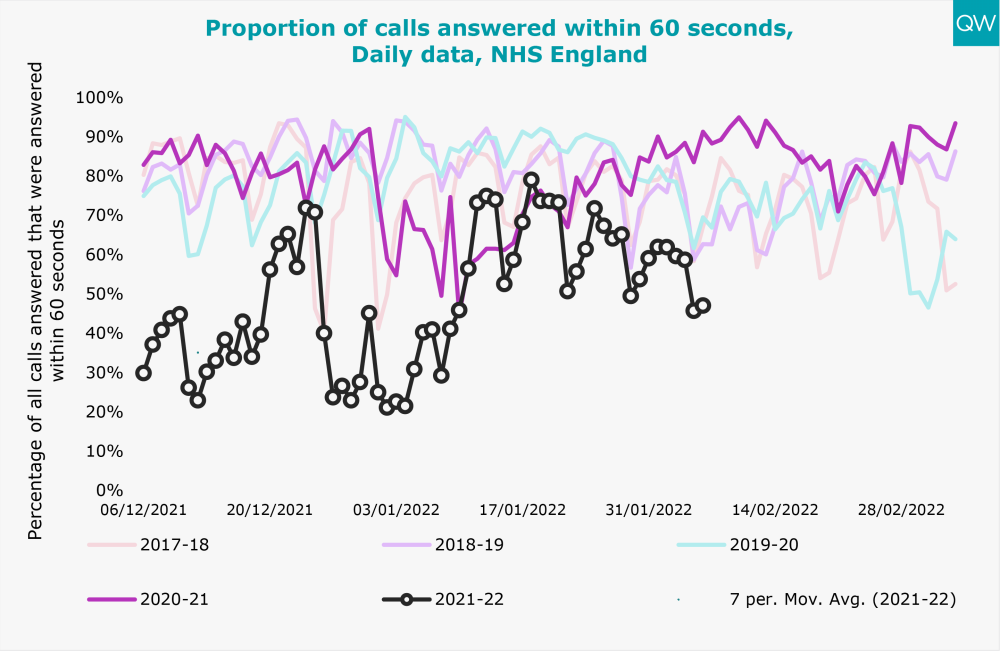
NHS 111
- Performance against the proportion of calls answered by NHS 111 within 60 seconds has fallen from 79% on 18th January 2022, to 55% in Week 5 of 2022, when only 55% of calls were answered within 60 seconds.
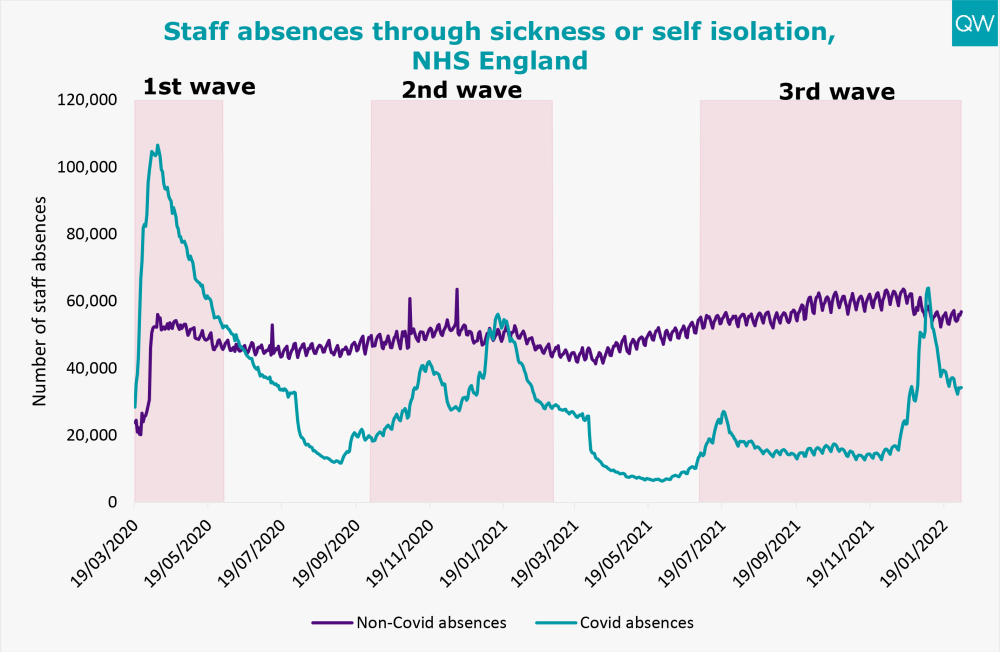
Staff absences
- The number of NHS staff absences due to Covid-19 has fallen in the last month from a peak of 63,922 on 6th January 2022 to 34,298 on 2nd February 2022.
- Whilst Covid-19 absences have fallen considerably, in Week 4 of 2022 beginning 24 Janauary there were on average 14,101 more staff absences in the than at the start of winter (Week 48 of 2021 beginning 29 November).
About this data
During this unprecedented time for the health service, QualityWatch continues to provide independent scrutiny of the health and social care system as far as possible. The most recent data published today reflects changes in access and service use as a result of the coronavirus (Covid-19) pandemic. In light of these shifts in activity, we have added new charts and changed the presentation of some of our usual charts, to aid interpretation. It is also worth noting that NHS England have suspended data collection for some of their performance statistics, including delayed transfers of care.
In March 2019, the Clinically-Led Review of NHS Access Standards Interim Report was released, proposing some significant changes to many of the targets reported on here. A six-month Progress Report from the NHS Medical Director was also published in October 2019. Field testing of the proposed new standards began in 2019 and NHS England has recently consulted on the recommendations for urgent and emergency care.
For urgent and emergency care, the field test sites have not been submitting four-hour performance data since May 2019. The time series presented here excludes the field testing sites and so is comparable across months and years. For elective care, performance of the field test sites will continue to be included in the national time series, so the data is fully comparable over time.
For interactive charts showing the quality of health and social care over time, please refer to our 200+ indicators.