
Headlines
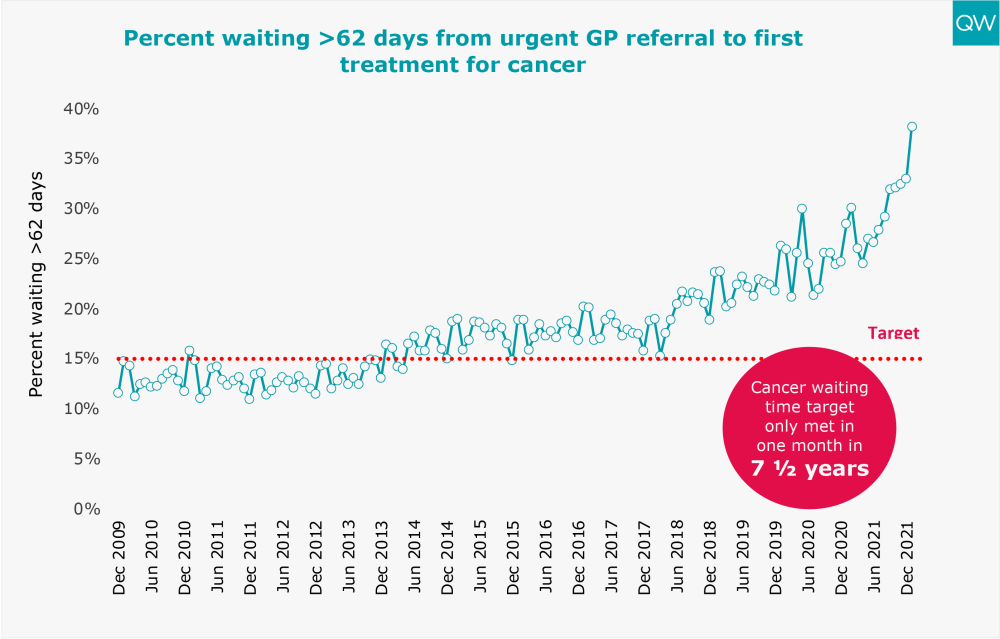
- People are waiting longer for urgent cancer treatment. In January 2022, 38% of patients with an urgent GP referral waited more than two months for their first treatment of cancer.
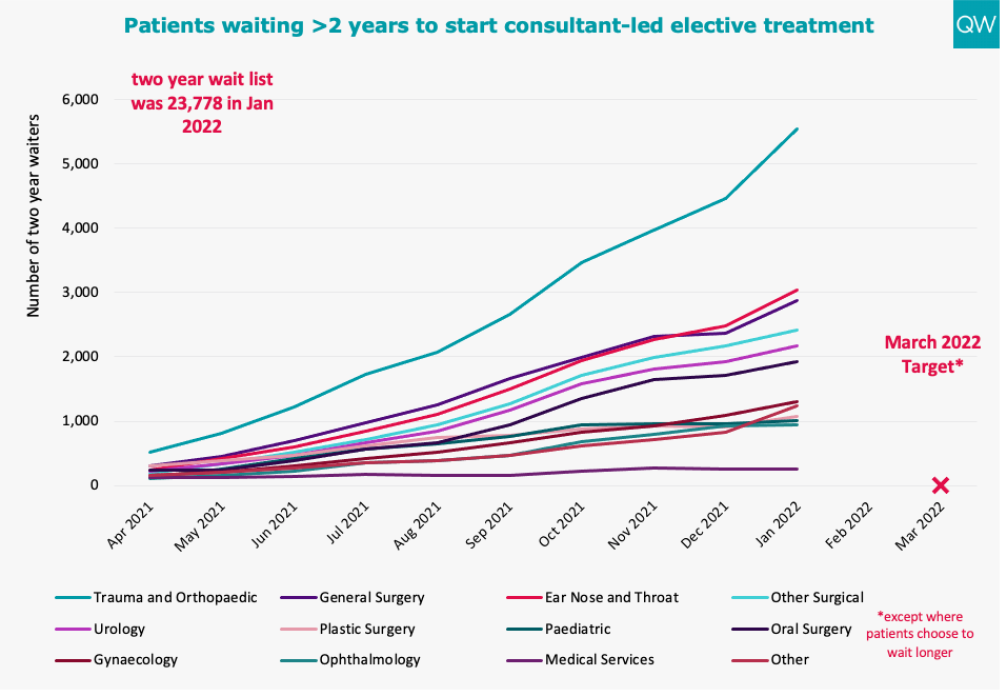
- As of January 2022, the waiting list for people waiting over two years for consultant led treatment grew to 23,778 – more than eight times the number in April 2021, when this data was first published.
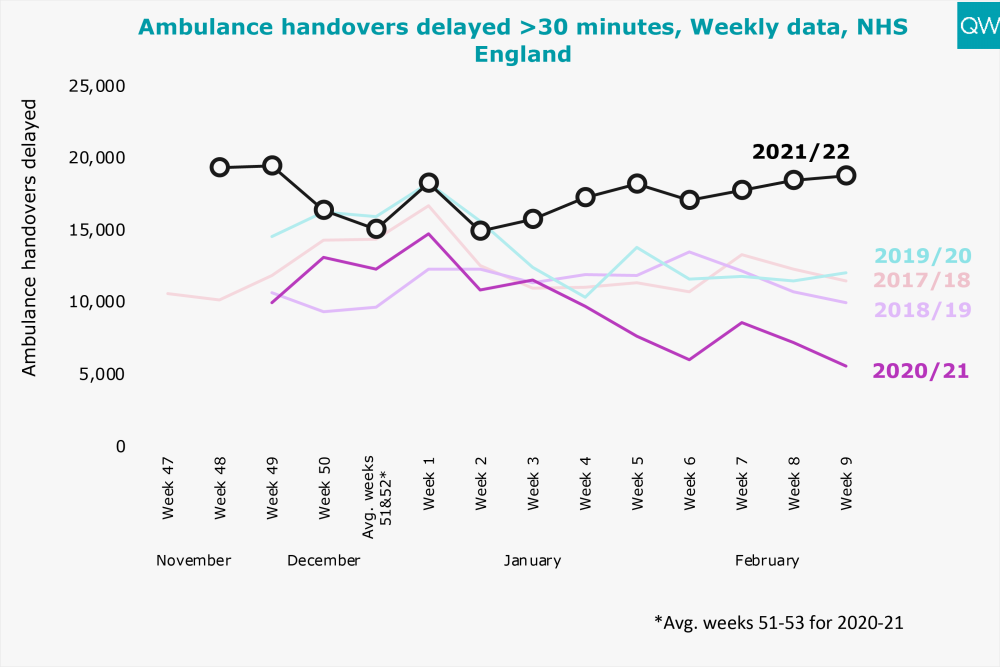
- Ambulance handover delays have continued to rise over the last month. In the week commencing 28th February 2022, 18,799 ambulances experienced a handover delay of over 30 minutes, including 7,672 with delays over 1 hour.
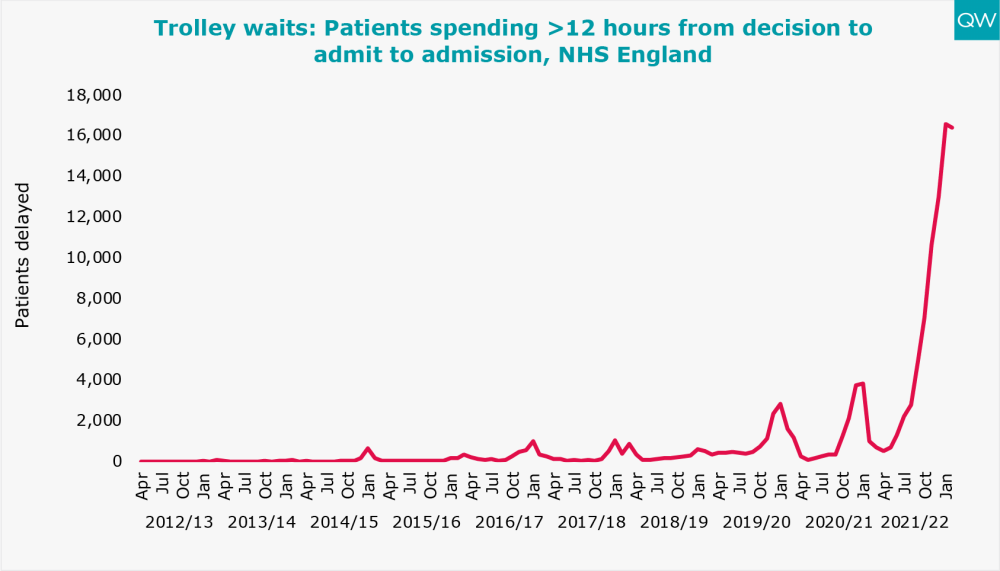
- Trolley waits remain high: in February 2022, 16,404 patients waited over 12 hours from decision to admit to admission – more than sixteen times the number in February 2021.
Today, NHS England published the latest data on key activity and performance measures for January and February 2022. Here we show NHS performance against some key targets, including some of those set out in the latest planning guidance released last month, as well as other indicators of patient safety and care.
Planned hospital care
Consultant led treatment waiting times
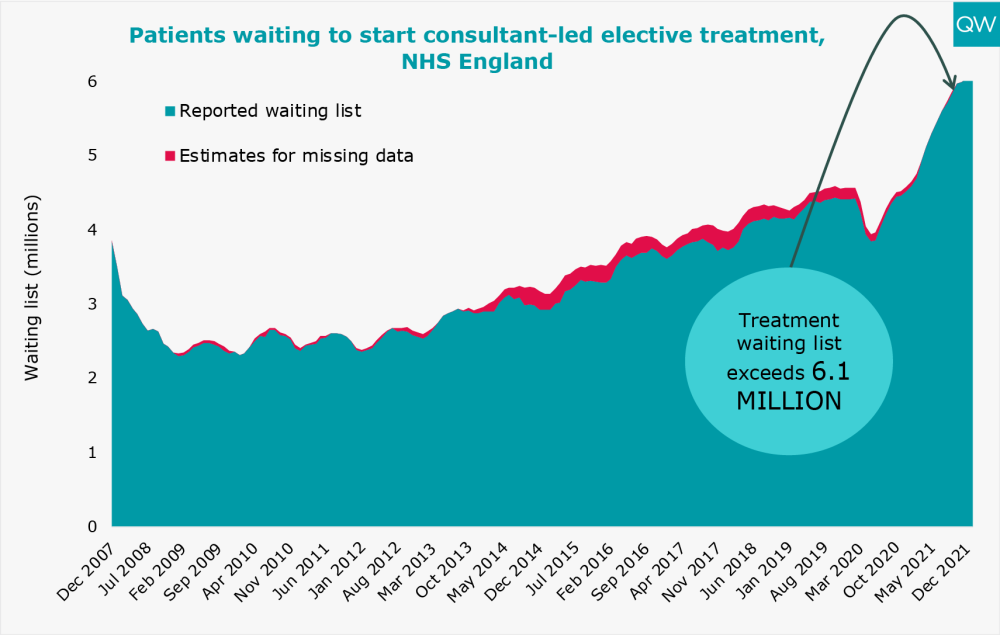
- The waiting list for people waiting to start consultant-led elective treatment increased to 6.1 million in January 2022, the highest level since records began.
- The waiting list for people waiting over 52 weeks to start elective treatment increased slightly to 311,528 in January 2022, which is much higher than pre-pandemic levels. For example, in January 2020, the waiting list for people waiting over 52 weeks was 1,643.
- The waiting list for people waiting over two years for planned hospital care increased to 23,778 in January 2022.
Planned hospital care
Consultant led treatment waiting times
- The waiting list for people waiting to start consultant-led elective treatment increased to 6.1 million in January 2022, the highest level since records began.
- The waiting list for people waiting over 52 weeks to start elective treatment increased slightly to 311,528 in January 2022, which is much higher than pre-pandemic levels. For example, in January 2020, the waiting list for people waiting over 52 weeks was 1,643.
- The waiting list for people waiting over two years for planned hospital care increased to 23,778 in January 2022.
For more information, see our treatment waiting times and diagnostic test waiting times indicators.
Cancer waiting times
- In January 2022, 38% of patients who had their first treatment for cancer following an urgent GP referral waited longer than two months; this equates to 5,161 people, 11% more than the previous month.
For more information, see our cancer waiting time targets indicator.
Emergency care
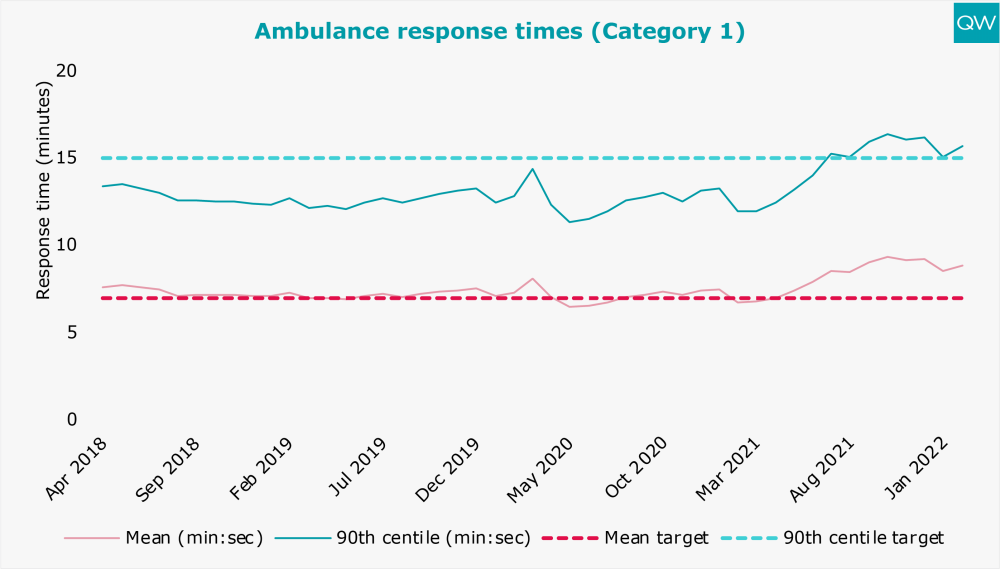
Ambulance response times
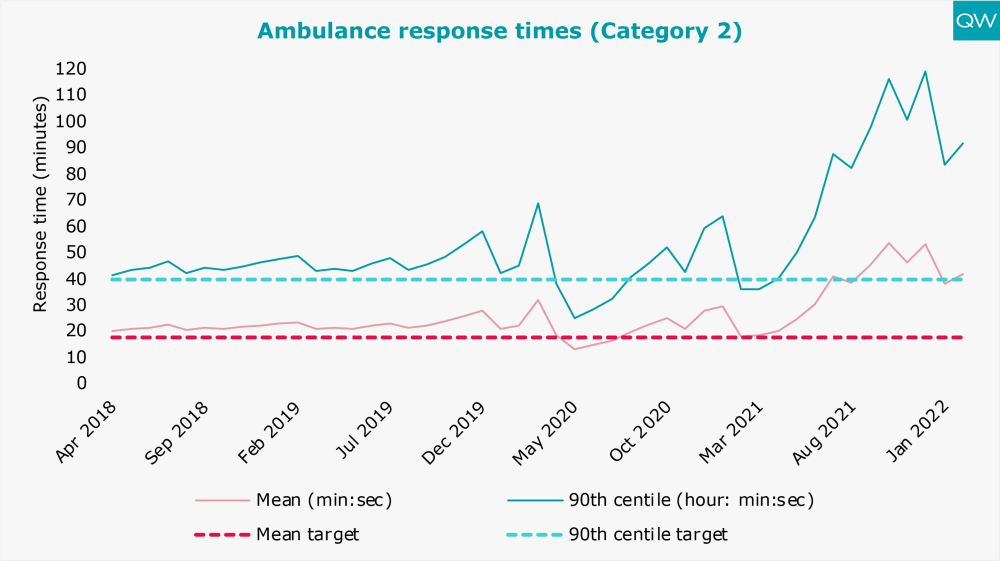
- In February 2022, the average response time by ambulances for Category 1 (life-threatening) incidents increased to 8 minutes 51 seconds and remains above the mean target of 7 minutes.
- The average response time by ambulances for Category 2 (emergency) incidents increased to 42 minutes 7 seconds in February 2022, remaining above the 18 minute target. The 90th centile was 1 hour 32 minutes, more than two times the 40 minute target.
For more information, see our ambulance response times indicator.
Ambulance handover delays
- In Week 9 of 2022 (commencing 28 February), 18,799 ambulances experienced a handover delay of over 30 minutes, 22% of all abulances arriving at hospital. 41% (7,672) of these delays were over 60 minutes.
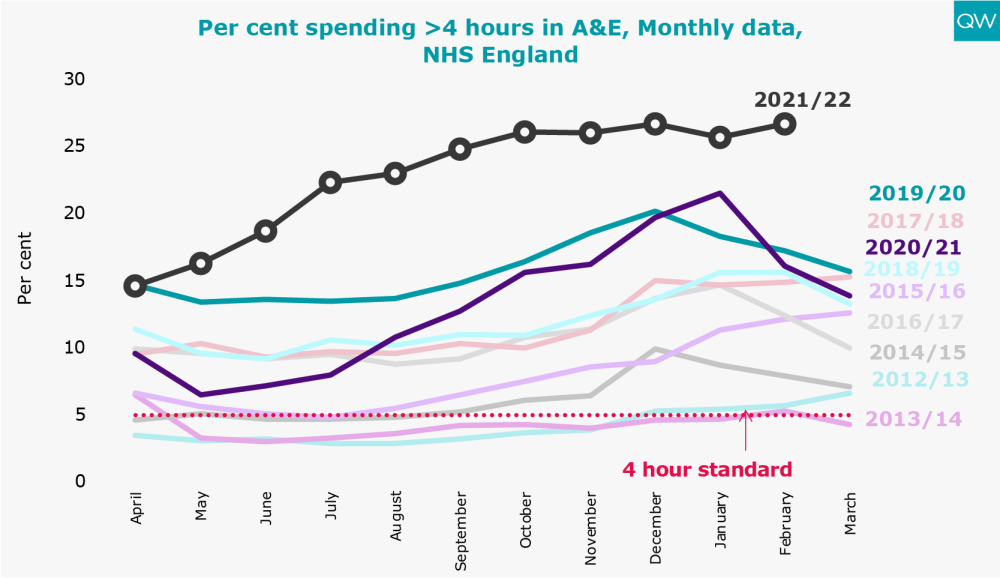
Accident and Emergency waiting times
- In February 2022, 27% of people attending A&E spent more than four hours from arrival to admission, transfer or discharge. Throughout 2021/22, performance against this measure has been consistently worse than the previous nine years.
- 12 hour trolley waits have remained at an unprecedented level. In February 2022, 16,404 people waited over 12 hours on a trolley before being admitted after a decision to admit, roughly the population of Preston. The number of 12 hour trolley waits in February 2022 is 16 times higher than in February 2021 and 31 times higher than in February 2019.
For more information, see our A&E waiting times indicator.
Capacity and Staffing
Hospital beds
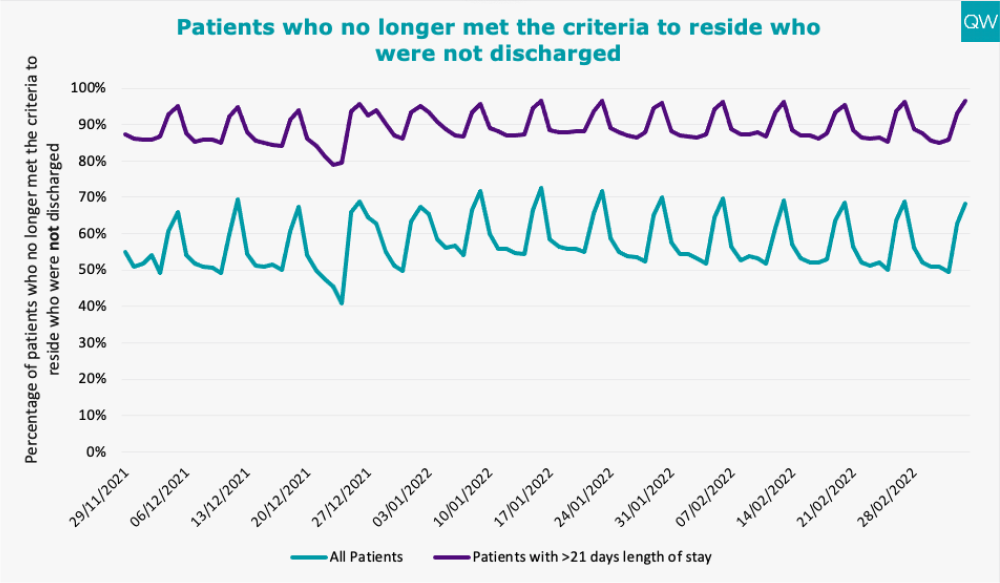
- In Week 9 of 2022 (commencing 28 February), 66,937 patients were discharged from hospital, including 5,007 patients who had been in hospital for more than 21 days. However, on average per day, 56% of all patients in acute trusts who no longer meet the criteria to reside were not discharged. This figure increases to 89% for patients whose length of stay is longer than 21 days.
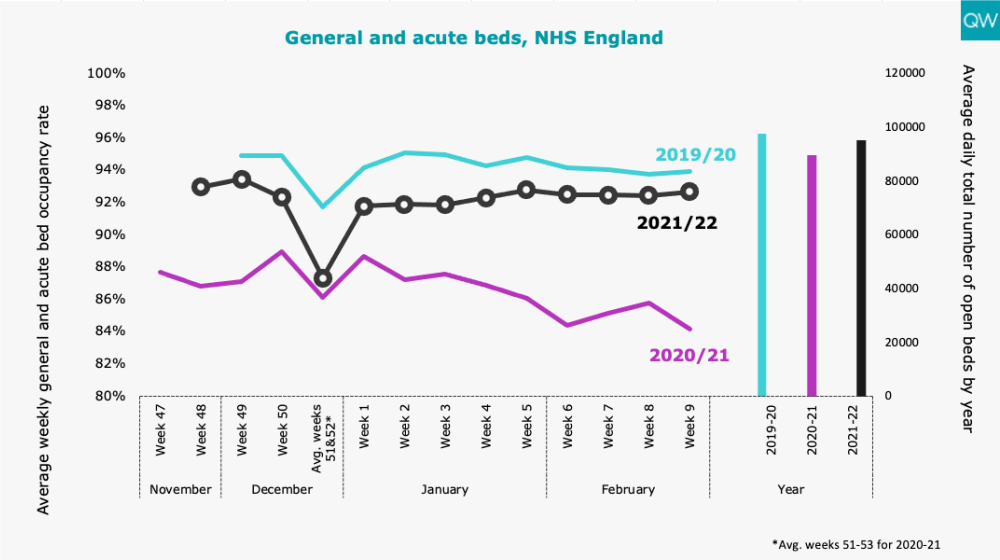
- On average per day 93% of general and acute beds were occupied in Week 9 of 2022 with an average of 96,239 beds available each day.
Staff absences
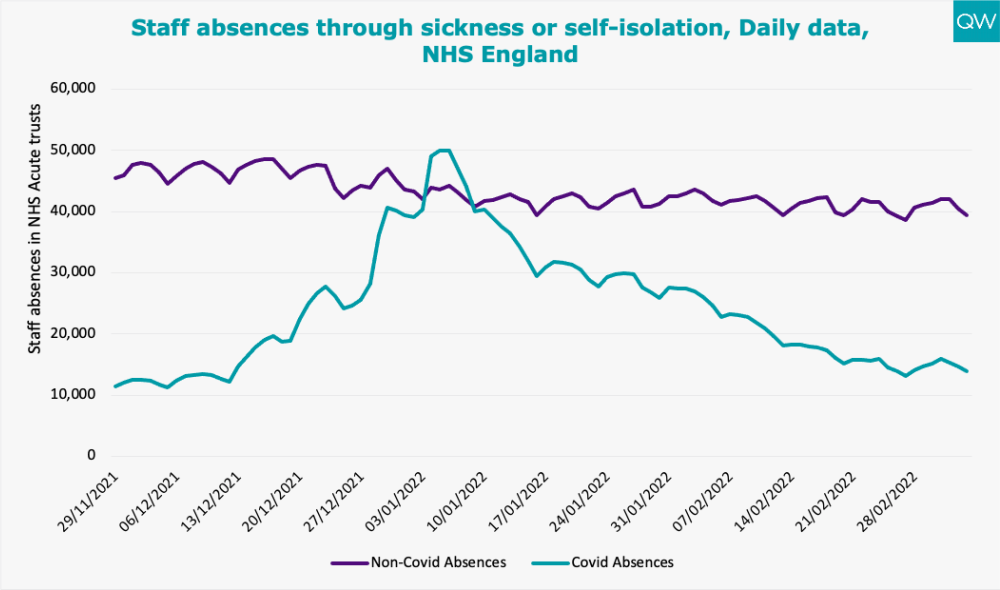
- The number of NHS staff absences due to Covid-19 has continued to fall from a peak of 63,922 on 6th January 2022 to 19,129 on 2 March 2022.
- There is a similar picture in acute NHS trusts, where the number of recorded absences has fallen from a peak of 49,941 on 5th January 2022 to 13,968 on 6 March 2022.
About this data
During this unprecedented time for the health service, QualityWatch continues to provide independent scrutiny of the health and social care system. The most recent data published today reflects changes in access and service compared to pre-pandemic healthcare delivery. In light of these shifts in activity, we have added new charts and changed the presentation of some of our usual charts, to aid interpretation. It is also worth noting that NHS England have suspended data collection for some of their performance statistics, including delayed transfers of care.
In March 2019, the Clinically-Led Review of NHS Access Standards Interim Report was released, proposing some significant changes to many of the targets reported on here. A six-month Progress Report from the NHS Medical Director was also published in October 2019. Field testing of the proposed new standards began in 2019 and NHS England has recently consulted on the recommendations for urgent and emergency care.
For urgent and emergency care, the field test sites have not been submitting four-hour performance data since May 2019. The time series presented here excludes the field testing sites and so is comparable across months and years. For elective care, performance of the field test sites will continue to be included in the national time series, so the data is fully comparable over time.
For interactive charts showing the quality of health and social care over time, please refer to our 200+ indicators.