
Today, NHS England published the latest data on key activity and performance measures for July and August of this year. Here we show some of these statistics and how they compare with previous trends.
Urgent care
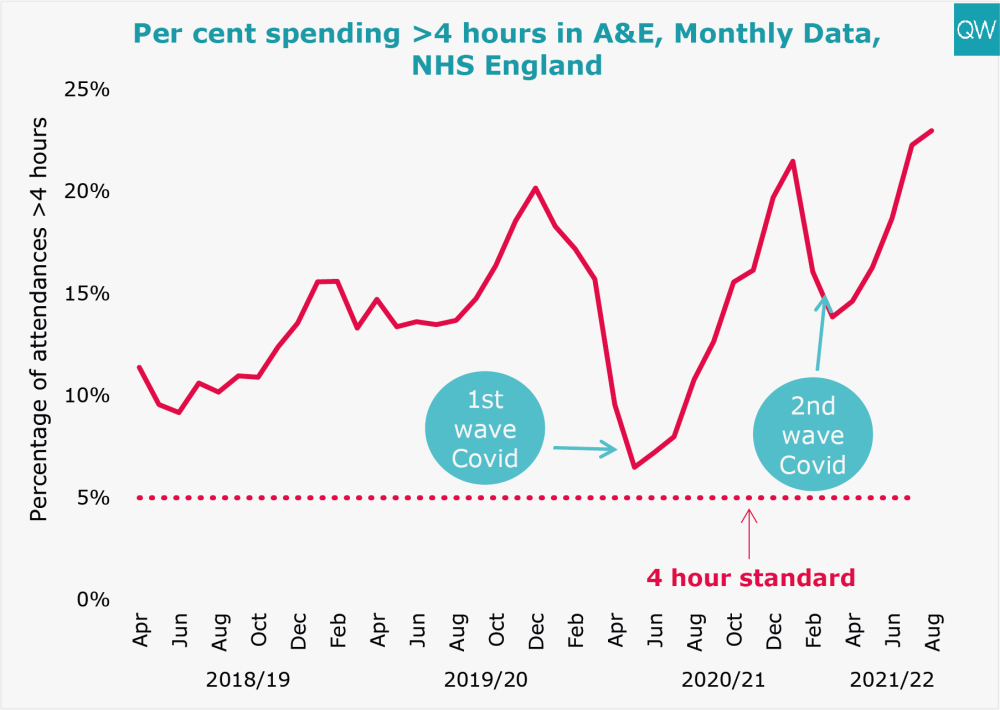
- In August 2021, over one in five people (23%) attending A&E spent more than four hours from arrival to admission, transfer or discharge, the worst performance since records began.
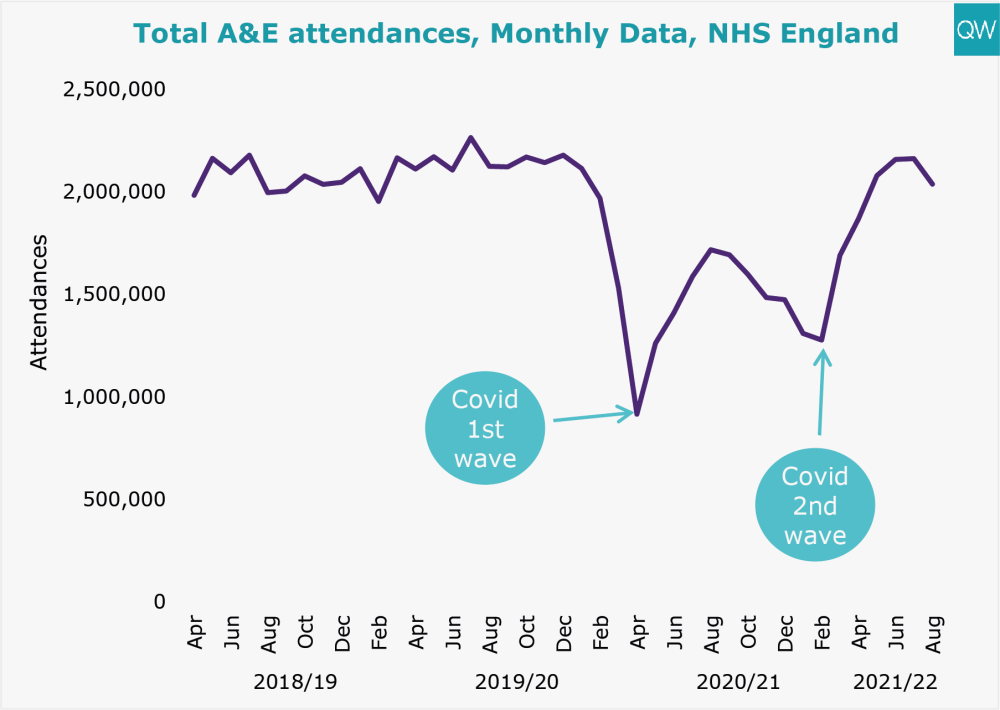
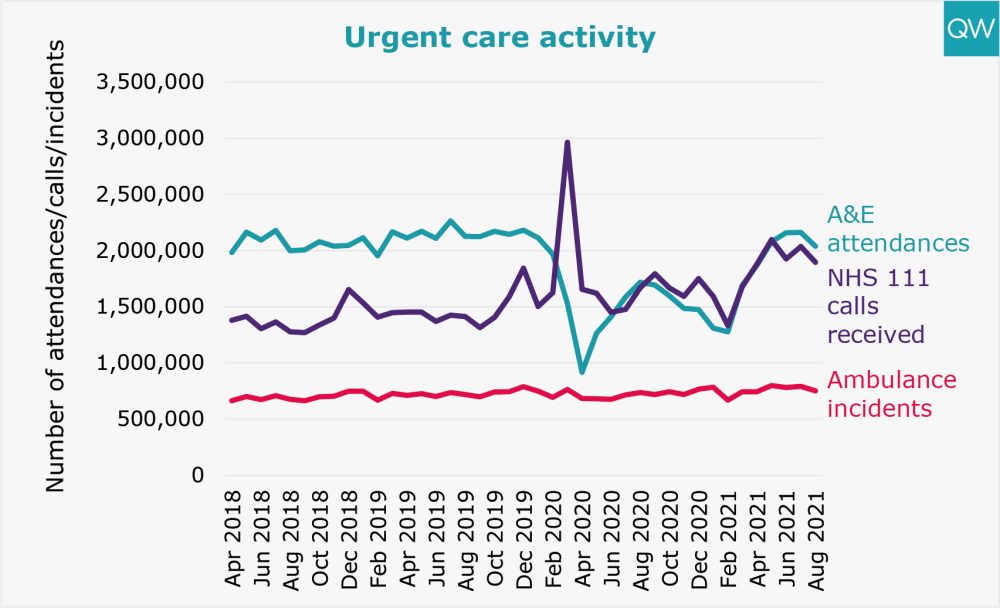
- There were over 2 million A&E attendances in August 2021 – 19% higher than in August 2020 (between the first and second waves of the Covid-19 pandemic) but 4% lower than in August 2019.
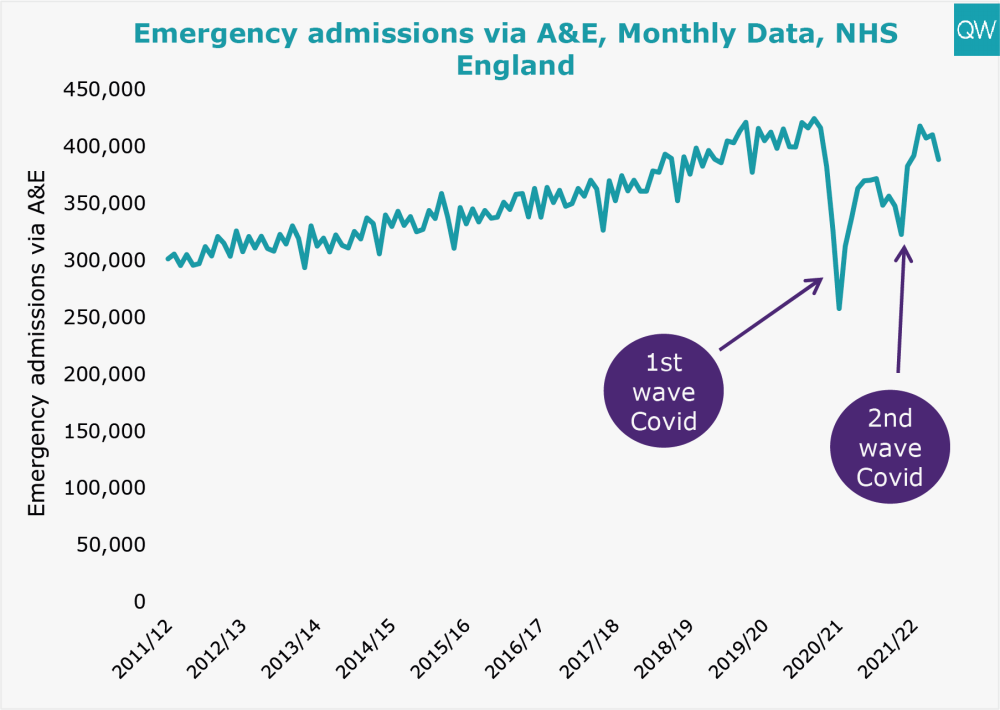
- In August 2021, emergency admissions via A&E decreased on the previous month to 388,776 – 5% higher than in August 2020 but 3% lower than in August 2019.
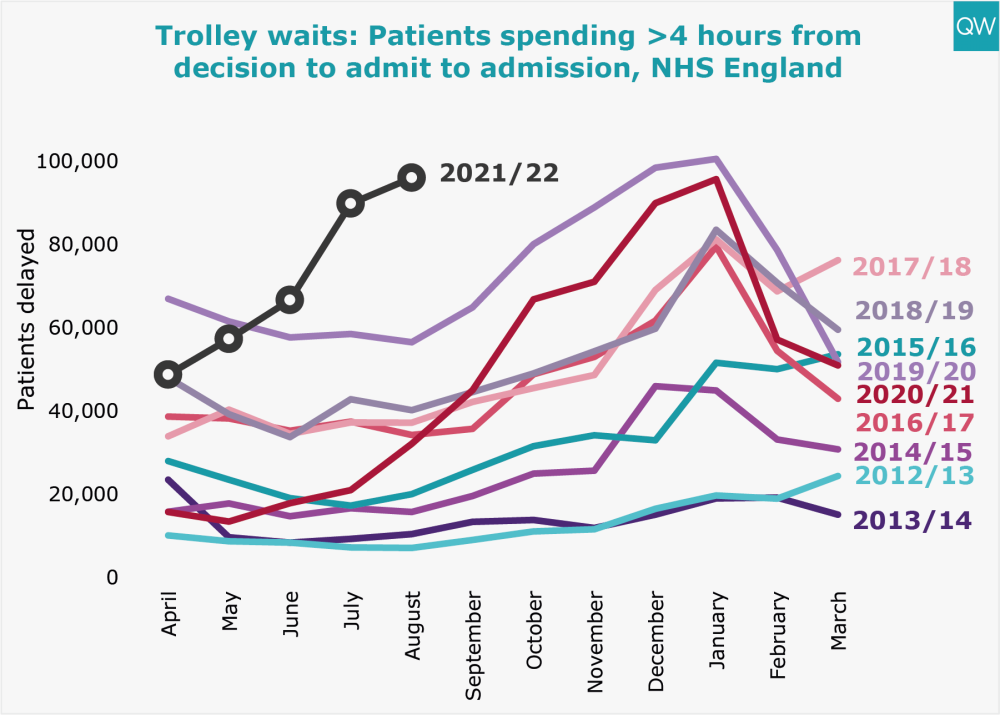
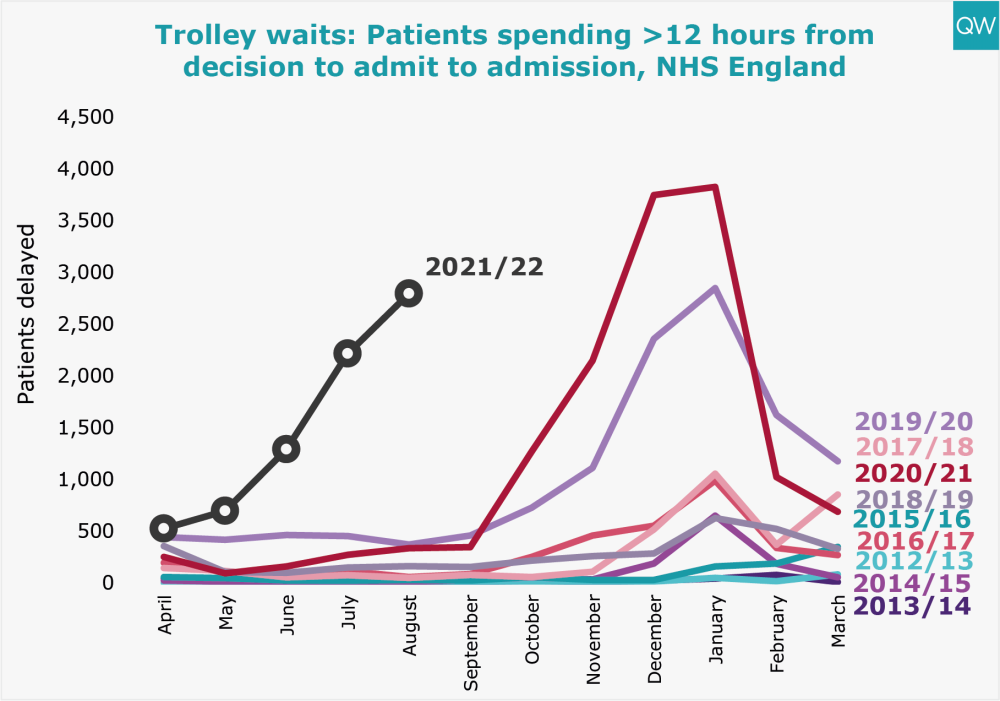
- 96,013 patients spent more than four hours waiting on a trolley from a decision to admit to admission in August 2021, the highest number for any August since records began. 2,794 people had a trolley wait of over 12 hours.
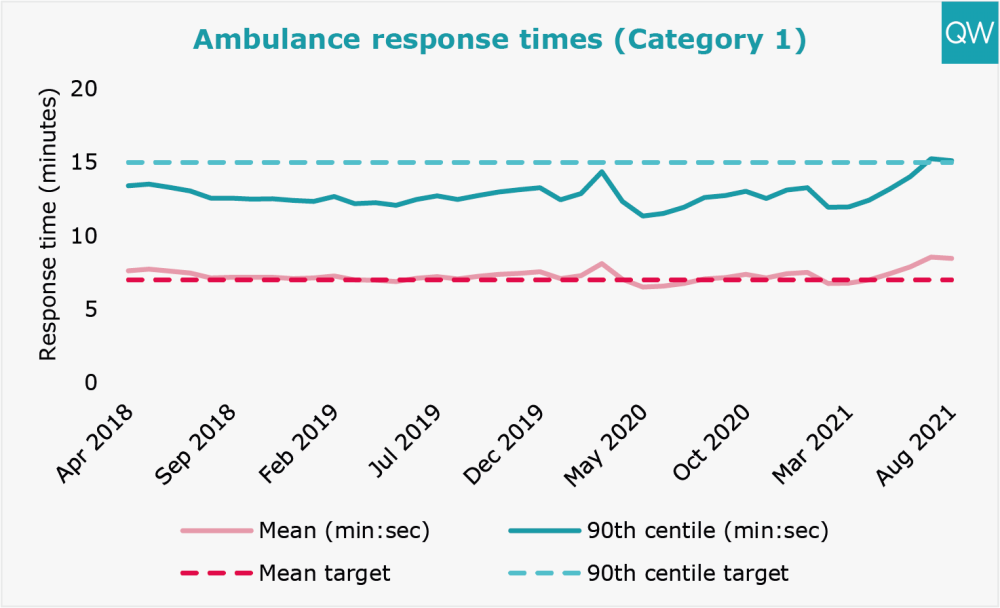
- In August 2021, the average response time for Category 1 (life-threatening) ambulance incidents remained similar to the previous month at 8 minutes 28 seconds (mean target of 7 minutes).
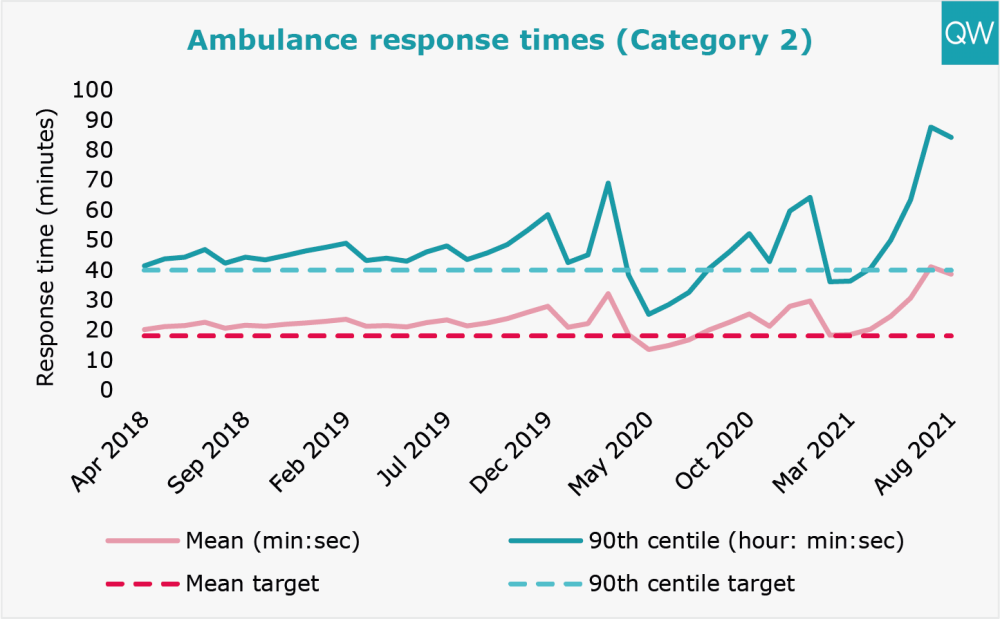
- The average response time for Category 2 (emergency) calls stayed high at 38 minutes 39 seconds in August 2021, surpassing the mean target of 18 minutes and almost reaching the 90th centile target of 40 minutes.
For more information, see our A&E waiting times and ambulance response times indicators.
Treatment and diagnostic test waiting times
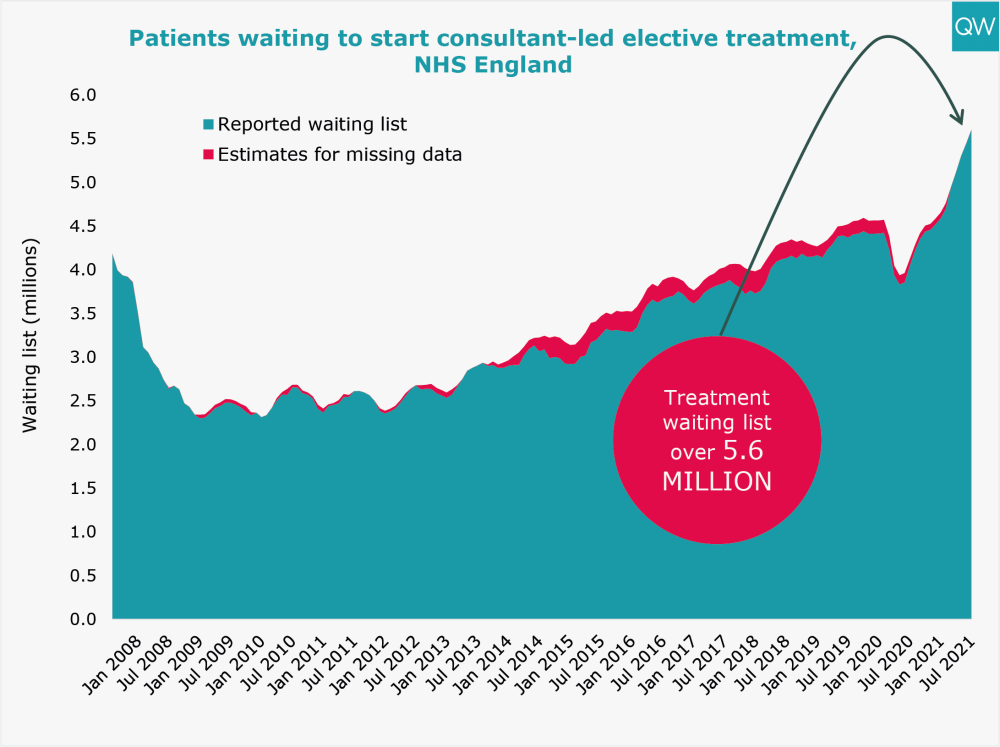
- The total number of people waiting to start consultant-led elective treatment increased to over 5.6 million in July 2021, the highest level since records began.
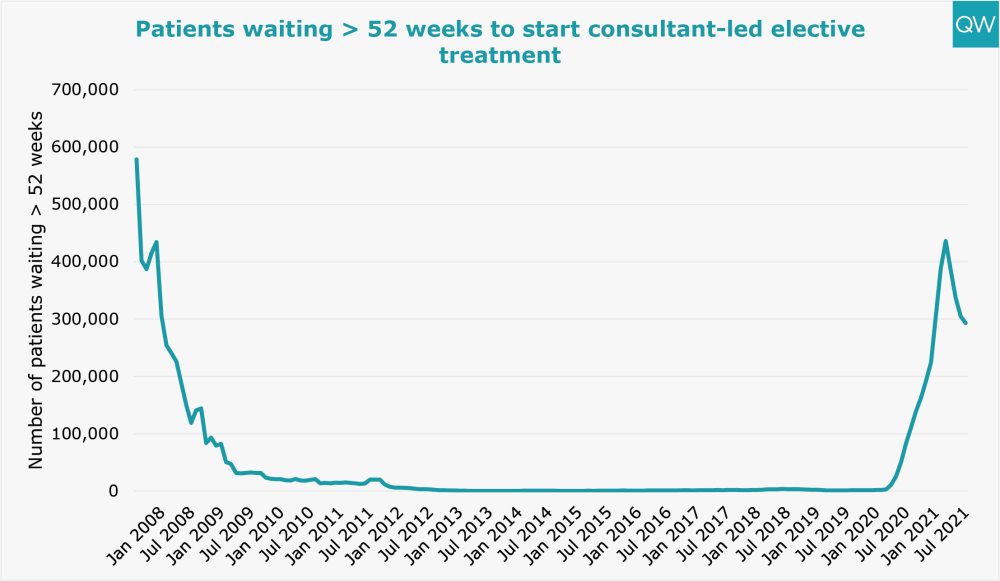
- The number of people waiting over 52 weeks to start consultant-led elective treatment fell slightly in July 2021 to 293,102, but remains significantly higher than in June 2019 when there were 1,032 people.
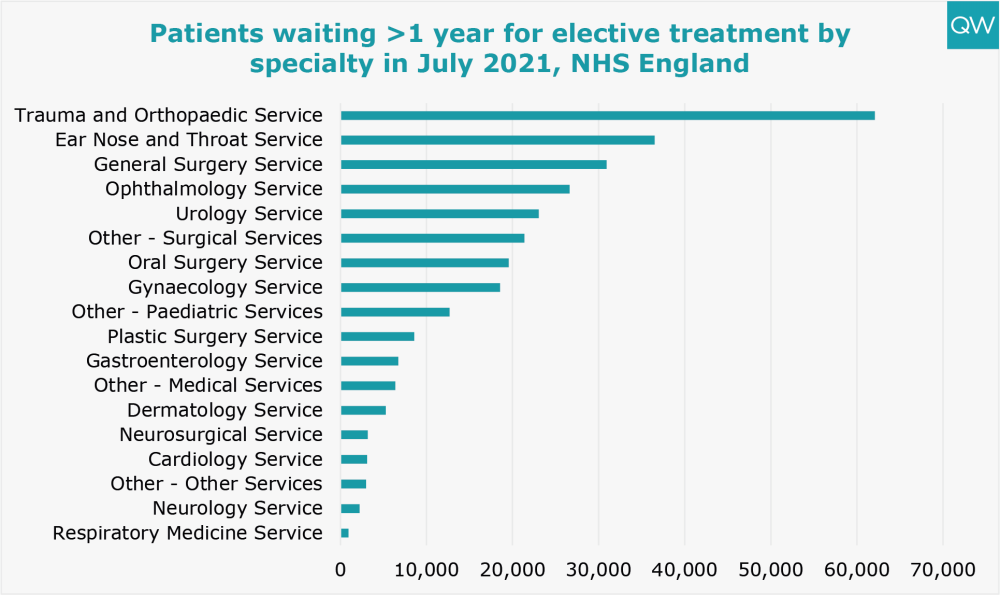
- The specialties with the highest number of patients waiting over one year were trauma and orthopaedics; ear, nose and throat; and general surgery.
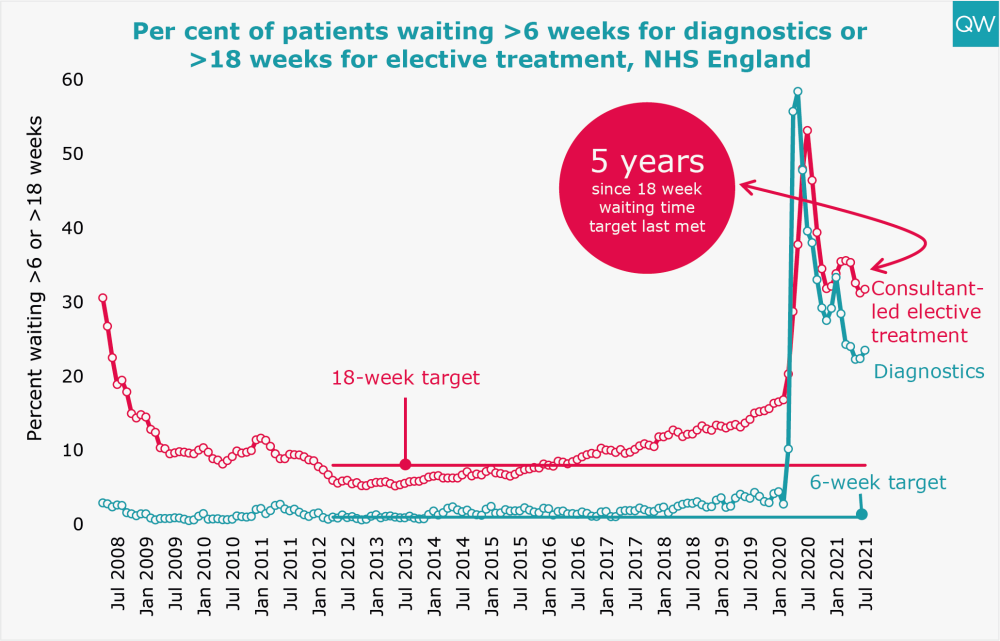
- 32% of patients had been waiting over 18 weeks to start elective treatment in July 2021, a 21 percentage point improvement compared to the peak in July 2020, but still 18 percentage points worse than in July 2019.
- Almost one in four patients (24%) had been waiting over six weeks for a diagnostic test in July 2021. The diagnostic waiting time target has not been met for over seven and a half years.
For more information, see our treatment waiting times and diagnostic test waiting times indicators.
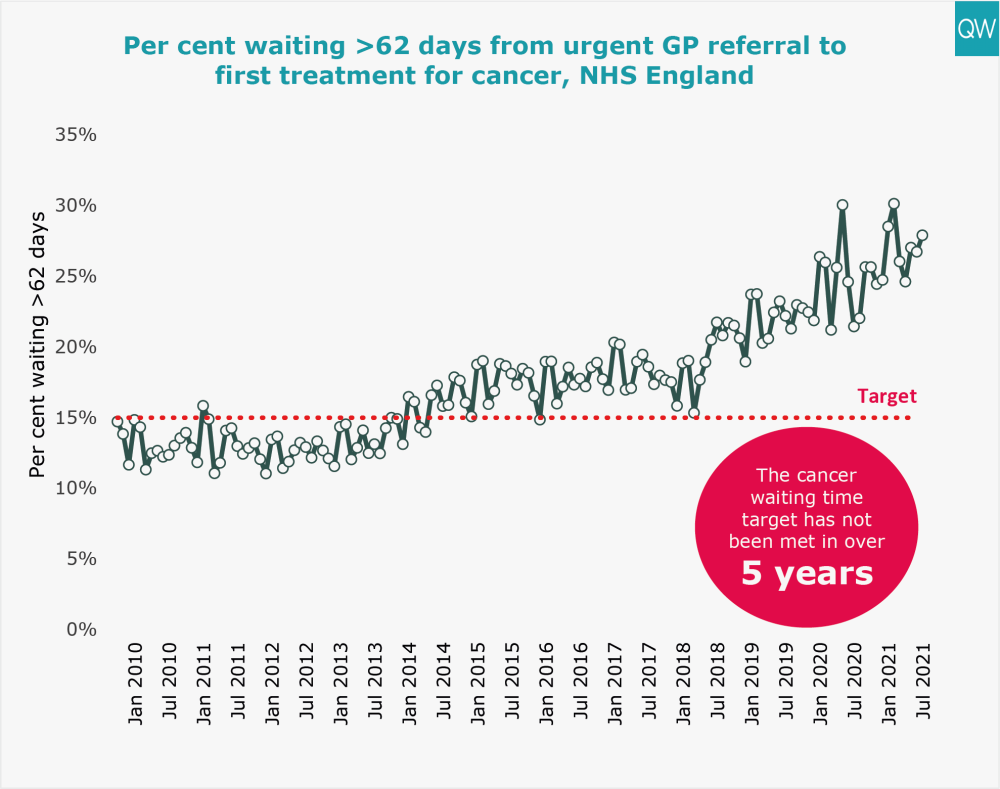
Cancer waiting times
- In July 2021, 28% of patients waited longer than two months to start their first treatment following an urgent GP referral for suspected cancer, the worst performance for any July on record.
- The 62-day cancers target has not been met for five and a half years.
For more information, see our cancer waiting time targets indicator.
About this data
During this unprecedented time for the health service, QualityWatch continues to provide independent scrutiny of the health and social care system as far as possible. The most recent data published today reflects changes in access and service use as a result of the coronavirus (Covid-19) pandemic. In light of these shifts in activity, we have added new charts and changed the presentation of some of our usual charts, to aid interpretation. It is also worth noting that NHS England have suspended data collection for 2020/21 and Q1 2021/22 for some of their performance statistics, including delayed transfers of care.
In March 2019, the Clinically-Led Review of NHS Access Standards Interim Report was released, proposing some significant changes to many of the targets reported on here. A six-month Progress Report from the NHS Medical Director was also published in October 2019. Field testing of the proposed new standards began in 2019 and NHS England has recently consulted on the recommendations for urgent and emergency care.
For urgent and emergency care, the field test sites have not been submitting four-hour performance data since May 2019. The time series presented here excludes the field testing sites and so is comparable across months and years. For elective care, performance of the field test sites will continue to be included in the national time series, so the data is fully comparable over time.
For interactive charts showing the quality of health and social care over time, please refer to our 200+ indicators.