
Headlines
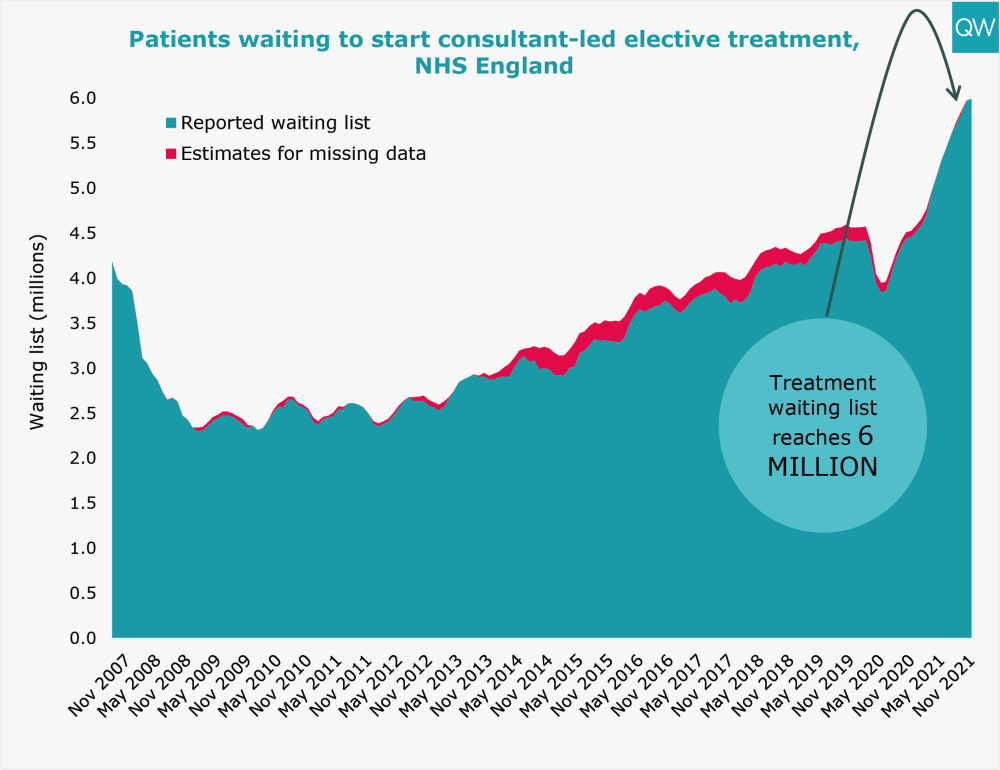
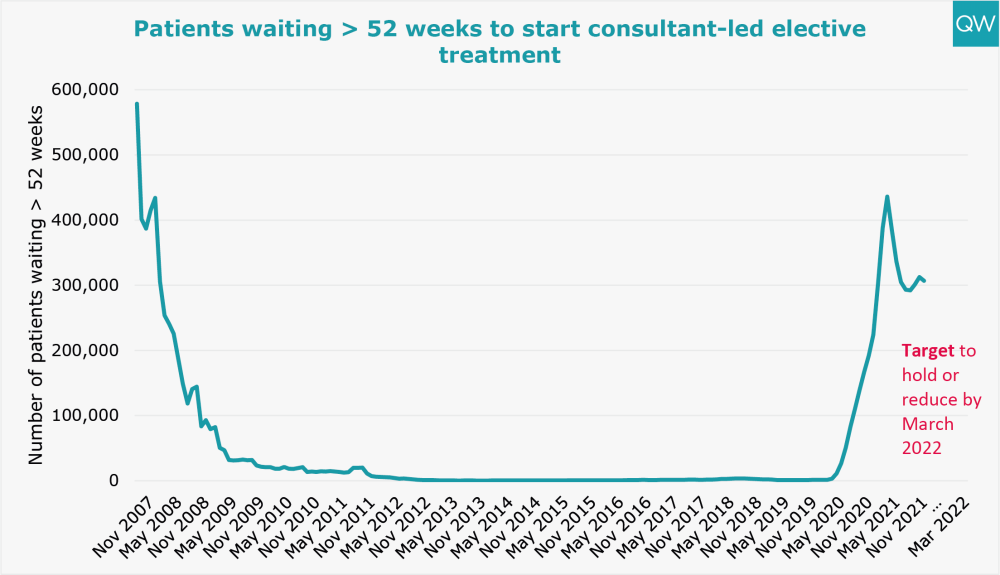
- The waiting list for planned hospital care grew to 6 million in November, with over 5% of people waiting for over a year.
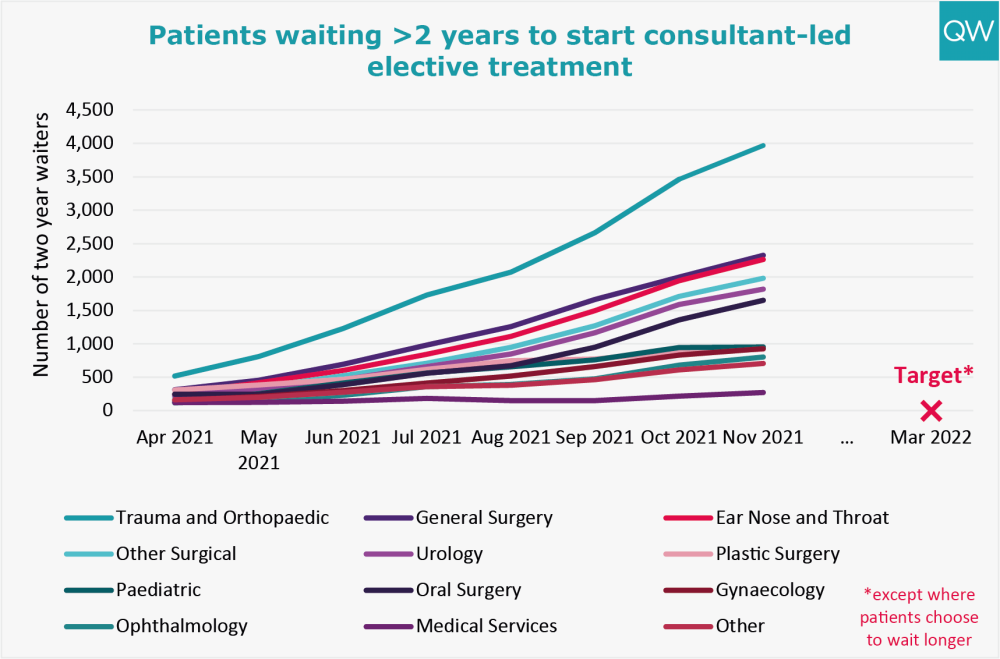
- The number of two year waiters for planned care increased to 18,585, further from the target to eliminate them by March 2022.
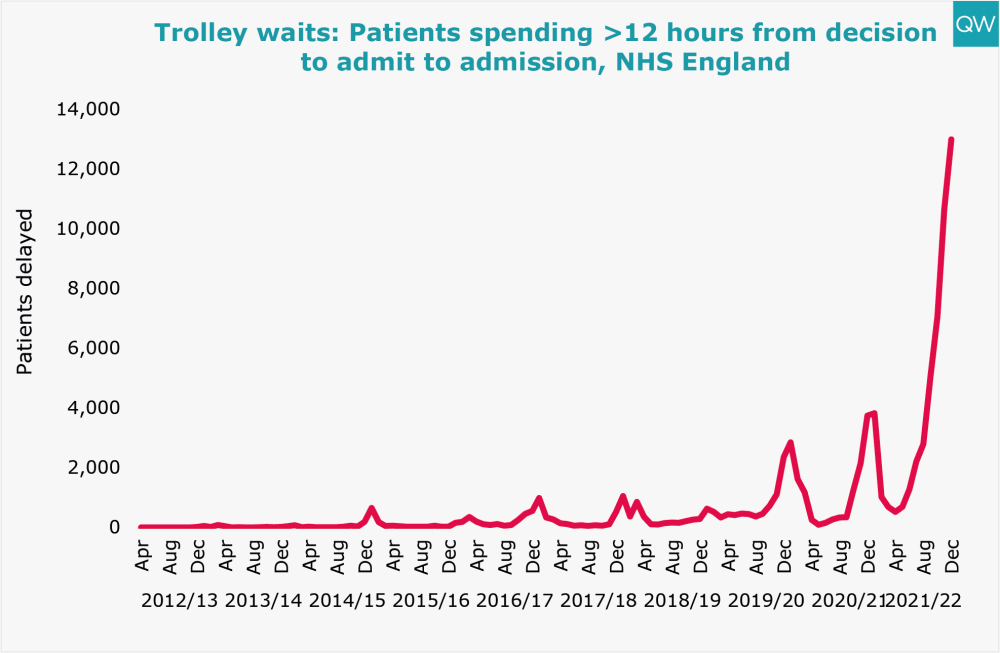
- 12,986 patients spent more than 12 hours waiting on a trolley from a decision to admit to admission in December 2021 – five times higher than in December 2019.
- In acute hospitals, staff absences were the highest they have been this winter, exceeding 94,000 in one day in the week beginning 3rd January.
Today, NHS England published the latest data on key activity and performance measures for November and December of 2021. Urgent and Emergency Care Daily Situation Reports were also published for the week beginning 3 January 2022, giving a more up-to-date analysis of how the NHS is coping this winter. Here we show the performance against some key targets, including those set out in the 2021/22 operational planning guidance published in September.
Planned hospital care and diagnostics
- The total number of people waiting to start consultant-led elective treatment increased to 6 million in November 2021, the highest level since records began.
- The number of people waiting over 52 weeks to start elective treatment decreased slightly to 306,996 in November 2021, and the number waiting over two-years increased to 18,585.
- The specialties with the highest number of long-waiters were trauma and orthopaedics, general surgery, and ear nose and throat.
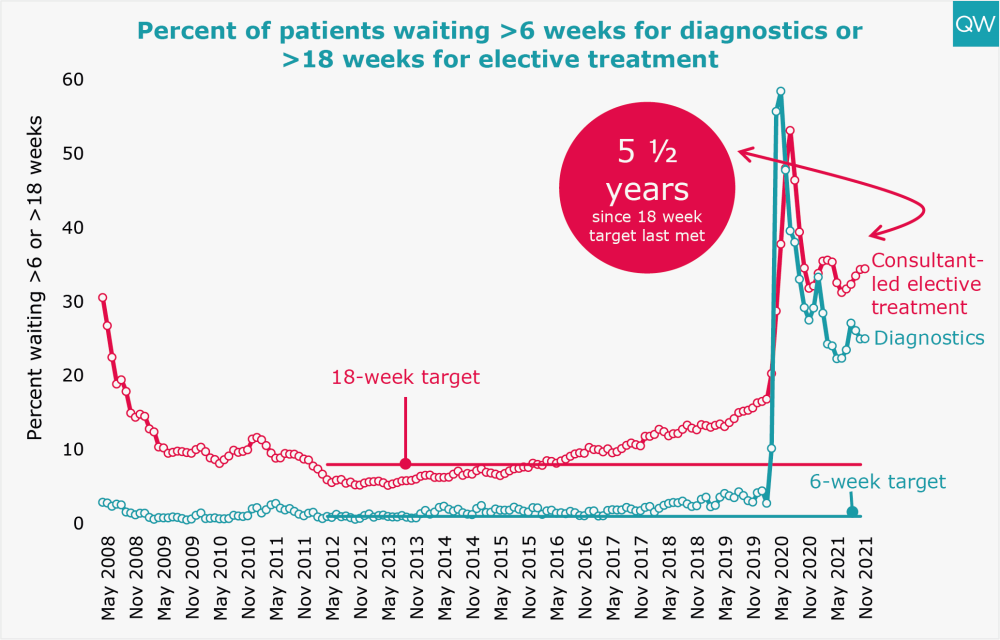
- Over a third of patients (34%) had been waiting over 18 weeks to start elective treatment in November 2021, and one in four patients (25%) had been waiting over six weeks for a diagnostic test.
Planned hospital care and diagnostics
- The total number of people waiting to start consultant-led elective treatment increased to 6 million in November 2021, the highest level since records began.
- The number of people waiting over 52 weeks to start elective treatment decreased slightly to 306,996 in November 2021, and the number waiting over two-years increased to 18,585.
- The specialties with the highest number of long-waiters were trauma and orthopaedics, general surgery, and ear nose and throat.
- Over a third of patients (34%) had been waiting over 18 weeks to start elective treatment in November 2021, and one in four patients (25%) had been waiting over six weeks for a diagnostic test.
For more information, see our treatment waiting times and diagnostic test waiting times indicators.
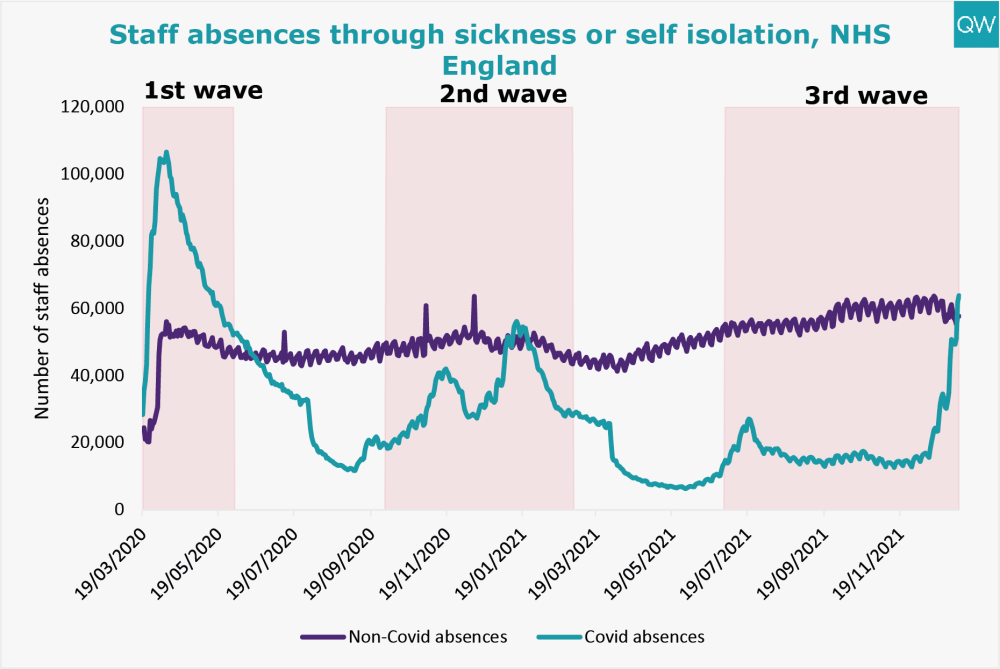
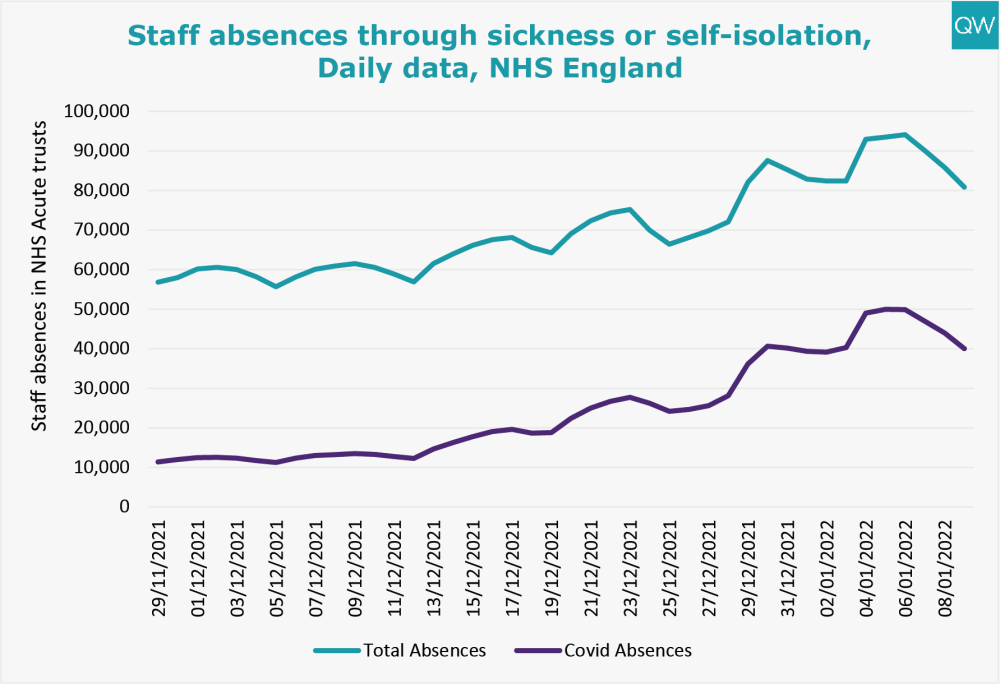
Staff absences
- For the first time since 23 January 2021, more than half of NHS staff absences are because of sickness or self-isolation with Covid-19. As of 5 January 2022, there were 121,472 staff absences, 53% (63,820) of which were due to Covid-19.
- The number of staff absences in acute NHS trusts are also increasing this winter. In Week 1 of 2022 (beginning 3rd January), an average of 88,516 staff per day were absent, up 51% from an average of 58,472 staff in Week 48 of 2021 (beginning 29th November)
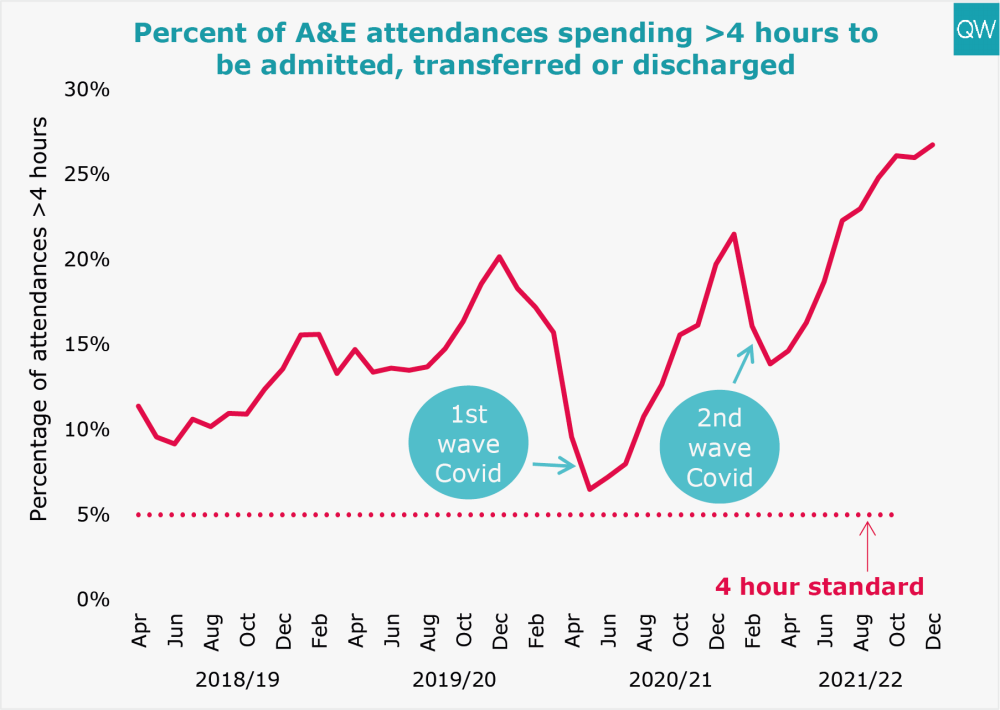
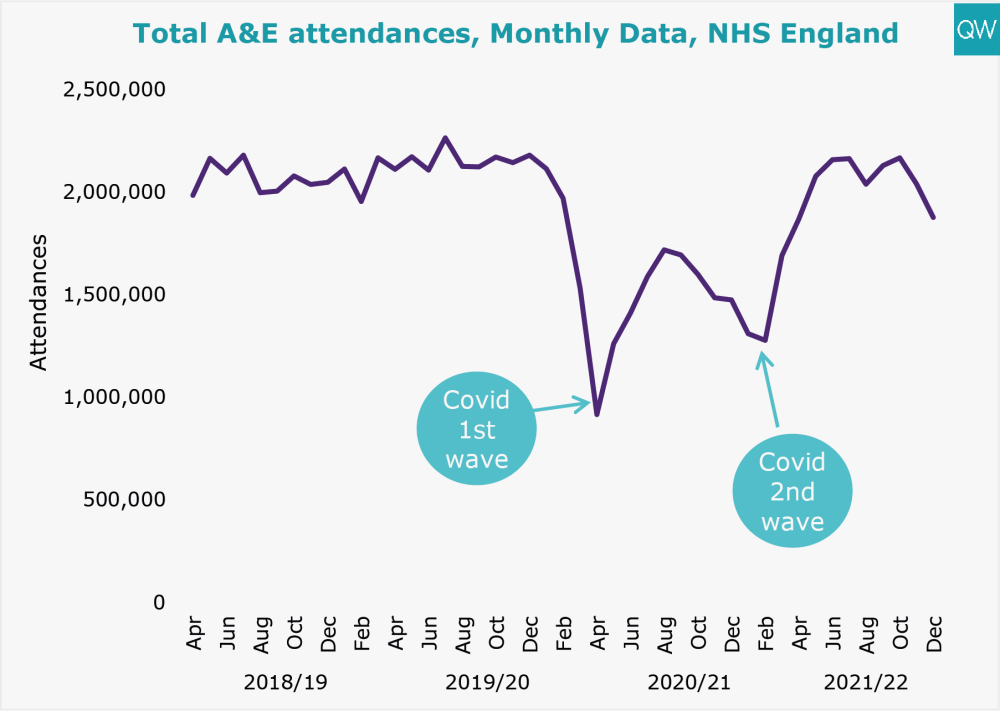
Accident and Emergency
- In December 2021, 27% of people attending A&E spent more than four hours from arrival to admission, transfer or discharge, the worst since records began.
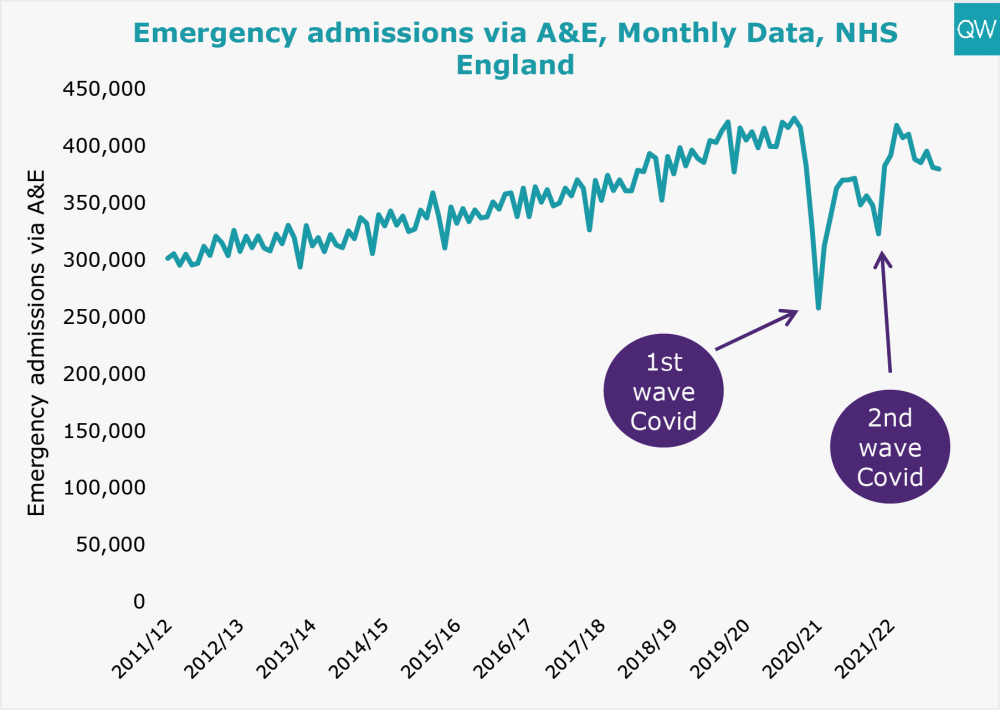
- There were around 1.9 million A&E attendances in December 2021 – 14% lower than pre-pandemic levels in December 2019
- In December 2021, emergency admissions to hospital via A&E decreased on the previous month to 380,032 – 11% lower than pre-pandemic levels in December 2019.
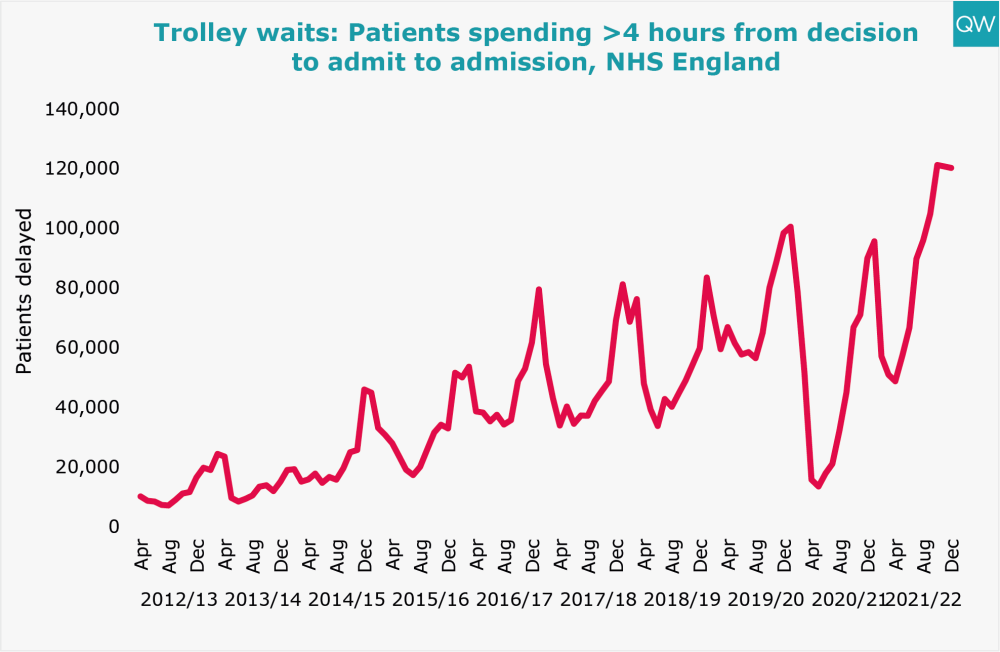
- 120,218 patients spent more than four hours waiting on a trolley from a decision to admit to admission in December 2021, 531 patients less than the previous month but significantly higher than previous years.
- 12,986 patients had a trolley wait of over 12 hours – three times higher than in December 2020 and over five times higher than in December 2019.
For more information, see our A&E waiting times indicator.
Ambulance handover delays
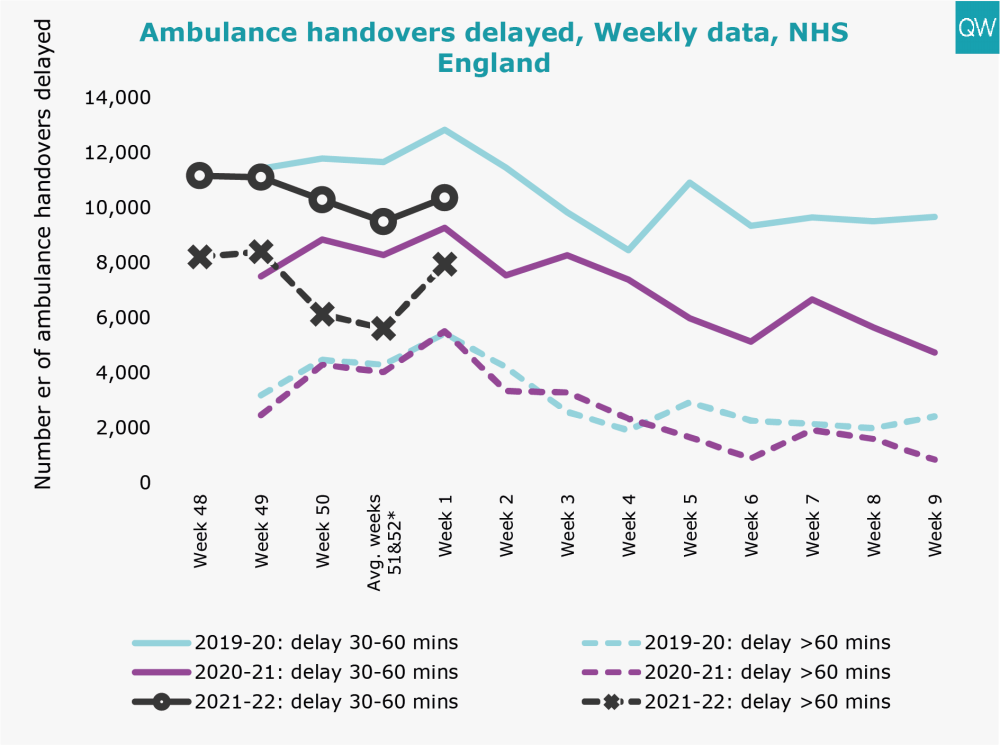
- In Week 1 of 2022 (beginning 3rd January) 18,307 ambulances experienced a handover delay of over 30 minutes – this represents 23% of all ambulances arriving. Of these, 7,948 ambulances experienced a handover delay of over 60 minutes – 10% of all ambulances arriving.
Hospital beds
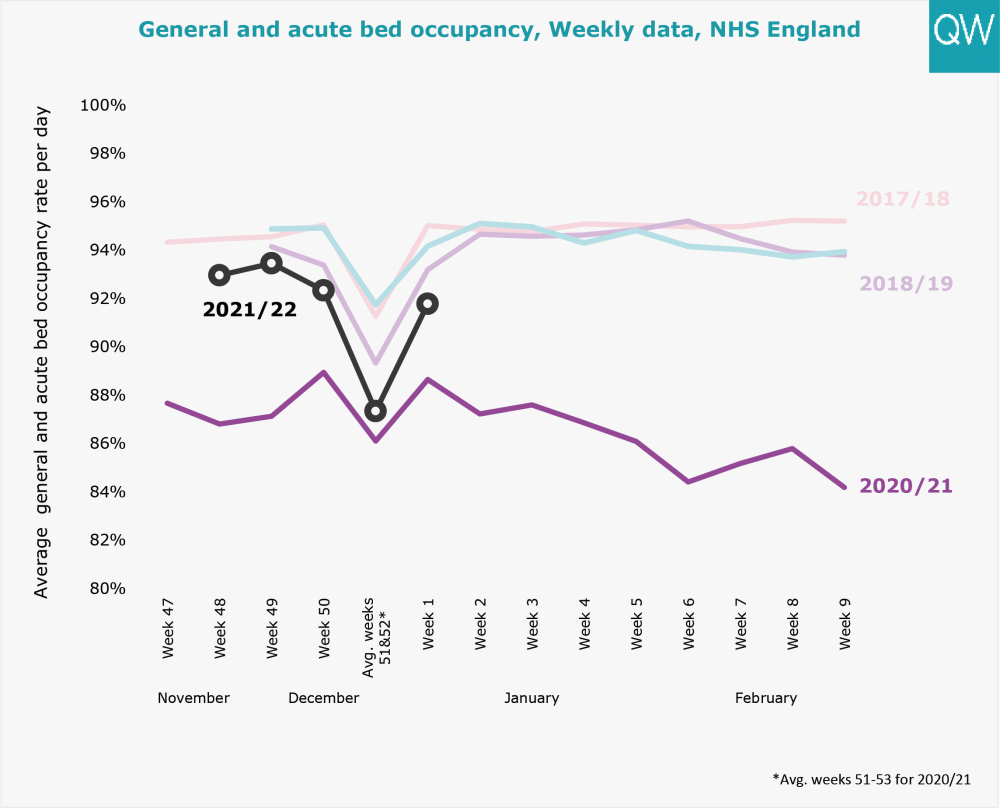
- In Week 1 of 2022 (beginning 3rd January), 92% of general and acute beds were occupied. There was an average of 75,070 general and acute beds available each day – 6% and 2% more than in Week 1 of 2020 and 2019.
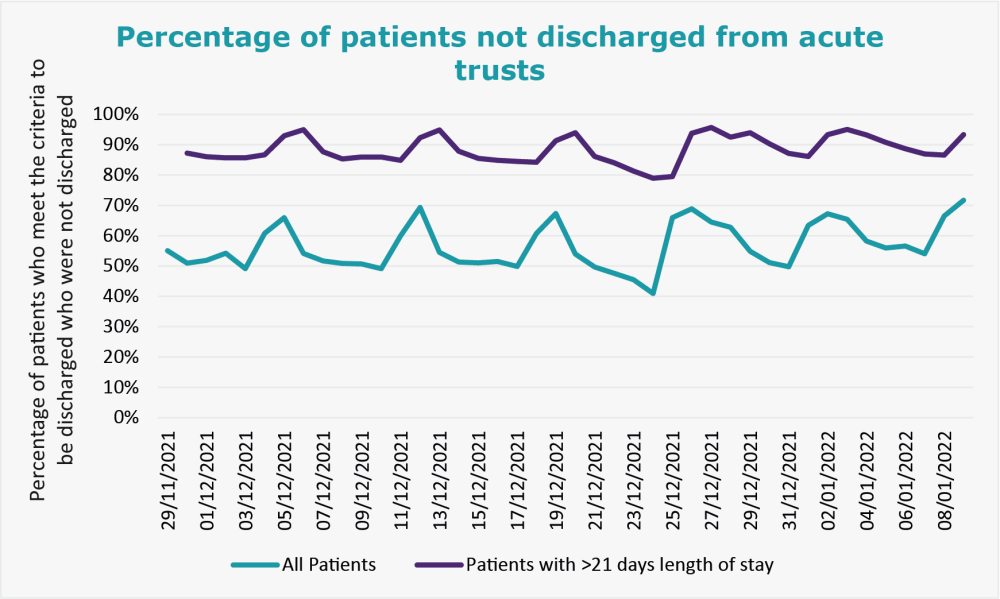
- 53,659 patients who met the criteria for discharge from hospital were discharged in Week 1 of 2022, including 3,863 who had been in hospital for more than 21 days. However, on average 61% of patients in acute trusts who met the criteria for discharge were not per day, and this figure increased to 91% for patients whose length of stay was longer than 21 days.
Cancer waiting times
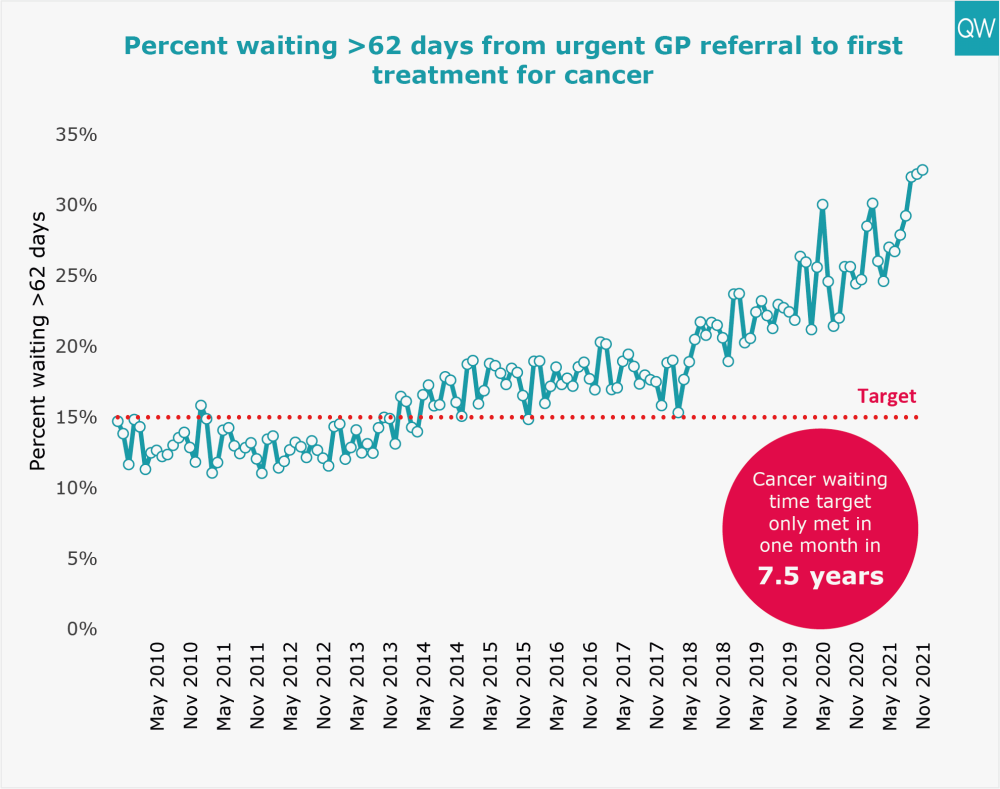
- In November 2021, 33% of patients waited longer than two months to start their first treatment for cancer following an urgent GP referral.
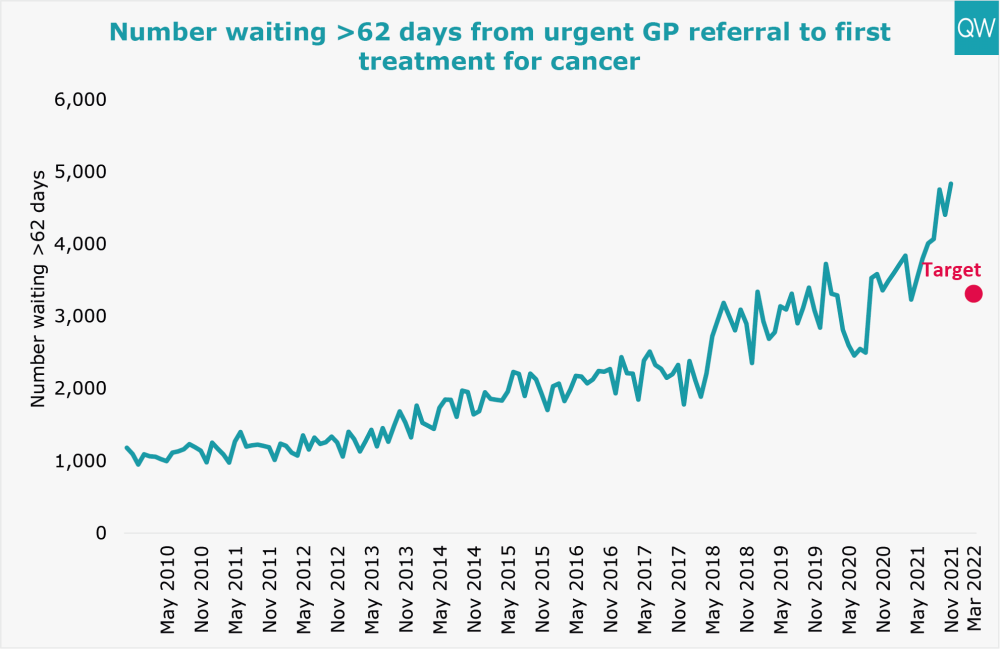
- 4,839 patients waited longer than two months to start their first treatment following an urgent GP referral, an increase on the previous month and further away from the March 2022 target of 3,316 patients.
For more information, see our cancer waiting time targets indicator.
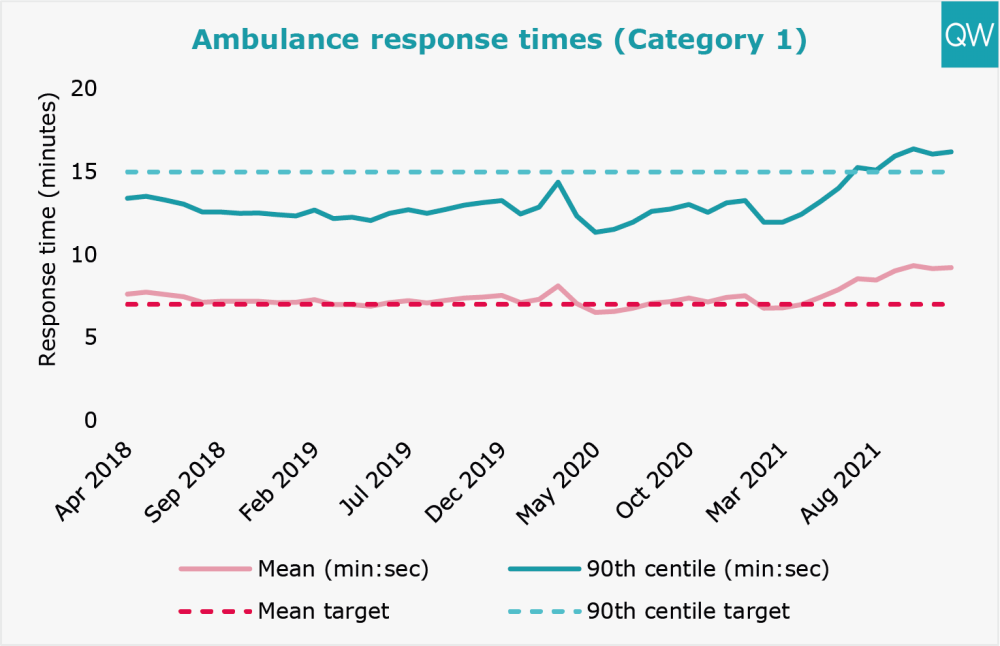
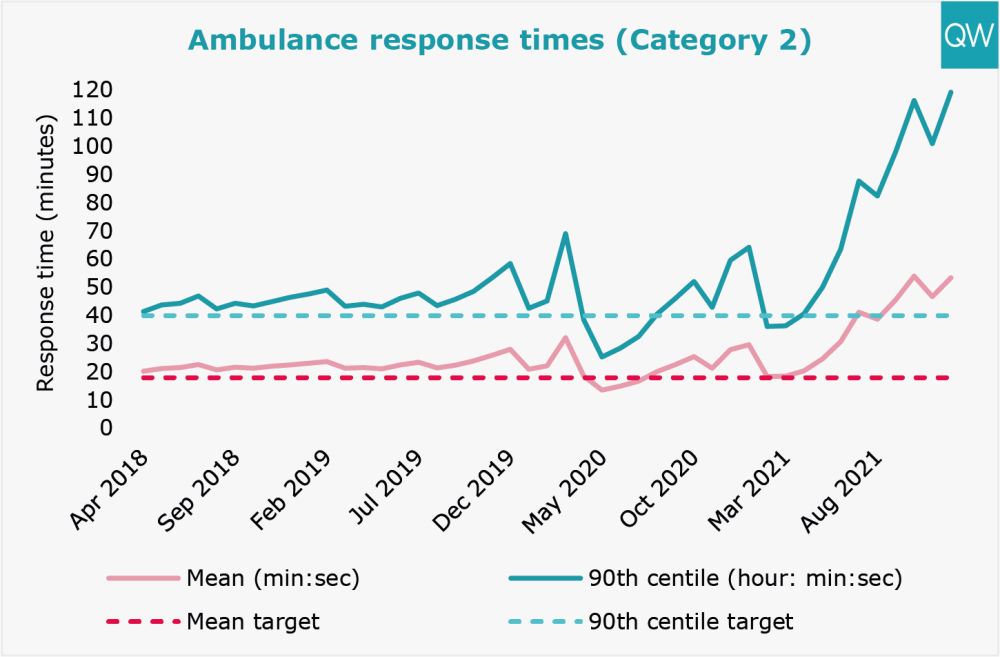
Ambulance response times
- In December 2021, the average response time for Category 1 (life-threatening) ambulance incidents worsened to 9 minutes 13 seconds (mean target of 7 minutes).
- The average response time for Category 2 (emergency) incidents increased to 53 minutes 21 seconds in December 2021 (mean target of 18 minutes). The 90th centile reached 1 hour 59 minutes, almost three times the target of 40 minutes.
For more information, see our ambulance response times indicator.
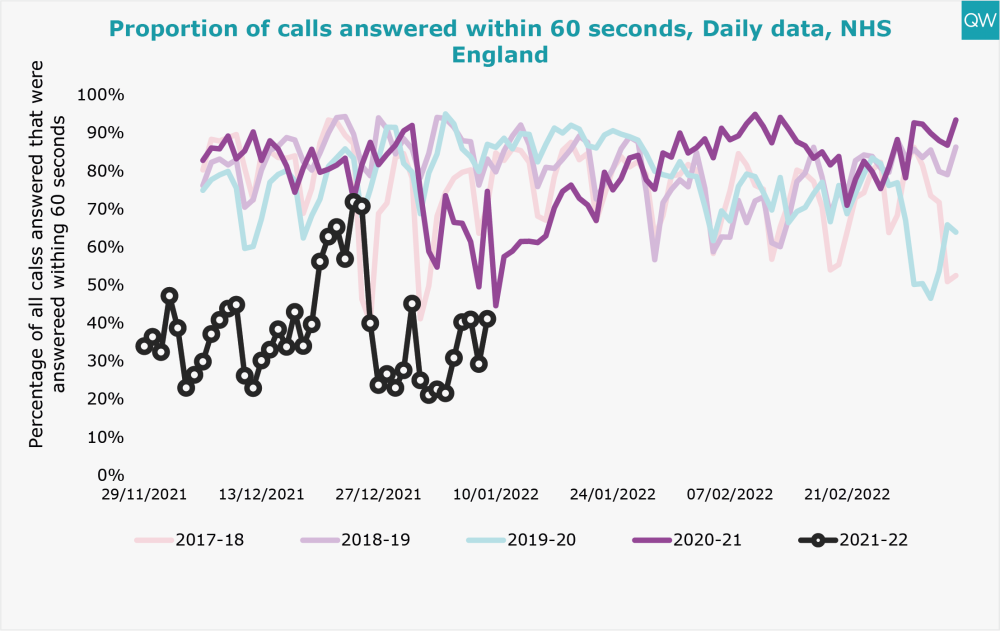
NHS 111
- Between Weeks 48 and 1 of 2021/22 on average NHS 111 recieved 68,291 calls a day, with a peak of 151,080 on 28 December 2021, and on average answer 47,514 calls a day. Over the same time period, 36% of answered NHS 111 calls were answered within 60 seconds.
About this data
During this unprecedented time for the health service, QualityWatch continues to provide independent scrutiny of the health and social care system as far as possible. The most recent data published today reflects changes in access and service use as a result of the coronavirus (Covid-19) pandemic. In light of these shifts in activity, we have added new charts and changed the presentation of some of our usual charts, to aid interpretation. It is also worth noting that NHS England have suspended data collection for some of their performance statistics, including delayed transfers of care.
In March 2019, the Clinically-Led Review of NHS Access Standards Interim Report was released, proposing some significant changes to many of the targets reported on here. A six-month Progress Report from the NHS Medical Director was also published in October 2019. Field testing of the proposed new standards began in 2019 and NHS England has recently consulted on the recommendations for urgent and emergency care.
For urgent and emergency care, the field test sites have not been submitting four-hour performance data since May 2019. The time series presented here excludes the field testing sites and so is comparable across months and years. For elective care, performance of the field test sites will continue to be included in the national time series, so the data is fully comparable over time.
For the urgent and emergency care winter sitrep bed occupancy data, 13 acute trusts (trusts without A&E departments) were removed from the totals. This was for comparison purposes as prior to the week ending 20 December 2020 the data did not include these trusts. Further, the general and acute bed occupancy statistics were calculated by totalling the number of adult and paediatric beds, which were published separately. More information can be found on the NHS England website.
For interactive charts showing the quality of health and social care over time, please refer to our 200+ indicators.