The NHS in England directly employs 1.7 million people (equivalent to 1.5 million full-time staff), with employee costs accounting for around two-thirds of NHS providers’ expenditure. 1 The NHS is the country’s biggest employer and one of the largest employers globally by headcount. 2 According to the NHS Long Term Workforce Plan, the projected demand for staff by 2036/37, will be in the region of 2.3-2.4 million 3 and, if this is met, an estimated 1-in-11 of all workers in England will work for the NHS, compared to 1-in-17 now. 4
Here we lay out the facts – in so far as the existing data allow – on size and structure of the current NHS workforce. We highlight the extent of current shortages and their effect, and outline some of the workforce pressures that lie ahead.
Please note that the latest data in this workforce explainer reflects the staffing levels as at June 2023 and represent a snapshot in time. More up-to-date information can be found in our staffing tracker, which is regularly refreshed alongside key staffing and training targets for the health service.
1. Who makes up the NHS workforce?
The NHS is heavily reliant on professionally qualified clinical staff, which account for around half of all employees. Other key staff groups include those working in central functions, dealing with the NHS’s property and estates, and supporting clinical staff.
The vast majority of NHS staff – 1.4 million people – work in ‘hospital and community services’ as direct employees of NHS trusts, providing ambulance, mental health and community and hospital services. This group also includes the 25,000 staff that work as local planners and commissioners of health services (known as integrated care boards). In addition, around 190,000 people (1540,000 full-time equivalents) work in general practice services. 5
Across NHS hospital, community and general practice settings, there are 188,000 doctors in total and around 423,000 nurses and midwives. These two groups – while large – constitute only just over a third (37%) of the total workforce. This highlights the multi-disciplinary nature of the NHS, with its reliance on others such as health care scientists, physiotherapists and occupational therapists.
These figures focus on staff directly employed by NHS organisations including general practice. In addition, these employers will have indirectly employed staff, for example, through paying a company to provide particular services, such as laundry, catering and cleaning. As well as this, some NHS services are delivered by non-NHS organisations, with those that report data on the workforce totalling 68,000 full-time equivalent staff directly employed in independent health care providers in England (though this is likely to be an underestimate). 6
2. How diverse is the NHS workforce?
One quarter (25%) of NHS staff report being of Asian, black or another minority ethnicity, compared to 13% of all working-age adults in the UK. However, these proportions vary considerably by staff group. For example, while 39% of nursing staff report being of a minority ethnicity, only 7% of ambulance staff do.
However, staff reporting being from ethnic minorities as a whole remain less well represented at senior levels, have worse day-to-day work experiences – including being more likely to experience harassment, bullying or abuse from either colleagues or others – and face more challenges in progressing their careers. There have been some improvements, including falling disparities in the likelihood of entering formal disciplinary processes (which has been subject to a national target) 7 or being a very senior manager (where the inequality is still vast) compared to 2016 (green lines) and in last year’s report (red lines). But the inequalities persist.
Relative likelihood of different career experiences for Black and minority ethnic staff compared with White staff
Chart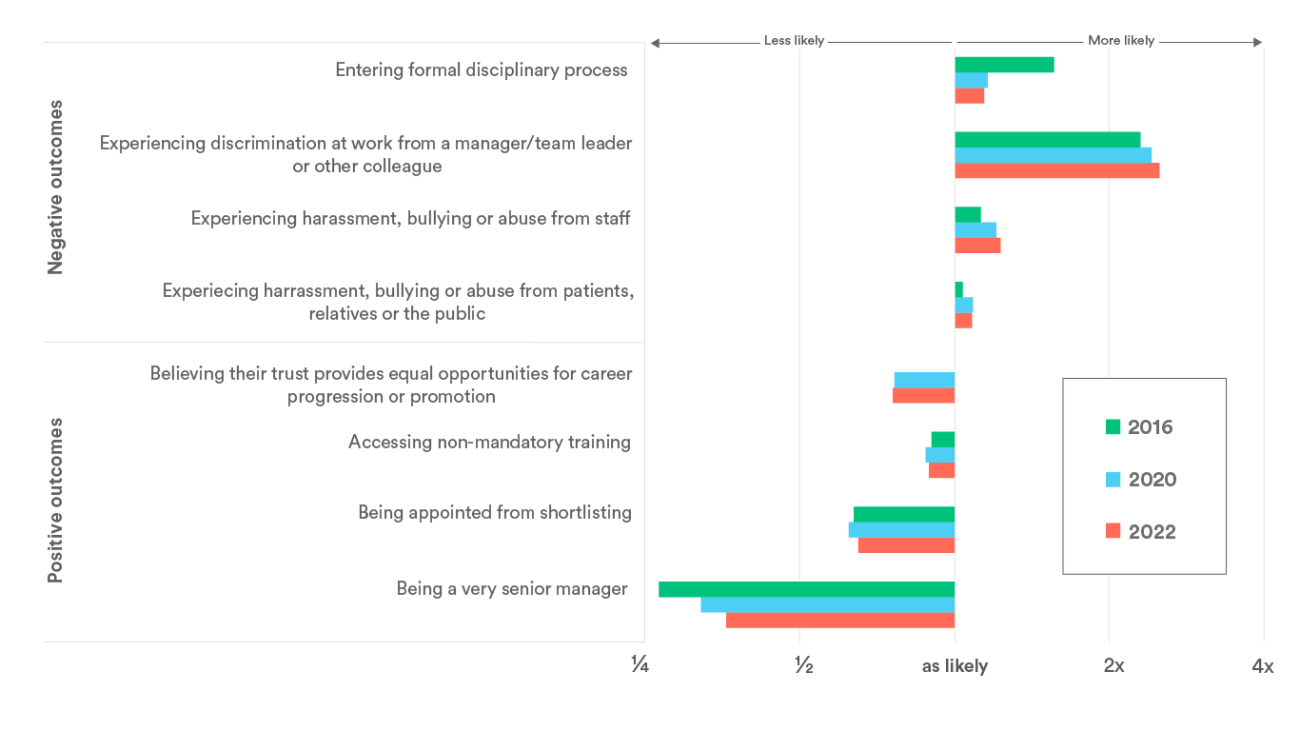
Want to know more? Our 2021 report looked at how the NHS performs on attracting, recruiting and retaining a diverse workforce, including across the range of protected characteristics, such as age, gender, disability, religion and sexual orientation: Attracting, supporting and retaining a diverse NHS workforce
3. What is the overall shortfall in staff in the NHS?
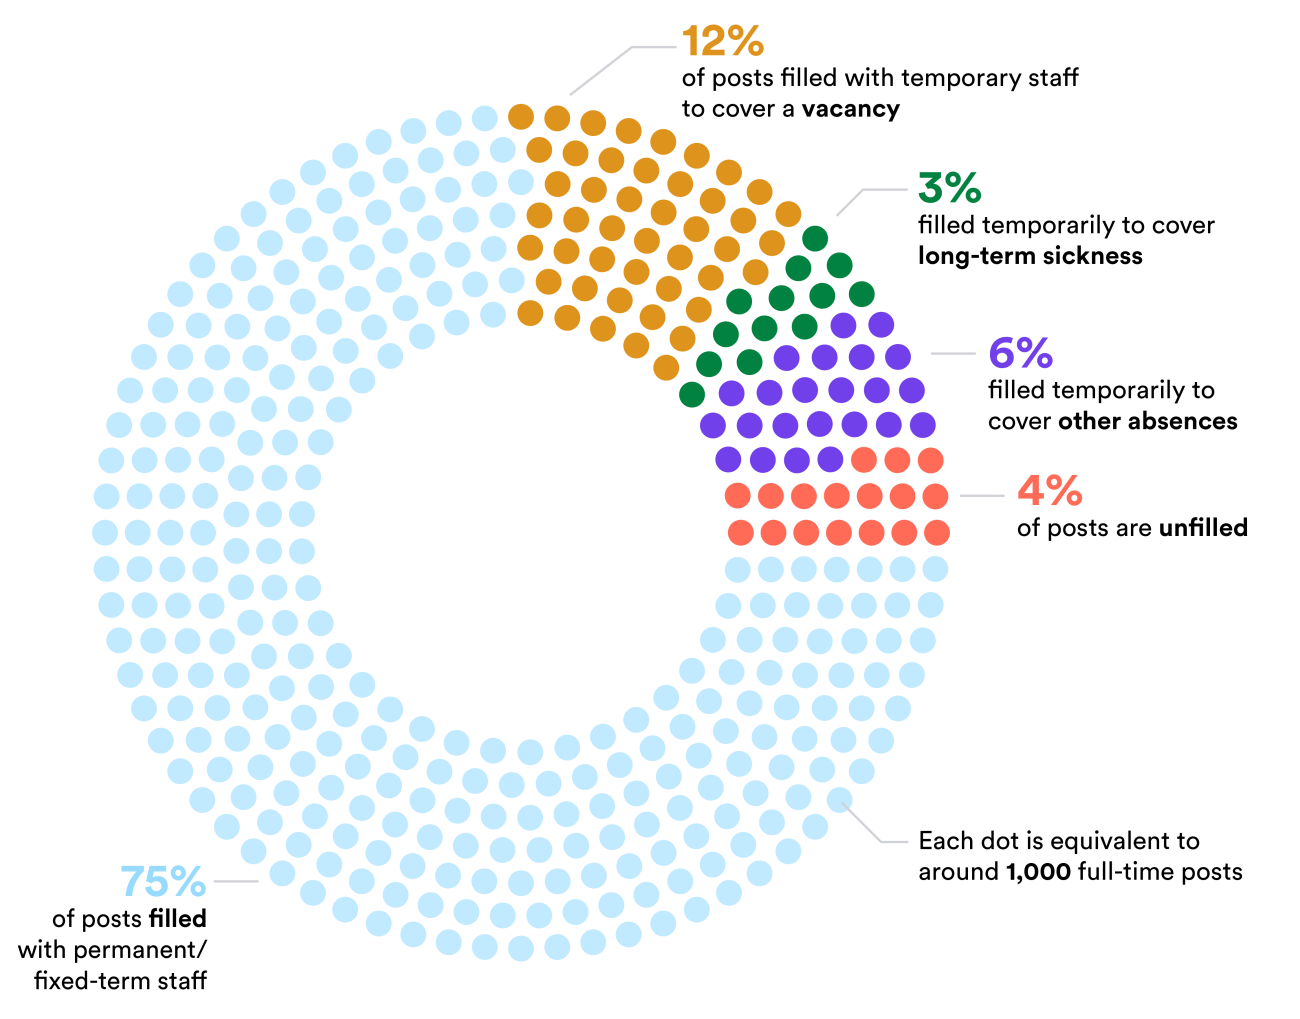
Published data suggests there were 125,572 vacancies (9%) in the NHS between March and June 2023. However, this does not tell the whole story. Somewhere in the region of data based on around 50 NHS trusts suggest that in May 2021, an estimated four in five registered nurse vacancies and seven in eight doctor vacancies were being filled by temporary staff, either through an agency or using their ‘bank’ (the NHS in-house equivalent of an agency). However, some vacancies also remain unfilled by temporary staff, with our analysis suggesting that the NHS may have had some 1,400 unfilled doctor vacancies and around 8,000 to 12,000 unfilled nursing vacancies on a given day. 9
In addition, other gaps in the rota might be caused by absences such as sick leave. During the peaks of the Covid-19 pandemic, the number of staff absent from work on one day reportedly reached over 120,000. 10 Despite sickness absences rising most dramatically during these periods, rates have remained consistently higher than they were pre-pandemic. The most common reason for absence is anxiety, stress, depression and other psychiatric illnesses, which led to an average of over 500,000 sick days per month in 2022. Accounting for all these causes of shortfalls, our previous analysis found that on a given day, around 17,000 nursing and midwifery posts (4%) may be unfilled – although this may vary over time.
Want to know more? We outlined trends in, and reasons for, and impact of sickness absence in the NHS in our briefing: All is not well: Sickness absence in the NHS in England
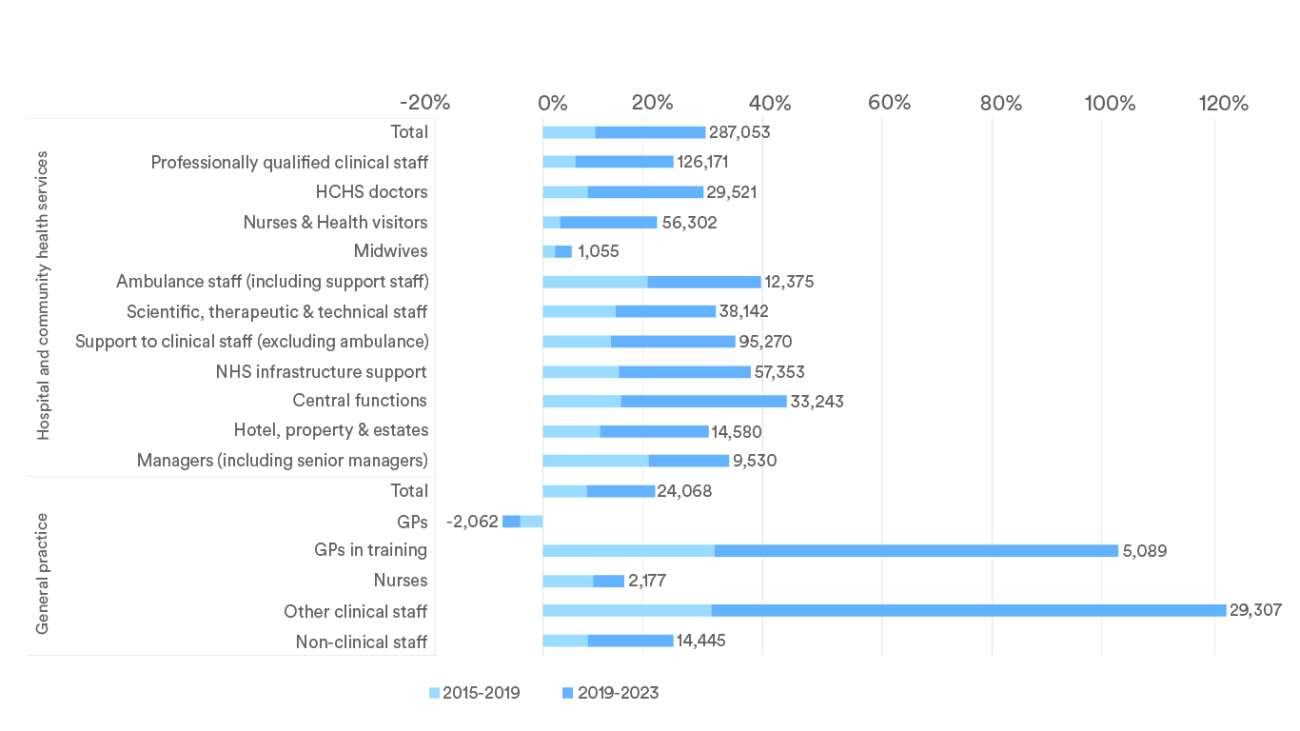
4. How do staff numbers vary by staff group and setting?
The number of NHS staff in England has increased substantially since 2015, with over a quarter of a million (29%) more working in hospital and community health services in July 2023 compared to eight years prior. However, the increase has varied considerably between staff group and setting. In particular, the increase in doctors (28%) in hospital and community services has far outstripped that of nurses (20%). The differences within general practice are even more stark, with the number of GPs in training and of wider clinical workforce (excluding doctors and nurses) more than doubling while the number of fully qualified GPs fell.
Even within a single profession, the growth has varied by specialties and branches. Against a government commitment to increase the nursing workforce by 50,000 by 2024, their number in the NHS increased by 51,245 (17%) between September 2019 and June 2023. However, this increase has not been consistent across the different branches. For example, the number of children’s nurses increased by 72% in the 13 years to June 2023 (from 15,100 to 25,900), while the number of learning disability nurses fell by 44% (from 5,300 to 3,000) over the same period. 11
Clinical support staff
The clinical support workforce are front-line staff who are typically not registered professionals, but deliver a large proportion of hands-on patient care. Support worker roles are identified by the NHS Long Term Workforce Plan as a key way to acquire necessary specialist skills and increase routes into the clinical workforce. Numbers in this group have risen from 288,000 in 2010 to over 401,000 in 2023 – an increase of 40%. Our previous research looks specifically at mental health support staff, where we found that the same promise of good working conditions and training and development to all NHS staff was often not afforded to support staff.
Want to know more? We examined the profile of mental health clinical support staff and discuss how issues around recruitment and retention can be improved: Untapped? Understanding the mental health clinical support workforce
Scientific, therapeutic & technical staff
The wider professionally qualified clinical and scientific workforce account for a large proportion of hospital and community staff, with around 163,000 "scientific, therapeutic and technical" full-time equivalents in June 2023. Overall this group has increased by 36% since 2010. The clinical staff groups within it, allied health professionals, have grown by 44% – although the trend has been inconsistent between professions. For example, while the number of operating theatre staff has increased by 44% and radiography staff by almost half, the number of chiropody/podiatry staff (those that deal with foot problems) has fallen by 19%. 12
Mental health staff
Around 143,700 people are substantively employed by the English NHS to care for people who need mental health services. While the largest group of clinicians within this group – registered mental health nurses – have seen an uptick in their numbers in recent years, there are still fewer mental health nurses in June 2023 than there were 13 years prior.
The NHS Long Term Workforce Plan, released in 2023, highlights that demand is for mental health services is predicted to increase at an especially high rate of around 4.4% a year. The plan sets out ambitions to create a suitable mental health workforce, with an increased focus upon early intervention and prevention – including the aim to increase mental health nursing training places by 93% by 2031/32.
Want to know more?
- We looked at participation and progression in psychology careers and included recommendations for enhancing awareness of different roles and professions that psychology graduates can especially contribute to: The right track: Participation and progression in psychology career paths
- We looked at how inaccurate perceptions and lack of clarity on the roles within mental health services can be a barrier to increasing the size of this workforce: Laying foundations: Attitudes and access to mental health nurse education, with key metrics updated and new insights on mental health nurses in our 2023 paper: In train? Progress on mental health nurse education
Ambulance staff
Year-on-year increases saw full-time equivalent ambulance staff numbers rise from 30,700 in June 2010 to 44,300 in June 2023. While the number of paramedics, the largest ambulance staff group, is similar to what it was in 2018 (14,105 staff in June 2023), the main driver of this growth in recent times is from other staff groups, such as urgent care support workers, the number of whom grew by over 50% in the most recent year.
Recruiting and retaining ambulance staff has been a persistent challenge. Despite this group being one of the few for which pay has risen above inflation since 2010, difficult working conditions, poor relationships with colleagues and crises in service performance are among the reasons why they report some of the lowest levels of satisfaction in the NHS staff survey. 13
Want to know more? We describe the staffing trends and working experiences of ambulance staff in more detail here: Feeling blue: the experiences of ambulance staff
Primary care
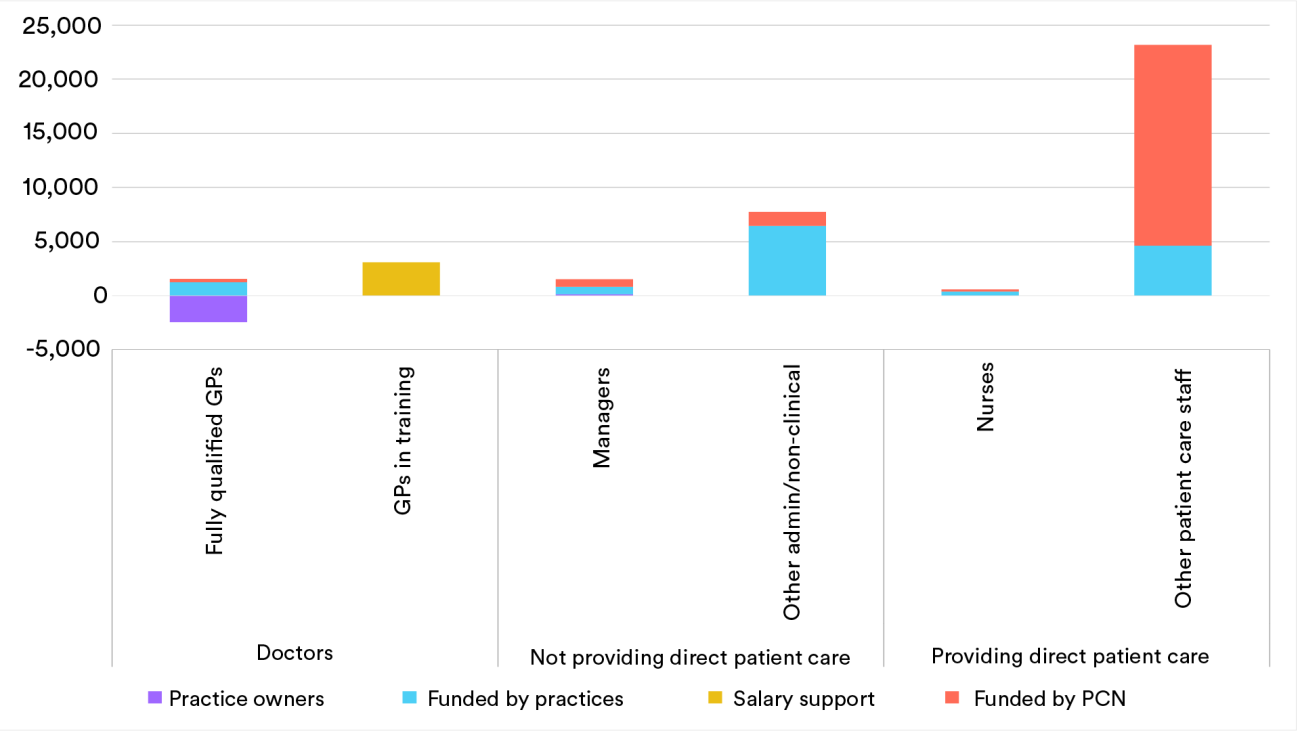
There has been no progress against the target set by the UK government to increase the number of GPs by 6,000 between 2019 and 2024. This follows failure to make any headway against a 2016 ambition to increase the number of GPs by 5,000 by 2020. In fact, the data shows that between June 2019 and June 2023 there was a decline of 848 fully qualified, permanent GPs working in England.
The NHS Long Term Workforce Plan seeks to address this primarily through increasing the number of GP training places, by 50% to 6,000 by 2031/32. However, we have cautioned that previous increases in GP training places have not delivered more GPs and in fact we estimate that, on average, nearly two training posts are required to get one fully qualified, full-time-equivalent GP joiner. 14
The number of practice nurses has hovered around the 24,000 mark for several years. This equates to 17,000 full-time posts as seven out of 10 practice nurses work less than full time. One-third of these staff (33%) are over 55 years old. 15 However, the largest growth, 75% between September 2015 and June 2023 (or over 7,000 full-time equivalents), has been seen in other clinical staff, including pharmacists, social prescribing links workers, care coordinators. Most of these are funded through Primary Care Networks rather than directly by the practices. This has dramatically changed the balance of professions within general practice. Eight years ago there was one other type of clinician in general practice for every fully qualified, permanent GP, but now there are well over twice as many other clinicians.
Want to know more? We wrote about the recent welcome increase increase in general practice staff but the potential mismatch between demand and clinical capacity here: More staff in general practice, but is the emerging mix of roles what’s needed?
Community health nurses
Despite ambitions to move more care to the community, the NHS nursing workforce in this setting does not appear to have kept pace. In particular, the fall since 2010 is equivalent to almost half of NHS community matrons and district nurses and over one in three school nurses (35%). NHS employed health visitor numbers have also fallen significantly by 29%. 16 It is important to note that responsibility for some of these staff does not lie with the NHS, and the NHS has seen its remit shift over time. We previously looked at the wider community nursing workforce in more detail, highlighting that the trend in these vital workers has varied between the different roles. We still can’t quite be sure exactly what’s going on; 17 however, it is concerning that the total number of registered speciality community public health nurses and registered district nurses across the UK has fallen since 2016. 18
5. How do staff numbers vary by geography?
Staff shortages also vary considerably by region, with the highest percentage of full-time equivalent vacancies in London (11.6%) and the lowest in the South West (6.7%). Previous analysis suggests practices that reported data in more deprived areas of England have fewer GPs per person on their list than those in less deprived areas. England also now appears to have the lowest level of GP staffing of any of the four UK countries. Although there are attempts to improve equity in GP supply across the country, 19 these initiatives must be able to constantly identify and monitor areas with the greatest patient need.
Want to know more? We explored how recruitment and retention premia are used here: Placed at a premium? The use of recruitment and retention pay supplements to address staffing shortfalls
6. What are the implications of these shortfalls?
A shortage of clinical staff can have various negative impacts. Firstly, the level of clinical staff can affect the quality and safety of care being delivered. For example, the number of registered nurses and doctors is significantly associated with reducing mortality rates. 20 Secondly, workforce shortages can lead to higher costs. While many ‘vacancies’ are filled with temporary staff day to day, using temporary staff can be expensive. 21 These temporary solutions can also be disruptive to health services and reduce the ability to deliver continuity of care to patients.
Staff shortages are also a vicious cycle. A parliamentary report highlighted the link between vacancies and staff burnout (which has been exacerbated by Covid-19 pressures), with overstretched staff taking on additional hours to fill current staff gaps. 22 Similarly, results from the NHS staff survey show that understaffing is also a key factor in decisions of staff to leave their role. 23 Shortages also impede the ability to educate and supervise those in training which again only compounds the staffing issues.
As such, it is clear that addressing shortages is a matter of urgency. Indeed, the independent regulator of health services highlighted that “workforce shortages are having a direct impact on the quality of people’s care. These shortages must be addressed”. 24
7. How did we get to this situation?
When the NHS was established in 1948, it was supported by around 144,000 staff. 25 The trends in levels of staffing throughout the history of the NHS have been variable across time periods and professions. Due to changes in how data are collected over time, piecing together the long-term trend is difficult, but the available information suggests a growth in hospital doctors has been by far the most dramatic and consistent. In 1949, there were 1.4 medics and dentists per 2,000 people, which has increased to 5.1 in 2023. The trend in the level of GPs per head of population – as far as we can tell – appears to show less growth, with the number of staff in relation to the population remaining fairly stagnant over time.
Meanwhile, the level of nursing appeared to have been stagnant for some time. 26 The government’s 2019 ambition for 50,000 more nurses over a five-year period required an unprecedented growth in numbers. The nursing workforce grew by almost 44,000 full-time equivalents between September 2019 and June 2023, suggesting the ambition will be met if progress is sustained. However, in the face of insufficient domestic recruitment, and a ‘leaky’ training pipeline, the NHS is relying increasingly on recruitment from abroad to fill nursing roles, as discussed in our recent report.
Domestic supply
A key factor contributing to the shortfalls has been a failure to train sufficient numbers of staff. This has been particularly pronounced for nurses, where there was a large decline in the number starting nursing after the early 2000s. 27 Issues still remain, with a decrease of 4,620 (20%) placed applicants onto university courses in the 2023/24 academic year, relative to the peak in 2021/22. Not only this, but there is a high proportion of university students not completing their nursing course or not becoming NHS nurses post-graduation. One estimate suggested that for every five university nursing places, only three full-time equivalent nurses eventually join the NHS. In fact, looking at new joiners to graduate-level positions suggests that in the year to March 2022, compared with the two years before this (2019/20), the number of UK-national nurses joining NHS hospital and community services fell by 32% (6,325 nurses, excluding health visitors). 28 Since we highlighted this issue, another year's worth of data has been published and, concerningly, the number of homegrown nurses joining the NHS continues to be well below the pre-pandemic levels.
Change in the number of UK nationals joining the NHS at Band 5 compared with the year ending March 2014
Chart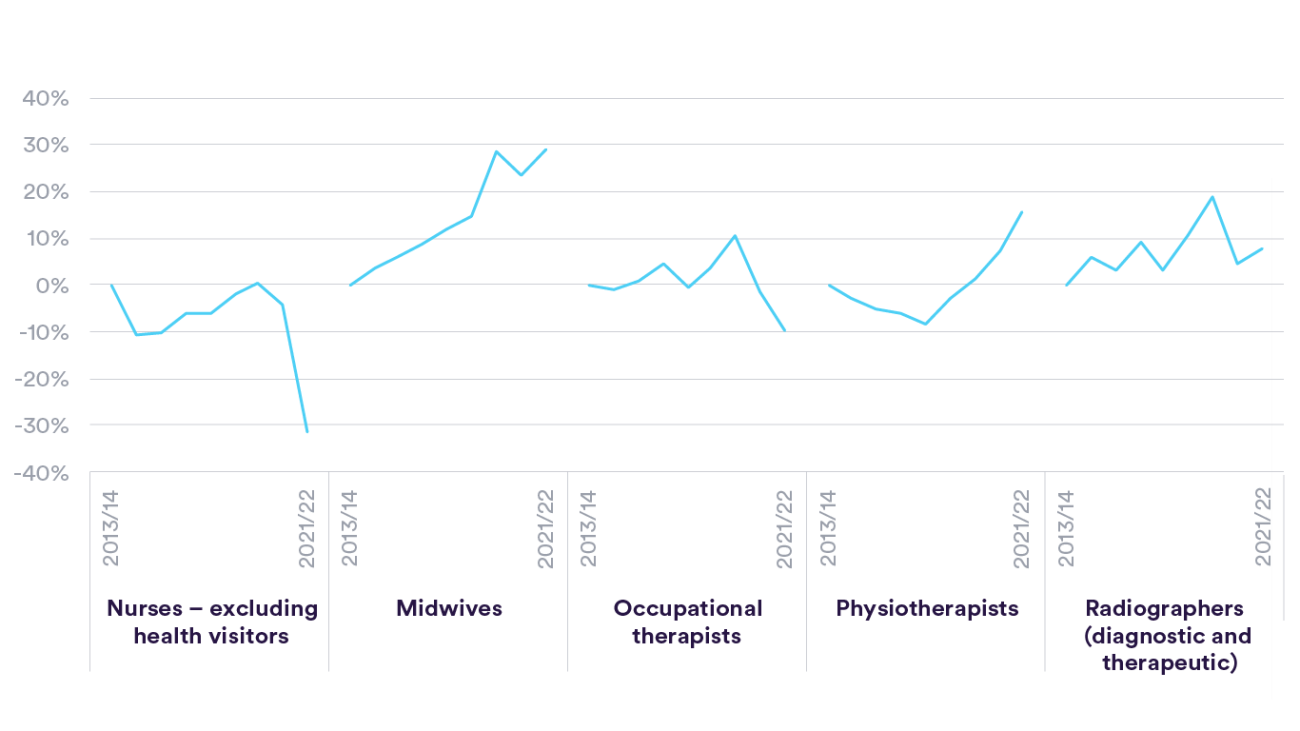
There are also substantial issues in the supply of homegrown doctors. Historically, most medical students have graduated and gone on to join the NHS but, thereafter, there appears to be significant retention issues. Fewer than three in five doctors (56%) in ‘core training’ remained (even in a different role) in NHS hospital and community services in England eight years later, with 24% of this attrition seen in the first two years. And, while the data on the GP training pipeline are limited, we estimate that, on average, nearly two training posts are required to get one fully qualified, full-time equivalent GP joiner. 29
Want to know more? We set out the scale of the leaks in the training pipeline and put forward a 10-point plan to fix it, including a policy proposal to gradually write off clinicians' student debt over 10 years, here: Waste not, want not: Strategies to improve the supply of clinical staff to the NHS
International recruitment
When domestic supply of staff is insufficient to meet demand, the health service has a heavy reliance on international recruitment. One-in-six (16.5%) of hospital and community sector staff were recorded as having a non-British nationality as at June 2022. 30 Nearly half of nurses and midwives joining the professional register in the year to March 2023 trained outside the UK. In 2015, nurses were added to the list of shortage occupations by the Migration Advisory Committee (a non-departmental public body that advises the government on migration issues), initially on a temporary basis. They have remained on this list ever since. Since the Brexit referendum, the proportion of international recruits joining from the EU/EEA has dropped substantially across a range of specialties. Higher levels of international recruitment have often been driven by national targets and support in response to unforeseen additional demand for staff (such as following the Francis Inquiry and safe staffing guidelines, and, more recently, due to the Covid-19 pandemic).
Want to know more? Our briefing analyses the benefits, pitfalls and ethical concerns surrounding the use of overseas recruitment to address shortfalls in nursing staff numbers: Return on investment of overseas nurse recruitment: lessons for the NHS Briefing
Retaining existing staff
As well as recruiting new staff, it is also vital to keep the existing workforce. The number of hospital and community health staff leaving the NHS was 11.2% in the year to June 2023. Despite pay being the main point of dispute during the strikes seen in recent months, a multitude of reasons drive NHS staff to leave their roles, with stress and understaffing coming out ahead of pay.
A recent NHS programme to improve the retention of nurses appears to have made a positive impact and, in turn, improvements in patient care too. 31 But there is clearly much more that needs to be done, and current actions are having to redress a situation caused by a history of the workforce all too often been neglected or not prioritised in previous NHS policies and plans. 32
Want to know more?
We produced a briefing on the high levels of leavers in 2022: Peak leaving? A spotlight on nurse leaver rates in the UK
We also produced a stocktake about what is known and not known about the numbers of staff leaving NHS (and social care roles), and the reasons given for moving on: The long goodbye? Exploring rates of staff leaving the NHS and social care
We have also looked at the issues facing NHS staff (and surgeons in particular) with parental or caring responsibilities: Future proof: The impact of parental and caring responsibilities on surgical careers
Our 11-point plan to improve the pay review process, which has implications for retention and recruitment is here: Basis of negotiation: recommendations to improve the NHS pay review process
8. How do we compare to other countries?
Comparisons with other countries must be treated with caution due to differences in, for example, geographies, service design, and data. While it appears the UK as a whole have relatively few staff in key groups compared to other developed countries, different countries have different levels of skill mix, with the UK (particularly in England) employing more support staff per head compared with other countries. 33
Further discussion about how we compare internationally is available in our international comparison report, which highlighted the NHS as having higher bed occupancy rates, lower numbers of key staff and lower levels of capital investment compared to other high-income countries – meaning that it is likely that the NHS’s road to recovery from Covid-19 may be longer than other health systems. 34
9. What is the outlook for the future?
Despite increases in the overall numbers of staff, there still remains a workforce crisis in the NHS. Whereas financial problems can be solved by increasing funding, it is far more difficult to solve workforce ones: when clinical professionals leave, they are not easily or quickly replaced.
The NHS Long Term Plan acknowledged how vital the workforce is to the service, and that the size and profile of the workforce was falling increasingly out of step with the needs of the population. It boldly envisages that the intakes for courses to train new clinicians will increase by around two-thirds to 2031 and that the NHS will employ over 900,000 more staff over 15 years. And yet the additional funding for training only kicks in for 2025 and, at the time of writing, there was still no commitment that additional budget would be available to employ this many extra staff. There will also be challenges in ensuring there are sufficient numbers of academic and clinical educators and supervisors to deliver the training, particularly given these will largely need to be found from a current NHS clinical workforce that is often already under huge strain. 35
Another key issue facing the NHS workforce is around the regulation of ‘emerging’ professions. The purpose of regulation is to protect those using its services from the risk of harm and to maintain public confidence in those delivering care. However, the growth in new professional roles, changing expectations of many existing roles, and the large-scale migration of clinicians introduce real challenges for the regulation of different staff groups. The progression of legislation around the regulation of Physician and Anaesthesia Associates (and subsequent implementation) as well as current considerations around regulation of advanced clinical practitioners will be important factors in how these staff are used and perceived.
The data we have used in this explainer captures changes to workforce trends that may have been influenced by the government’s response to Covid-19. The persisting impact of the pandemic on the health service, coupled with present political and economic instabilities, adds to the complex web of challenges that the NHS faces in ensuring it has the right workforce.
Want to know more?
Doing right when you are wrong: perspectives on workforce planning in the NHS in uncertain times
We explored the key considerations around regulation of advanced practitioners here: Independent report on the regulation of advanced practice in nursing and midwifery
Suggested citation
Nuffield Trust, "The NHS workforce in numbers" This explainer was first published in 2017 and has been updated regularly.